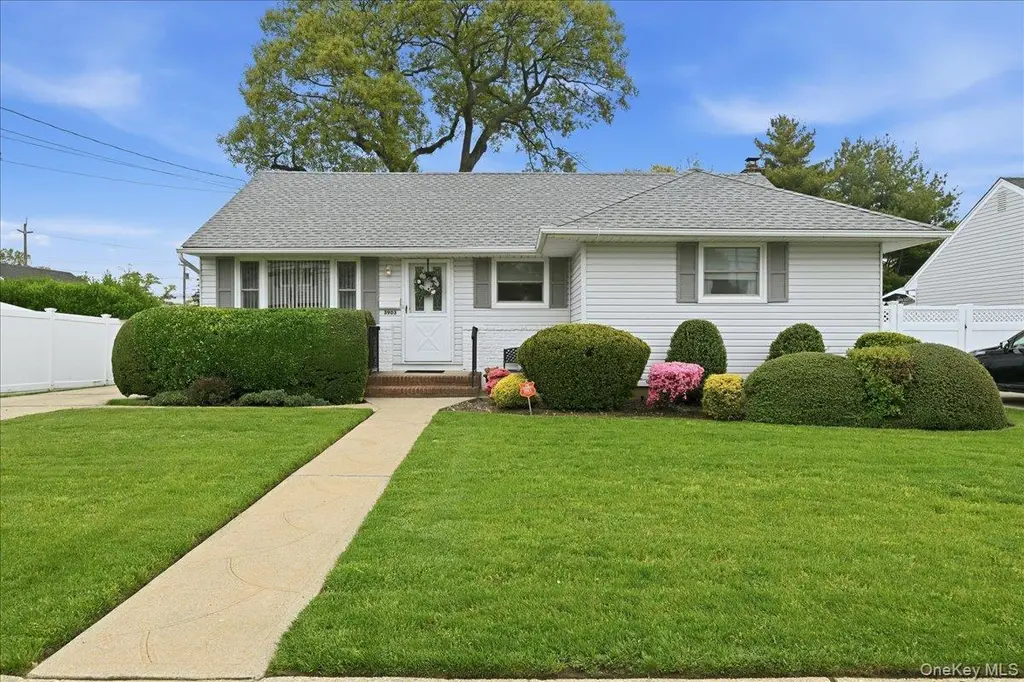
3903 Lincoln St · Seaford, NY
Flood risk 1/10 · Minimal
- FEMA flood zone
- X (unshaded)
- Chance of flooding over 30 yrs
- 0.0%
- Est. flood insurance / yr
- $473 – $860
Fire risk 1/10 · Minimal
- Est. fire insurance / yr
- $691 – $1,283
Heat risk 6/10 · Moderate
- Hot days now (above 94°F)
- 7 days/yr
- Hot days in 30 yrs
- 16 days/yr
Wind risk 6/10 · Moderate
- Chance of severe wind over 30 yrs
- 61.0%
Air-quality risk 4/10 · Minor
- Unhealthy air days now
- 3 days/yr
- Unhealthy air days in 30 yrs
- 5 days/yr
Risk factors via First Street. Map © Google.
Why this score? — see what drove the D grade
The composite is a weighted blend of 9 inputs, each scored 0–100. Each bar is that input's sub-score; the figure is the points it added to the 100-point composite (weight × sub-score).
- ARV discount +15.0/15.0
- Cash flow +7.6/30.0
- Schools +7.1/10.0
- Livability +4.0/5.0
- Rent growth +2.5/5.0
- Condition / age +2.5/5.0
- 1% rule +2.4/10.0
- DSCR +1.7/10.0
- Appreciation +0.0/10.0
$699,000
🖨 Deal sheet (PDF) 📄 Offer letter ✓ Due diligence
Listing remarks
Summer is fast approaching. Now is the time to purchase a home that offers an easy-living lifestyle in a location that offers so much. This charming three-bedroom one full bathroom ranch style residence with an expansive full basement is situated on a quiet residential street where pride-of ownership is evident with well-maintained properties throughout the neighborhood. The property's lot dimensions are 62' x 121' which is a rare find in today's housing market. The home's pristine curb appeal is highlighted by a classic color palette, colorful perennials, and a well-manicured lawn. The foyer entryway leads to the sun-drenched formal living room and dining room. The kitchen features 2023 ap
Key facts
- Well manicured lawn
- 2023 appliances
- Colorful perennials
Tags
Property features AI
Exterior
- Parking: One garage space; Garage with door opener; Oversized garage; On-street parking; Additional storage in garage; Total of 4 parking spaces
- Utilities: Electricity connected (PSEG); Public sewer; Public water connected; Trash collection (public)
- Home design: Single family residence; Two levels; Actual condition (as recorded)
- Construction: Brick and frame construction with shingle and vinyl siding; Block foundation; Built with partial attic (full, partially finished with pull-down stairs and storage)
- Exterior features: Garden; Exterior lighting; Mailbox; Rain gutters; Back yard; Front yard; Landscaped; Level lot; Near schools; Near shops; Front and rear sprinklers
Interior
- Kitchen: Dishwasher; Microwave; Oven; Refrigerator; Stainless steel appliances; Exhaust fan; Breakfast bar; Eat-in kitchen; Pantry
- Bedrooms: Bedroom on the first floor
- Flooring: Carpet; Hardwood; Laminate; Linoleum
- Bathrooms: One full bathroom
- Heating & cooling: Central air conditioning; Baseboard heating; Hot water heating; Oil heating; Other heating
- Interior features: First-floor bedroom; First-floor full bath; Breakfast bar; Built-in features; Ceiling fans; Crown molding; Eat-in kitchen; Entrance foyer; Formal dining room; Natural woodwork; Pantry; Storage; Wall of windows; Patio; Porch; Grip-accessible features
- Laundry & utility: Washer hookup; Dryer hookup (electric); Washer and Dryer included; Washer/Dryer hookup; Oil water heater
Neighborhood map
What this means for you Summary
Snapshot
- This is a 3-bed/1.0-bath single-family listed at $699k.
Deal economics
- At list price, monthly cash flow is $-849 ($-10k/yr) — negative.
- To cash-flow at today's rent, offer at most $549k (21.5% below list).
- To meet the 1% rule (rent ≥ 1% of price), the offer needs to be $514k (26.4% below list).
- Recommended offer: $514k (26.4% below list) — sets the bar for 1% rule.
- Cap rate 4.8% vs local median 3.3% in Seaford — top-decile yield for the area; either an underpriced asset or a hidden risk that comps aren't pricing in. Stress-test before assuming the spread holds.
Location & tenants
- Location reads 80/100 on livability (#115 in NY, #1,864 nationally) — a professional / high-income tenant draw. Strengths: crime A+, commute A+, employment A+; Watch: cost of living F.
- Seaford Union Free School District (suburban): math 73% / reading 81% proficiency, ranked #53 of 590 in NY (top 9%) — strong family-tenant draw, lease renewals of 3-5y typical; only 6% free/reduced lunch — higher-income household profile.
- Zoned schools: Seaford Manor School (math 92% / reading 87%, grade A+, #45 of 2,108 statewide, top 3%, 445 students, 10% FRL); Seaford Middle School (math 42% / reading 72%, grade B, #192 of 729 statewide, top 28%, 517 students, 15% FRL); Seaford Senior High School (math 98% / reading 98%, grade A+, #19 of 1,100 statewide, top 4%, 658 students, 16% FRL).
- Market conditions: 93 active listings in the ZIP; 3 comparable units currently listed for rent nearby; rentals lingering (median 46d on market — plan ~5-8 weeks vacancy on turnover, expect pricing pressure); 67% of comp listings sitting > 30 days — soft ceiling on asking rent; 824 units permitted in Nassau County in 2024 (153 in 5+ unit buildings).
Forward outlook
- Local home prices are declining (-3.0%/yr); year-one equity from $5k of loan paydown is wiped out by about $21k of value loss. Plan a longer hold.
- Nassau County population projected at +7% by 2050 — modest demand growth; plan on rents tracking national, not racing it.
Negotiation context
- Only 4 days on market — expect competitive offers; lowballing is unlikely to land.
Risks & watch-outs
- Watch-outs: built in 1951 — expect roof / HVAC / electrical / plumbing capex.
- Climate carrying-cost: major wind risk, 61% chance of damaging wind over 30y; extreme-heat days projected 7→16/yr by 2055 (HVAC capex compounding) — expect insurance premiums to compound above CPI over the hold.
Questions for the listing agent
- What do current leases actually rent for vs. the listed asking? Can we see a recent rent roll and the last 12 months of T-12 income?
- Built in 1951 — when were the roof, HVAC, electrical panel, plumbing, and water heater last replaced?
- Is there a deadline driving the sale (1031 exchange, divorce, estate, relocation)? That informs how much negotiation room exists.
- Schools are A-rated — typically a magnet for longer-tenancy family renters. What's the average tenant stay here, and is there a school-zone premium baked into asking?
- The area grade is low — what's the realistic commute time and amenity access for the typical tenant pool here? Any planned neighborhood developments (good or bad) we should know about?
- What's the average days-on-market for RENTAL listings here right now (not sales)? A rising rental-DOM trend means longer vacancies and softer asking-rent achievability than the comps imply.
- What's the recent tenant-quality profile in this submarket — average credit score on applications, eviction rate, late-payment / NSF rate, and stable-employment percentage? A property-management company in the area should have these aggregated.
- How much new for-sale + rental construction is in the pipeline within 1–3 miles? Heavy new supply typically softens prices + rents 12–24 months out; constrained supply supports both.
Investment metrics
- 1% rule
- 0.74% ✗
- Cap rate
- 4.84%
- Cash-on-cash
- -5.20%
- DSCR
- 0.77
- GRM
- 11.3
CMA / ARV
- ARV (median comp)
- $853,943
- List price
- $699,000
- Delta
- -18.14%
- Verdict
- UNDERPRICED
- Comps
- 20 within 1.0 mi
Show comp detail 12 sales within ~0.75 mi
| Address | Dist | Beds/Ba | Sqft | Sold | Price | $/sf | Match |
|---|---|---|---|---|---|---|---|
| 1595 Washington Ave | 0.36mi | 4/2.0 (+1) | 1,407 (-0%) | 0mo | $670,000 | $476 | 74 |
| 3860 Maplewood Dr | 0.14mi | 3/1.0 | 1,278 (-9%) | 6mo | $620,000 | $485 | 74 |
| 3902 Beechwood Pl | 0.18mi | 4/1.5 (+1) | 1,348 (-4%) | 5mo | $699,000 | $519 | 73 |
| 3862 Clark St | 0.07mi | 4/2.0 (+1) | 1,300 (-8%) | 2mo | $820,000 | $631 | 73 |
| 3799 Mansfield Dr | 0.33mi | 4/2.0 (+1) | 1,394 (-1%) | 8mo | $685,000 | $491 | 68 |
| 17 Hawthorne St | 0.67mi | 3/2.0 | 1,443 (+2%) | 1mo | $728,000 | $505 | 60 |
| 3861 Wilburne Ave | 0.48mi | 3/2.0 | 1,558 (+11%) | 3mo | $790,000 | $507 | 54 |
| 1691 Lehigh Rd | 0.62mi | 2/1.0 (-1) | 1,508 (+7%) | 2mo | $690,000 | $458 | 53 |
| 533 Forest Ave | 0.58mi | 3/1.5 | 1,283 (-9%) | 9mo | $690,000 | $538 | 49 |
| 1750 Yale Ct | 0.69mi | 4/2.0 (+1) | 1,352 (-4%) | 6mo | $750,000 | $555 | 47 |
| 85 Riverside Ave | 0.59mi | 4/2.0 (+1) | 1,557 (+11%) | 0mo | $730,910 | $469 | 45 |
| 3615 Franklin St | 0.56mi | 3/2.0 | 1,600 (+14%) | 6mo | $835,000 | $522 | 42 |
Match score weights: distance 35% · size 25% · config 20% · recency 20%. Top-matched comps best support the ARV.
Projected returns pro-forma
-3.0% appreciation · 3.0% rent growth · sell at horizon
- IRR
- -25.1%
- Equity multiple
- 0.15×
- Total profit
- $-167,204
- Equity at exit
- $104,223
- IRR
- -21.1%
- Equity multiple
- -0.10×
- Total profit
- $-214,694
- Equity at exit
- $60,437
Cash invested: $195,720 (down + closing). Projections, not guarantees.
Landlord ↔ Tenant lean methodology
- Overall (STATE)
- 15 Strongly Tenant-Friendly
- State New York
- 15 Strongly Tenant-Friendly · D+10
- County
- — inherits STATE
- City
- — inherits STATE
ZIP-level market 11783
- Active inventory
- 93
- Price-to-rent
- 11.3×
Monthly cashflow live
- Estimated rent
- $5,144 medium interval (Pro) →
- Mortgage (P&I)
- −$3,666
- Tax from tax record
- −$956 /mo · $11,473/yr
- Insurance
- −$291
- HOA
- −$0
- Vacancy / Maint / Mgmt
- −$1,080
- Net cashflow
- $-849
Break-even live
Sensitivity live
| Price | -10% $-453 | -5% $-651 | +0% $-849 | +5% $-1,047 | +10% $-1,245 |
|---|---|---|---|---|---|
| Rent | -10% $-1,255 | -5% $-1,052 | +0% $-849 | +5% $-646 | +10% $-442 |
| Rate | -1.0pp $-497 | -0.5pp $-671 | base $-849 | +0.5pp $-1,030 | +1.0pp $-1,214 |
UW: 25.0% down · 7.5% · 30yr · 1.5% tax · 5.0% vac · 8.0% maint · 8.0% mgmt
Financing live
Cash to close
- Down payment
- $174,750
- Closing costs
- $20,970
- Reserves months
- —
- Total cash needed
- —
Loan-product check · same deal, 3 products live
Conventional
25% down · 7.5% · 30yr
- Down + closing
- —
- Monthly P&I
- —
- Monthly cashflow
- —
- DSCR
- —
- Eligible?
- —
Personal DTI + credit; lowest rate.
DSCR
20% down · 8.5% · 30yr
- Down + closing
- —
- Monthly P&I
- —
- Monthly cashflow
- —
- DSCR
- —
- Eligible?
- —
No personal income docs; deal must DSCR.
Hard money
10% down · 12.0% · 12mo
- Down + closing
- —
- Monthly P&I
- —
- Monthly cashflow
- —
- DSCR
- —
- Eligible?
- —
Short-term bridge; refi at stabilization.
Rent comps 3 comps
| Address | Beds | Baths | Sqft | Rent | $/sqft | DOM | Units | Dist |
|---|---|---|---|---|---|---|---|---|
| 3883 Franklin Ave Seaford, NY | 4.0 | 2.0 | 1593 | $5,500 | $3.45 | 45d | 1 | 0.15mi |
| 405 Massapequa Ave Massapequa, NY | 3.0 | 1.0 | 1550 | $3,700 | $2.39 | 6d | 1 | 0.98mi |
| 398 Harrison Ave Massapequa, NY | 3.0 | 1.0 | 1098 | $3,800 | $3.46 | 45d | 1 | 1.29mi |
Listing history 1 events
-
2026-05-14$699,000 Active
ⓘ Source: listings_history table (triggers on properties + properties_extension) + one-shot
backfill from property_details.listing_events for pre-trigger history.
Tax reassessment forecast NY · Partial reset (capped growth)
- Current annual tax
- $11,473 · $956/mo
- Projected year-2 tax
- $11,643 · $970/mo
- Expected delta
- +$170/yr (+$14/mo · 1.5%)
ⓘ Screening estimate from a state-policy table — verify with the county assessor before closing.
Climate risk First Street
- Flood 1/10 Low FEMA zone X (unshaded) · 0% chance over 30 yrs
- Wildfire 1/10 Low
- Heat 6/10 Major 7 d/yr ≥94°F today · 16 d/yr by 30 yrs out
- Wind 6/10 Major 61% chance of damaging wind over 30 yrs
- Air quality 4/10 Moderate 3 unhealthy d/yr today · 5 by 30 yrs out
Nearby sold comps map
Loading sold comps map…
Walkable amenities ~0.75 mi
Loading nearby amenities…
Taxation est. · year 1
- Rental income
- $61,734
- − Mortgage interest
- −$39,155
- − Property taxes
- −$11,473
- − Insurance
- −$3,495
- − Repairs & maintenance
- −$4,939
- − Management
- −$4,939
- − Depreciation
- −$20,335
- Taxable loss
- −$22,601
- Est. tax savings @ 24.0%
- +$5,424
- After-tax cash flow
- $-4,762/yr
For passive investors: Depreciation is non-cash, so a rental often shows a tax loss while cash-flowing — sheltering income. Rental losses are passive: they offset passive income freely, and up to $25,000/yr can offset ordinary (W-2) income if you actively participate and your MAGI is under $100k (phasing out to $0 by $150k); unused losses carry forward. On sale, claimed depreciation is recaptured at up to 25%, and gains may owe capital-gains tax (a 1031 exchange can defer both). Figures are a year-1 estimate at your 24.0% rate — not tax advice; consult a CPA.
Schools (NCES district)
- District
- Seaford Union Free School District
- NCES district ID
- 3626400
- Math proficiency
- 73% ▼ -2.00%
- Reading proficiency
- 81% ▲ 11.00%
- Median HH income
- $106,919
- Composite
- 70.59/100
- National rank
- #257
- State rank
- #53 of 590 in NY
Livability — Seaford
- Score
- 80/100
- State rank
- #115
- US rank
- #1864
Category grades
Schools grade is shown separately in the Schools card above.
Census & demographics
- Census place
- Seaford, NY
- City population
- 21,588
- Population (ZIP)
- 21,588
Population outlook (Nassau County) Hauer SSP2
- Today (2025)
- 1,409,302 people
- By 2030
- 1,431,482 · +1.6%
- By 2040
- 1,471,607 · +4.4%
- By 2050
- 1,502,845 · +6.6%
- By 2075
- 1,575,403 · +11.8%
- By 2100
- 1,554,356 · +10.3%
Race, ethnicity, and origin ACS 2023
- Neighborhood character
- Predominantly White (84%)
- Race & ethnicity
- White 84% Hispanic / Latino 7% Asian 4% Two or more races 4% Black 2%
- Hispanic origin (detail)
- Puerto Rican 2% Dominican 1%
- Common ancestry
- Romanian 7% Lithuanian 2% Scotch-Irish 2%
- Foreign-born
- 8% · Canada, China, Jamaica
- Languages at home
- 88% English-only · Spanish 5% Other Indo-European 3% Chinese 1%
Political lean MEDSL · Nassau
- 2024 margin
- Toss-up / Even · D 47.9% · R 52.1%
- 2008→2024 swing
- -12.6pp toward R · 2008: 8.4pp · 2024: -4.2pp
- All cycles
- 2024: R+4.2 2020: D+9.5 2016: D+5.3 2012: D+6.7 2008: D+8.4
Not yet ingested
- Civics
- —
Market trends
- HPI YoY
- ▼ -720.04%
- Current HPI
- 298.2951
- Rent YoY
- —
- Metro
- —
- State GDP YoY
- ▲ 2.60%
- F500 in state
- 92
Industry mix (Fortune 500 HQ in NY)
| Industry | F500 HQs | Revenue |
|---|---|---|
| Financial Services | 10 | $950B |
|
||
| Consumer Goods | 9 | $162B |
|
||
| Insurance | 4 | $225B |
|
||
| Telecommunications | 2 | $144B |
|
||
| Pharmaceuticals | 2 | $112B |
|
||
| Media / Entertainment | 2 | $69B |
|
||
Price history
2 events — show timeline
- 2026-05-26 Pending — OneKey® MLS as Distributed by MLS Grid
- 2026-05-14 Listed $699,000 OneKey® MLS as Distributed by MLS Grid
Property tax history
+1.8%/yrLatest (2024): $11,473 · -1.0% YoY. Source: county tax records.
Cash-flow waterfall
monthlySold comps — $/sqft
last 12 mo · ≤1 miLoading sold comps…