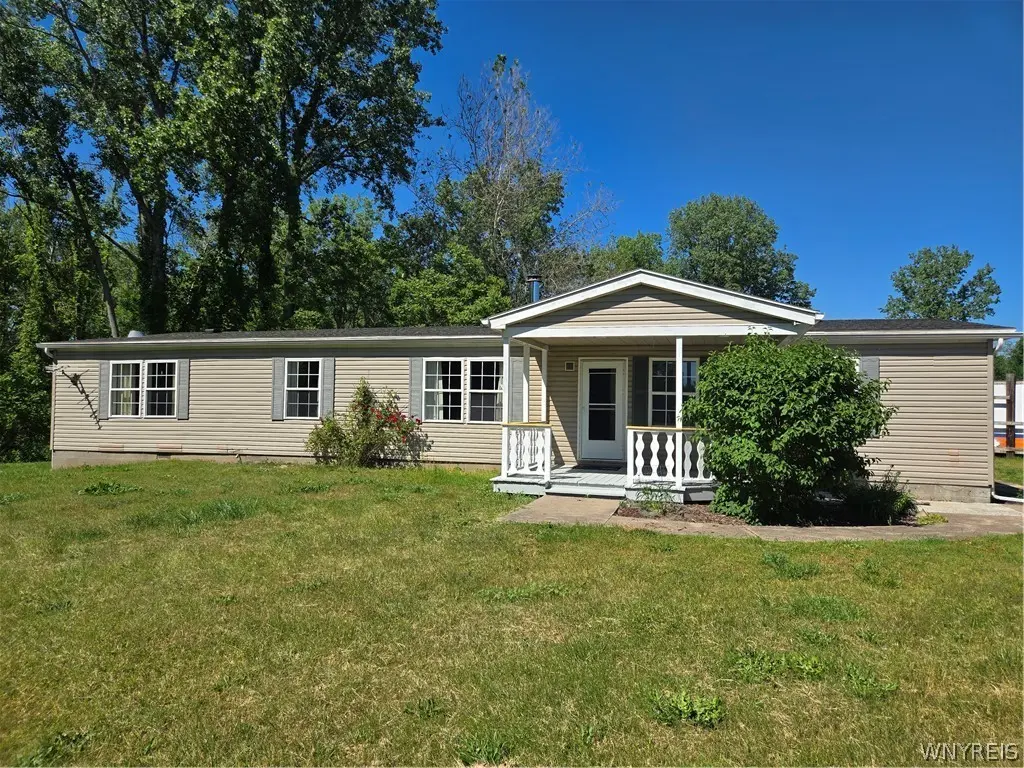
12507 Ridge Rd · Medina, NY
Flood risk 1/10 · Minimal
- FEMA flood zone
- X
- Chance of flooding over 30 yrs
- 0.0%
- Est. flood insurance / yr
- $507 – $1,088
Fire risk 3/10 · Minor
- Est. fire insurance / yr
- $691 – $1,283
Heat risk 2/10 · Minimal
- Hot days now (above 96°F)
- 7 days/yr
- Hot days in 30 yrs
- 15 days/yr
Wind risk 1/10 · Minimal
- Chance of severe wind over 30 yrs
- —
Air-quality risk 2/10 · Minimal
- Unhealthy air days now
- 1 days/yr
- Unhealthy air days in 30 yrs
- 2 days/yr
Risk factors via First Street. Map © Google.
Why this score? — see what drove the D- grade
The composite is a weighted blend of 9 inputs, each scored 0–100. Each bar is that input's sub-score; the figure is the points it added to the 100-point composite (weight × sub-score).
- ARV discount +7.5/15.0
- Cash flow +6.9/30.0
- Schools +5.0/10.0
- Appreciation +4.9/10.0
- Livability +3.6/5.0
- Rent growth +2.5/5.0
- Condition / age +2.5/5.0
- 1% rule +2.3/10.0
- DSCR +1.1/10.0
$192,900
🖨 Deal sheet (PDF) 📄 Offer letter ✓ Due diligence
Listing remarks MLS
Great Opportunity!!! Priced well below assessment and tons of potential. 3 Bedrooms, one of which has a master bath. Living Room, family room and formal dining room. There is a ton of space within the house not to mention the massive garage with workspace and multiple other small rooms. All situated on 1.4 acres. Don't miss your chance at this one! 1716 Square Footage Per FHA Appraiser
Key facts
- Sliding glass doors
- Oversized kitchen
- New deck
Tags
Property features AI
Exterior
- Parking: Detached heated garage with electricity, water, storage and workshop space; Driveway; Six garage spaces
- Utilities: Water connected (public and well listed); Septic tank; Cable available; High-speed internet available
- Home design: One-story single-family home; Existing construction
- Construction: Vinyl siding; Asphalt roof; Block foundation; Built as existing structure
- Exterior features: Covered porch; Deck; Gravel driveway; Agricultural/irregular lot; Road frontage on a main thoroughfare
Interior
- Kitchen: Kitchen with island; Microwave; Gas oven; Gas range; Refrigerator; Dishwasher; Eat-in area; Pantry
- Bedrooms: Three main-level bedrooms (sizes: 14 x 12, 14 x 11, 12 x 11)
- Flooring: Carpet; Vinyl; Varied flooring
- Bathrooms: Two full bathrooms (both on the main level)
- Heating & cooling: Gas forced-air heating
- Interior features: Skylights; Storm windows; Sliding doors; Ceiling fans; Eat-in kitchen; Separate/formal living room; Kitchen island; Pantry; Bath in primary bedroom; Main level primary; Bathroom rough-in
- Laundry & utility: Main-level laundry; Washer; Dryer; Gas water heater
Neighborhood map
What this means for you Summary
Snapshot
- This is a 2-bed/2.0-bath manufactured listed at $193k.
Deal economics
- At list price, monthly cash flow is $-292 ($-4k/yr) — negative.
- To cash-flow at today's rent, offer at most $141k (26.7% below list).
- To meet the 1% rule (rent ≥ 1% of price), the offer needs to be $140k (27.3% below list).
- Recommended offer: $140k (27.3% below list) — sets the bar for 1% rule.
Location & tenants
- Location reads 72/100 on livability (#344 in NY) — a middle-class / working-renter tenant base. Strengths: cost of living A+, housing A+, health & safety A+; Watch: crime D-, amenities F, commute F.
- Lyndonville Central School District (rural): math 52% / reading 65% proficiency, ranked #260 of 590 in NY (top 44%) — acceptable for families but not a draw, mixed tenant base, ~2y average lease.
- Zoned schools: Lyndonville Elementary School (math 47% / reading 62%, grade C, #908 of 2,108 statewide, top 46%, 358 students, 53% FRL); L A Webber Middle-High School (math 62% / reading 72%, grade B, #746 of 1,100 statewide, top 69%, 235 students, 61% FRL) — zoned schools average 57% FRL vs 34% district-wide (23 pts higher); higher-poverty schools than district average — tighter screening recommended.
- Market conditions: 58 active listings in the ZIP; 28 units permitted in Orleans County in 2024 (0 in 5+ unit buildings).
Forward outlook
- In year one you build about $825 of equity ($1k loan paydown + $-509 appreciation (-0.3% local appreciation)).
- Orleans County population projected at -20% by 2050 — secular population decline; favor cash flow + early exit over multi-decade hold.
Negotiation context
- Only 11 days on market — expect competitive offers; lowballing is unlikely to land.
- 3 sale attempts since 7y ago with the ask held roughly flat each time — persistent listings suggest the price (not the market) is what's stuck; bring a comps-based counter.
- Current owner paid $46k; list at $193k implies a 318% gain — meaningful room to come down on a strong offer.
Questions for the listing agent
- What do current leases actually rent for vs. the listed asking? Can we see a recent rent roll and the last 12 months of T-12 income?
- Is there a deadline driving the sale (1031 exchange, divorce, estate, relocation)? That informs how much negotiation room exists.
- Crime grade is D in this area — have there been break-ins, vandalism, or insurance claims at this property in the last 3 years? What carrier currently insures it and at what premium?
- The area grade is low — what's the realistic commute time and amenity access for the typical tenant pool here? Any planned neighborhood developments (good or bad) we should know about?
- What's the average days-on-market for RENTAL listings here right now (not sales)? A rising rental-DOM trend means longer vacancies and softer asking-rent achievability than the comps imply.
- What's the recent tenant-quality profile in this submarket — average credit score on applications, eviction rate, late-payment / NSF rate, and stable-employment percentage? A property-management company in the area should have these aggregated.
- How much new for-sale + rental construction is in the pipeline within 1–3 miles? Heavy new supply typically softens prices + rents 12–24 months out; constrained supply supports both.
Investment metrics
- 1% rule
- 0.73% ✗
- Cap rate
- 4.48%
- Cash-on-cash
- -6.48%
- DSCR
- 0.71
- GRM
- 11.5
CMA / ARV
No comps found within radius.
Projected returns pro-forma
-0.26% appreciation · 3.0% rent growth · sell at horizon
- IRR
- -10.8%
- Equity multiple
- 0.51×
- Total profit
- $-26,543
- Equity at exit
- $53,478
- IRR
- -4.4%
- Equity multiple
- 0.55×
- Total profit
- $-24,137
- Equity at exit
- $62,295
Cash invested: $54,012 (down + closing). Projections, not guarantees.
Landlord ↔ Tenant lean methodology
- Overall (STATE)
- 15 Strongly Tenant-Friendly
- State New York
- 15 Strongly Tenant-Friendly · D+10
- County
- — inherits STATE
- City
- — inherits STATE
ZIP-level market 14103
- Home prices YoY
- -0.1%
- Active inventory
- 58
- Price-to-rent
- 11.5×
Monthly cashflow live
- Estimated rent
- $1,403 medium interval (Pro) →
- Mortgage (P&I)
- −$1,012
- Tax from tax record
- −$308 /mo · $3,693/yr
- Insurance
- −$80
- HOA
- −$0
- Vacancy / Maint / Mgmt
- −$295
- Net cashflow
- $-292
Break-even live
Sensitivity live
| Price | -10% $-183 | -5% $-237 | +0% $-292 | +5% $-346 | +10% $-401 |
|---|---|---|---|---|---|
| Rent | -10% $-403 | -5% $-347 | +0% $-292 | +5% $-236 | +10% $-181 |
| Rate | -1.0pp $-195 | -0.5pp $-243 | base $-292 | +0.5pp $-342 | +1.0pp $-393 |
UW: 25.0% down · 7.5% · 30yr · 1.5% tax · 5.0% vac · 8.0% maint · 8.0% mgmt
Financing live
Cash to close
- Down payment
- $48,225
- Closing costs
- $5,787
- Reserves months
- —
- Total cash needed
- —
Loan-product check · same deal, 3 products live
Conventional
25% down · 7.5% · 30yr
- Down + closing
- —
- Monthly P&I
- —
- Monthly cashflow
- —
- DSCR
- —
- Eligible?
- —
Personal DTI + credit; lowest rate.
DSCR
20% down · 8.5% · 30yr
- Down + closing
- —
- Monthly P&I
- —
- Monthly cashflow
- —
- DSCR
- —
- Eligible?
- —
No personal income docs; deal must DSCR.
Hard money
10% down · 12.0% · 12mo
- Down + closing
- —
- Monthly P&I
- —
- Monthly cashflow
- —
- DSCR
- —
- Eligible?
- —
Short-term bridge; refi at stabilization.
Listing history 9 events
-
2026-06-21days on market $192,900 Active 11 DOM
-
2026-06-21days on market $192,900 Active 10 DOM
-
2026-06-18days on market $192,900 Active 8 DOM
-
2026-06-17days on market $192,900 Active 7 DOM
-
2026-06-16days on market $192,900 Active 6 DOM
-
2026-06-15days on market $192,900 Active 5 DOM
-
2026-06-13days on market $192,900 Active 3 DOM
-
2026-06-12remarks 699-char remark
-
2026-06-12$192,900 Active 2 DOM
ⓘ Source: listings_history table (triggers on properties + properties_extension) + one-shot
backfill from property_details.listing_events for pre-trigger history.
Tax reassessment forecast NY · Partial reset (capped growth)
- Current annual tax
- $3,693 · $308/mo
- Projected year-2 tax
- $3,693 · $308/mo
- Expected delta
- $0/yr ($0/mo · 0.0%)
ⓘ Screening estimate from a state-policy table — verify with the county assessor before closing.
Climate risk First Street
- Flood 1/10 Low FEMA zone X · 0% chance over 30 yrs
- Wildfire 3/10 Moderate
- Heat 2/10 Low 7 d/yr ≥96°F today · 15 d/yr by 30 yrs out
- Wind 1/10 Low
- Air quality 2/10 Low 1 unhealthy d/yr today · 2 by 30 yrs out
Nearby sold comps map
Loading sold comps map…
Walkable amenities ~0.75 mi
Loading nearby amenities…
Taxation est. · year 1
- Rental income
- $16,831
- − Mortgage interest
- −$10,805
- − Property taxes
- −$3,693
- − Insurance
- −$964
- − Repairs & maintenance
- −$1,346
- − Management
- −$1,346
- − Depreciation
- −$5,612
- Taxable loss
- −$6,937
- Est. tax savings @ 24.0%
- +$1,665
- After-tax cash flow
- $-1,836/yr
For passive investors: Depreciation is non-cash, so a rental often shows a tax loss while cash-flowing — sheltering income. Rental losses are passive: they offset passive income freely, and up to $25,000/yr can offset ordinary (W-2) income if you actively participate and your MAGI is under $100k (phasing out to $0 by $150k); unused losses carry forward. On sale, claimed depreciation is recaptured at up to 25%, and gains may owe capital-gains tax (a 1031 exchange can defer both). Figures are a year-1 estimate at your 24.0% rate — not tax advice; consult a CPA.
Schools (NCES district)
- District
- Lyndonville Central School District
- NCES district ID
- 3617970
- Math proficiency
- 52% ▲ 5.00%
- Reading proficiency
- 65% ▲ 19.00%
- Median HH income
- $52,015
- Composite
- 49.98/100
- National rank
- #1927
- State rank
- #260 of 590 in NY
Livability — Medina
- Score
- 72/100
- State rank
- #344
- US rank
- #5814
Category grades
Schools grade is shown separately in the Schools card above.
Census & demographics
- City population
- 10,836
- Population (ZIP)
- 10,836
Population outlook (Orleans County) Hauer SSP2
- Today (2025)
- 39,123 people
- By 2030
- 37,648 · -3.8%
- By 2040
- 34,432 · -12.0%
- By 2050
- 31,487 · -19.5%
- By 2075
- 26,544 · -32.2%
- By 2100
- 22,251 · -43.1%
Race, ethnicity, and origin ACS 2023
- Neighborhood character
- Predominantly White (83%)
- Race & ethnicity
- White 83% Hispanic / Latino 6% Two or more races 5% Black 4% Asian 2%
- Hispanic origin (detail)
- Mexican 4%
- Common ancestry
- Romanian 9% Slovak 2% Lithuanian 1%
- Foreign-born
- 4% · Canada, China
- Languages at home
- 89% English-only · Spanish 5% German/W. Germanic 3% Chinese 1%
Political lean MEDSL · Orleans
- 2024 margin
- Solid R (+40.5) · D 29.8% · R 70.2%
- 2008→2024 swing
- -21.8pp toward R · 2008: -18.7pp · 2024: -40.5pp
- All cycles
- 2024: R+40.5 2020: R+36.0 2016: R+43.4 2012: R+19.4 2008: R+18.7
Not yet ingested
- Civics
- —
Market trends
- HPI YoY
- ▼ -0.26%
- Current HPI
- 307.0342
- Rent YoY
- —
- Metro
- —
- State GDP YoY
- ▲ 2.60%
- F500 in state
- 92
Industry mix (Fortune 500 HQ in NY)
| Industry | F500 HQs | Revenue |
|---|---|---|
| Financial Services | 10 | $950B |
|
||
| Consumer Goods | 9 | $162B |
|
||
| Insurance | 4 | $225B |
|
||
| Telecommunications | 2 | $144B |
|
||
| Pharmaceuticals | 2 | $112B |
|
||
| Media / Entertainment | 2 | $69B |
|
||
Price history
+293.7% since first listed6 events — show timeline
- 2026-06-10 Listed $192,900 WNYREIS
- 2020-02-20 Sold (MLS) $46,100 WNYREIS
- 2020-01-03 Pending — WNYREIS
- 2020-01-02 Relisted — WNYREIS
- 2019-12-26 Pending — WNYREIS
- 2019-12-12 Listed $49,000 WNYREIS
Property tax history
+4.0%/yrLatest (2025): $3,693 · +2.9% YoY. Source: county tax records.
Cash-flow waterfall
monthlySold comps — $/sqft
last 12 mo · ≤1 miLoading sold comps…