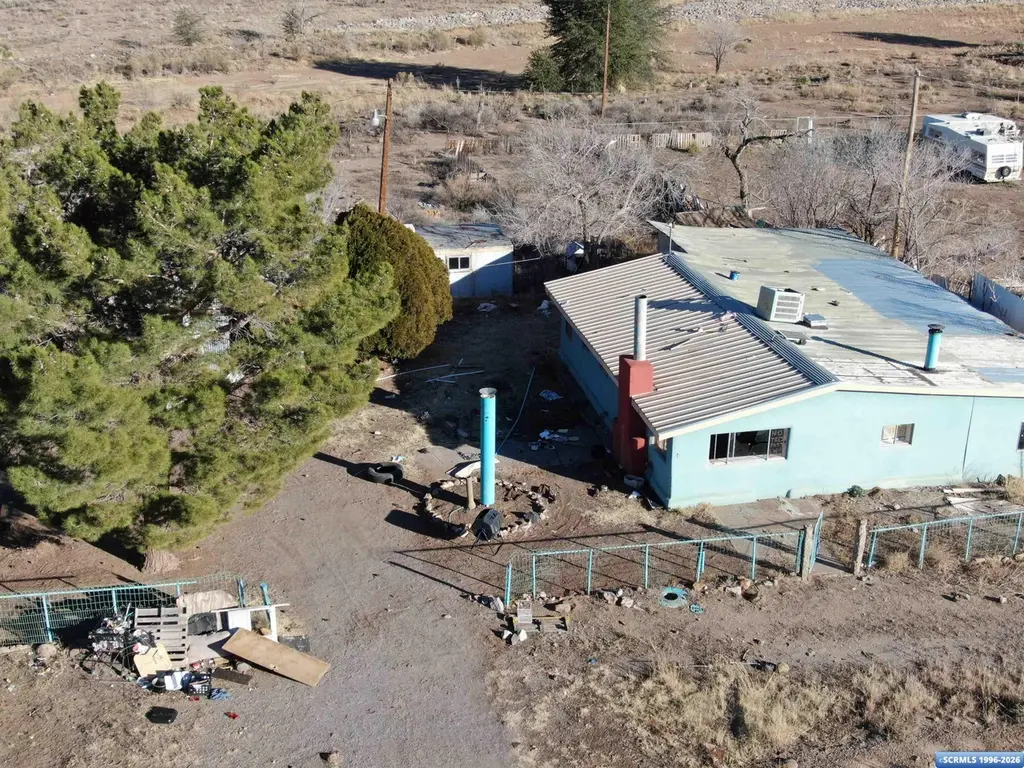
54 Horseshoe Dr · North Hurley, NM
Flood risk 1/10 · Minimal
- FEMA flood zone
- X (unshaded)
- Chance of flooding over 30 yrs
- 0.0%
- Est. flood insurance / yr
- $507 – $1,088
Fire risk 9/10 · Severe
- Est. fire insurance / yr
- $706 – $1,312
Heat risk 4/10 · Minor
- Hot days now (above 93°F)
- 7 days/yr
- Hot days in 30 yrs
- 22 days/yr
Wind risk 1/10 · Minimal
- Chance of severe wind over 30 yrs
- —
Air-quality risk 2/10 · Minimal
- Unhealthy air days now
- 1 days/yr
- Unhealthy air days in 30 yrs
- 1 days/yr
Risk factors via First Street. Map © Google.
Why this score? — see what drove the B- grade
The composite is a weighted blend of 9 inputs, each scored 0–100. Each bar is that input's sub-score; the figure is the points it added to the 100-point composite (weight × sub-score).
- Cash flow +30.0/30.0
- DSCR +10.0/10.0
- 1% rule +7.9/10.0
- ARV discount +7.5/15.0
- Appreciation +3.8/10.0
- Rent growth +2.5/5.0
- Condition / age +2.5/5.0
- Livability +2.4/5.0
- Schools +2.2/10.0
$100,000
🖨 Deal sheet (PDF) 📄 Offer letter ✓ Due diligence
Listing remarks MLS
54 Horseshoe is located in North Hurley. This home provides almost a half-acre of land with 3 bedrooms and 2 bathrooms. The right buyer can turn this house into a home. Call to set up an appointment today.
Key facts
- 0.46 acre lot
- 2 garage spots
- Built 1978
Neighborhood map
What this means for you Summary
Snapshot
- This is a 3-bed/2.0-bath single-family listed at $100k.
Deal economics
- At list price, monthly cash flow is $428 ($5k/yr) — positive.
- The deal already cash-flows at list — no discount required.
- Meets the 1% rule at list price ($1k rent vs $100k).
- Recommended offer: $91k (9.0% below list) — sets the bar for market timing.
Location & tenants
- Location reads 48/100 on livability (#304 in NM) — a working-class tenant base; expect higher turnover. Strengths: cost of living A+, crime A; Watch: schools F, amenities F, commute F.
- Cobre Consolidated Schools (town): math 13% / reading 33% proficiency, ranked #56 of 95 in NM (top 59%) — low school quality limits family demand, transient renter base, plan for 1-2y turnover; 92% free/reduced lunch — lower-income household profile, screen leases tightly.
- Market conditions: 18 active listings in the ZIP.
Forward outlook
- Local home prices are declining (-2.3%/yr); year-one equity from $691 of loan paydown is wiped out by about $2k of value loss. Plan a longer hold.
- Grant County population projected at -21% by 2050 — secular population decline; favor cash flow + early exit over multi-decade hold.
- At projected returns (-2.3% appreciation + 3.0% rent growth), your $28k cash investment doubles in ~6 years — after that, you're playing with house money.
Negotiation context
- It's been on market 99 days — a 9% lower offer ($91k) is reasonable based on typical stale-listing flexibility.
Risks & watch-outs
- Climate carrying-cost: severe wildfire risk — expect insurance premiums to compound above CPI over the hold.
Questions for the listing agent
- It's been on market 99 days. Have you received any prior offers? Is the seller open to a 9% concession, seller financing, or rate buy-down credit?
- Built in 1978 — when were the roof, HVAC, electrical panel, plumbing, and water heater last replaced?
- Why hasn't it sold? Are there any deal-killer items the seller is aware of (foundation, flood, title, zoning, code violations)?
- Is there a deadline driving the sale (1031 exchange, divorce, estate, relocation)? That informs how much negotiation room exists.
- Schools are F-rated, which usually means shorter tenancies and higher turnover. Who's the typical renter profile here, and what's been the actual vacancy rate?
- What's the average days-on-market for RENTAL listings here right now (not sales)? A rising rental-DOM trend means longer vacancies and softer asking-rent achievability than the comps imply.
- What's the recent tenant-quality profile in this submarket — average credit score on applications, eviction rate, late-payment / NSF rate, and stable-employment percentage? A property-management company in the area should have these aggregated.
- How much new for-sale + rental construction is in the pipeline within 1–3 miles? Heavy new supply typically softens prices + rents 12–24 months out; constrained supply supports both.
Investment metrics
- 1% rule
- 1.29% ✓
- Cap rate
- 11.43%
- Cash-on-cash
- 18.33%
- DSCR
- 1.82
- GRM
- 6.5
CMA / ARV
No comps found within radius.
Projected returns pro-forma
-2.31% appreciation · 3.0% rent growth · sell at horizon
- IRR
- 12.0%
- Equity multiple
- 1.50×
- Total profit
- $13,908
- Equity at exit
- $18,008
- IRR
- 19.8%
- Equity multiple
- 2.77×
- Total profit
- $49,569
- Equity at exit
- $14,063
Cash invested: $28,000 (down + closing). Projections, not guarantees.
Landlord ↔ Tenant lean methodology
- Overall (STATE)
- 55 Moderately Landlord-Leaning
- State New Mexico
- 55 Moderately Landlord-Leaning · D+3
- County
- — inherits STATE
- City
- — inherits STATE
ZIP-level market 88043
- Home prices YoY
- -1.7%
- Active inventory
- 18
- Price-to-rent
- 6.5×
Monthly cashflow live
- Estimated rent
- $1,286 medium interval (Pro) →
- Mortgage (P&I)
- −$524
- Tax from tax record
- −$22 /mo · $264/yr
- Insurance
- −$42
- HOA
- −$0
- Vacancy / Maint / Mgmt
- −$270
- Net cashflow
- $428
Break-even live
Sensitivity live
| Price | -10% $484 | -5% $456 | +0% $428 | +5% $399 | +10% $371 |
|---|---|---|---|---|---|
| Rent | -10% $326 | -5% $377 | +0% $428 | +5% $479 | +10% $529 |
| Rate | -1.0pp $478 | -0.5pp $453 | base $428 | +0.5pp $402 | +1.0pp $375 |
UW: 25.0% down · 7.5% · 30yr · 1.5% tax · 5.0% vac · 8.0% maint · 8.0% mgmt
Financing live
Cash to close
- Down payment
- $25,000
- Closing costs
- $3,000
- Reserves months
- —
- Total cash needed
- —
Loan-product check · same deal, 3 products live
Conventional
25% down · 7.5% · 30yr
- Down + closing
- —
- Monthly P&I
- —
- Monthly cashflow
- —
- DSCR
- —
- Eligible?
- —
Personal DTI + credit; lowest rate.
DSCR
20% down · 8.5% · 30yr
- Down + closing
- —
- Monthly P&I
- —
- Monthly cashflow
- —
- DSCR
- —
- Eligible?
- —
No personal income docs; deal must DSCR.
Hard money
10% down · 12.0% · 12mo
- Down + closing
- —
- Monthly P&I
- —
- Monthly cashflow
- —
- DSCR
- —
- Eligible?
- —
Short-term bridge; refi at stabilization.
Listing history 16 events
-
2026-06-21days on market $100,000 Active 99 DOM
-
2026-06-18days on market $100,000 Active 97 DOM
-
2026-06-17days on market $100,000 Active 96 DOM
-
2026-06-16days on market $100,000 Active 95 DOM
-
2026-06-15days on market $100,000 Active 94 DOM
-
2026-06-13days on market $100,000 Active 92 DOM
-
2026-06-12days on market $100,000 Active 91 DOM
-
2026-06-09days on market $100,000 Active 88 DOM
-
2026-06-08days on market $100,000 Active 87 DOM
-
2026-06-07days on market $100,000 Active 86 DOM
-
2026-06-07days on market $100,000 Active 85 DOM
-
2026-06-04days on market $100,000 Active 82 DOM
-
2026-06-02days on market $100,000 Active 81 DOM
-
2026-06-01days on market $100,000 Active 80 DOM
-
2026-05-31days on market $100,000 Active 79 DOM
-
2026-03-13$100,000 Active 205-char remark
Show marketing remark (205 chars)
54 Horseshoe is located in North Hurley. This home provides almost a half-acre of land with 3 bedrooms and 2 bathrooms. The right buyer can turn this house into a home. Call to set up an appointment today.
ⓘ Source: listings_history table (triggers on properties + properties_extension) + one-shot
backfill from property_details.listing_events for pre-trigger history.
Tax reassessment forecast NM · Resets to sale price
- Current annual tax
- $264 · $22/mo
- Projected year-2 tax
- $800 · $67/mo
- Expected delta
- +$536/yr (+$45/mo · 202.5%)
ⓘ Screening estimate from a state-policy table — verify with the county assessor before closing.
Climate risk First Street
- Flood 1/10 Low FEMA zone X (unshaded) · 0% chance over 30 yrs
- Wildfire 9/10 Extreme
- Heat 4/10 Moderate 7 d/yr ≥93°F today · 22 d/yr by 30 yrs out
- Wind 1/10 Low
- Air quality 2/10 Low 1 unhealthy d/yr today · 1 by 30 yrs out
Nearby sold comps map
Loading sold comps map…
Walkable amenities ~0.75 mi
Loading nearby amenities…
Taxation est. · year 1
- Rental income
- $15,431
- − Mortgage interest
- −$5,602
- − Property taxes
- −$264
- − Insurance
- −$500
- − Repairs & maintenance
- −$1,234
- − Management
- −$1,234
- − Depreciation
- −$2,909
- Taxable income
- $3,687
- Est. tax owed @ 24.0%
- −$885
- After-tax cash flow
- $4,248/yr
For passive investors: Depreciation is non-cash, so a rental often shows a tax loss while cash-flowing — sheltering income. Rental losses are passive: they offset passive income freely, and up to $25,000/yr can offset ordinary (W-2) income if you actively participate and your MAGI is under $100k (phasing out to $0 by $150k); unused losses carry forward. On sale, claimed depreciation is recaptured at up to 25%, and gains may owe capital-gains tax (a 1031 exchange can defer both). Figures are a year-1 estimate at your 24.0% rate — not tax advice; consult a CPA.
Schools (NCES district)
- District
- Cobre Consolidated Schools
- NCES district ID
- 3500600
- Math proficiency
- 13% —
- Reading proficiency
- 33% —
- Median HH income
- $32,044
- Composite
- 21.77/100
- National rank
- #13581
- State rank
- #56 of 95 in NM
Livability — North Hurley
- Score
- 48/100
- State rank
- #304
- US rank
- #26095
Category grades
Schools grade is shown separately in the Schools card above.
Census & demographics
- Census place
- North Hurley, NM
- Population (ZIP)
- 1,218
Population outlook (Grant County) Hauer SSP2
- Today (2025)
- 26,478 people
- By 2030
- 25,179 · -4.9%
- By 2040
- 22,711 · -14.2%
- By 2050
- 20,807 · -21.4%
- By 2075
- 16,893 · -36.2%
- By 2100
- 13,020 · -50.8%
Race, ethnicity, and origin ACS 2023
- Neighborhood character
- Predominantly Hispanic (77%)
- Race & ethnicity
- Hispanic / Latino 77% Two or more races 45% White 21%
- Hispanic origin (detail)
- Mexican 67%
- Common ancestry
- Lithuanian 1% Scotch-Irish 1%
- Foreign-born
- 3% · Canada
- Languages at home
- 47% English-only · Spanish 52% Other Indo-European 1% Other Asian/Pacific 1%
Political lean MEDSL · Grant
- 2024 margin
- Lean D (+5.1) · D 51.3% · R 46.3% · Other 2.4%
- 2008→2024 swing
- -14.8pp toward R · 2008: 19.9pp · 2024: 5.1pp
- All cycles
- 2024: D+5.1 2020: D+7.2 2016: D+7.7 2012: D+13.5 2008: D+19.9
Not yet ingested
- Civics
- —
Market trends
- HPI YoY
- ▼ -2.31%
- Current HPI
- 134.3788
- Rent YoY
- —
- Metro
- —
- State GDP YoY
- —
- F500 in state
- 0
Price history
1 event — show timeline
- 2026-03-13 Listed $100,000 SCRMLS
Property tax history
+8.9%/yrLatest (2025): $264 · +0.7% YoY. Source: county tax records.
Cash-flow waterfall
monthlySold comps — $/sqft
last 12 mo · ≤1 miLoading sold comps…