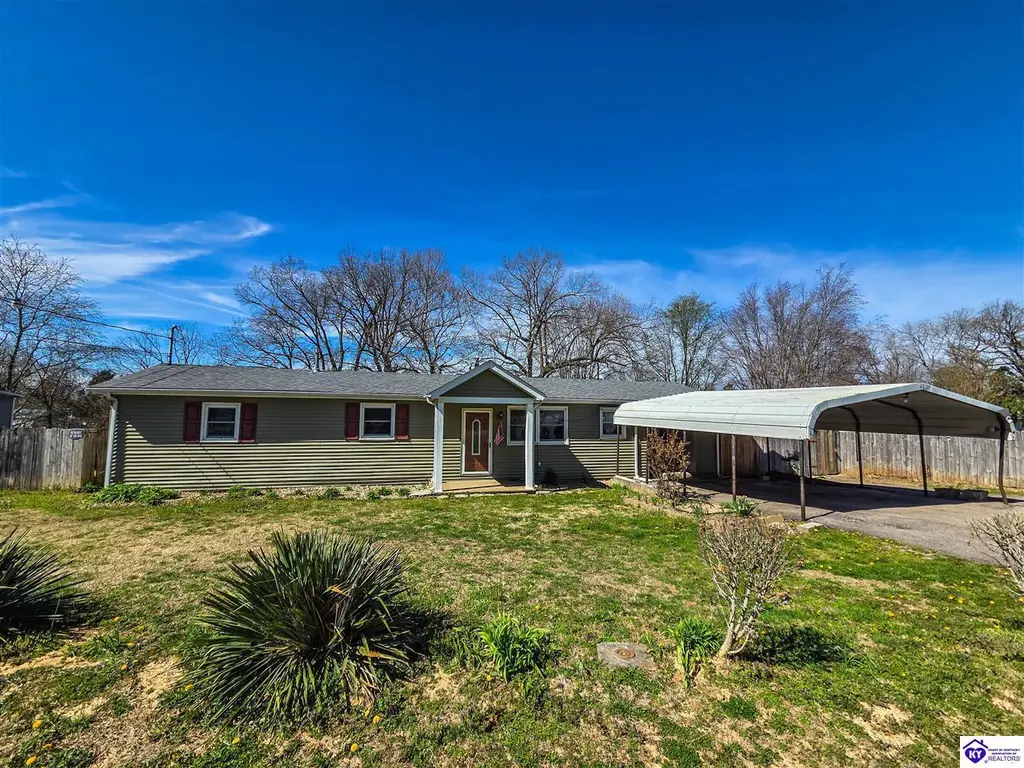
483 Smith St · Radcliff, KY
Flood risk 1/10 · Minimal
- FEMA flood zone
- X (unshaded)
- Chance of flooding over 30 yrs
- 0.0%
- Est. flood insurance / yr
- $507 – $1,088
Fire risk 3/10 · Minor
- Est. fire insurance / yr
- $839 – $1,559
Heat risk 4/10 · Minor
- Hot days now (above 104°F)
- 7 days/yr
- Hot days in 30 yrs
- 19 days/yr
Wind risk 2/10 · Minimal
- Chance of severe wind over 30 yrs
- 2.0%
Air-quality risk 2/10 · Minimal
- Unhealthy air days now
- 0 days/yr
- Unhealthy air days in 30 yrs
- 2 days/yr
Risk factors via First Street. Map © Google.
Why this score? — see what drove the B grade
The composite is a weighted blend of 9 inputs, each scored 0–100. Each bar is that input's sub-score; the figure is the points it added to the 100-point composite (weight × sub-score).
- Cash flow +27.9/30.0
- ARV discount +15.0/15.0
- DSCR +9.9/10.0
- 1% rule +6.9/10.0
- Schools +3.2/10.0
- Rent growth +3.1/5.0
- Livability +3.1/5.0
- Condition / age +2.5/5.0
- Appreciation +0.0/10.0
$115,000
🖨 Deal sheet (PDF) 📄 Offer letter ✓ Due diligence
Listing remarks MLS
Sharp home with updated roof, windows and siding. Hardwood floors throughout. Updated kitchen with breakfast bar and natural gas stove. All kitchen appliances included. Additional room could be used as an office or a possible 4th bedroom. Large covered patio area off the side entrance of kitchen, as well as covered deck off the master bedroom. Very large back yard with privacy fence and shed. Oversized 2 car carport.
Key facts
- Flexible bonus space
- Newer roof
- Covered carport
Tags
Property features AI
Exterior
- Parking: 2-car garage
- Utilities: Natural gas available; Public sewer
- Home design: Single-family residential property
- Construction: Aluminum siding; Vinyl siding; Shingle roof
- Exterior features: Deck
Interior
- Kitchen: Electric water heater
- Flooring: Hardwood; Laminate
- Bathrooms: 2 full bathrooms (both on the main level)
- Heating & cooling: Central heating (natural gas); Central air conditioning
- Interior features: Eat-in kitchen
- Laundry & utility: Dedicated laundry room
Neighborhood map
What this means for you Summary
Snapshot
- This is a 3-bed/2.0-bath single-family listed at $115k.
Deal economics
- At list price, monthly cash flow is $353 ($4k/yr) — positive.
- The deal already cash-flows at list — no discount required.
- Meets the 1% rule at list price ($1k rent vs $115k).
- Recommended offer: $112k (3.0% below list) — sets the bar for market timing.
- Cap rate 10.0% vs local median 3.5% in Radcliff — top-decile yield for the area; either an underpriced asset or a hidden risk that comps aren't pricing in. Stress-test before assuming the spread holds.
Location & tenants
- Location reads 61/100 on livability (#367 in KY) — a middle-class / working-renter tenant base. Strengths: cost of living A+, housing A+, crime B; Watch: amenities F, commute F, employment F.
- Hardin County (suburban): math 30% / reading 43% proficiency, ranked #47 of 165 in KY (top 28%) — families likely to look elsewhere, expect single-tenant / working-renter base with shorter leases.
- Zoned schools: North Park Elementary School (609 students, 67% FRL); North Middle School (math 20% / reading 36%, grade F, #165 of 217 statewide, top 77%, 578 students, 65% FRL); North Hardin High School (math 26% / reading 33%, grade F, #127 of 254 statewide, top 58%, 1,651 students, 50% FRL) — zoned schools average 61% FRL vs 44% district-wide (17 pts higher); higher-poverty schools than district average — tighter screening recommended.
- Market conditions: Rents rising (+2.2%/yr); 176 active listings in the ZIP; 946 units permitted in Hardin County in 2024 (464 in 5+ unit buildings).
Forward outlook
- Local home prices are declining (-3.0%/yr); year-one equity from $795 of loan paydown is wiped out by about $3k of value loss. Plan a longer hold.
- Hardin County population projected at -16% by 2050 — secular population decline; favor cash flow + early exit over multi-decade hold.
- At projected returns (-3.0% appreciation + 2.2% rent growth), your $32k cash investment doubles in ~10 years — after that, you're playing with house money.
Negotiation context
- It's been on market 33 days — a 3% lower offer ($112k) is reasonable based on typical stale-listing flexibility.
- 7 sale attempts since 11y ago with the ask held roughly flat each time — persistent listings suggest the price (not the market) is what's stuck; bring a comps-based counter.
- Current owner paid $68k; list at $115k implies a 68% gain — meaningful room to come down on a strong offer.
Questions for the listing agent
- It's been on market 33 days. Have you received any prior offers? Is the seller open to a 3% concession, seller financing, or rate buy-down credit?
- Built in 1960 — when were the roof, HVAC, electrical panel, plumbing, and water heater last replaced?
- Is there a deadline driving the sale (1031 exchange, divorce, estate, relocation)? That informs how much negotiation room exists.
- Schools are D-rated, which usually means shorter tenancies and higher turnover. Who's the typical renter profile here, and what's been the actual vacancy rate?
- What's the average days-on-market for RENTAL listings here right now (not sales)? A rising rental-DOM trend means longer vacancies and softer asking-rent achievability than the comps imply.
- What's the recent tenant-quality profile in this submarket — average credit score on applications, eviction rate, late-payment / NSF rate, and stable-employment percentage? A property-management company in the area should have these aggregated.
- How much new for-sale + rental construction is in the pipeline within 1–3 miles? Heavy new supply typically softens prices + rents 12–24 months out; constrained supply supports both.
Investment metrics
- 1% rule
- 1.19% ✓
- Cap rate
- 9.97%
- Cash-on-cash
- 13.15%
- DSCR
- 1.59
- GRM
- 7.0
CMA / ARV
- ARV (on-the-fly)
- $192,764
- Comps found
- 7
Show comp detail 7 sales within ~0.75 mi
| Address | Dist | Beds/Ba | Sqft | Sold | Price | $/sf | Match |
|---|---|---|---|---|---|---|---|
| 1348 Jones St | 0.36mi | 3/2.0 | 1,331 (-1%) | 1mo | $192,000 | $144 | 80 |
| 756 Chandler Ave | 0.32mi | 3/2.0 | 1,160 (-14%) | 5mo | $166,000 | $143 | 58 |
| 490 Blackjack Rd | 0.39mi | 3/2.0 | 1,512 (+12%) | 6mo | $178,000 | $118 | 56 |
| 170 Horseshoe Ct | 0.53mi | 3/1.0 | 1,221 (-9%) | 2mo | $60,000 | $49 | 54 |
| 1137 Thomas St | 0.62mi | 3/2.0 | 1,462 (+8%) | 17mo | $285,000 | $195 | 43 |
| 109 Hilltop Dr | 0.51mi | 3/2.0 | 1,512 (+12%) | 24mo | $145,000 | $96 | 36 |
| 101 Ruby Ct | 0.73mi | 3/2.5 | 1,522 (+13%) | 21mo | $265,000 | $174 | 24 |
Match score weights: distance 35% · size 25% · config 20% · recency 20%. Top-matched comps best support the ARV.
Projected returns pro-forma
-3.0% appreciation · 2.2% rent growth · sell at horizon
- IRR
- 2.2%
- Equity multiple
- 1.08×
- Total profit
- $2,725
- Equity at exit
- $17,147
- IRR
- 11.0%
- Equity multiple
- 1.83×
- Total profit
- $26,814
- Equity at exit
- $9,943
Cash invested: $32,200 (down + closing). Projections, not guarantees.
Landlord ↔ Tenant lean methodology
- Overall (STATE)
- 83 Strongly Landlord-Friendly
- State Kentucky
- 83 Strongly Landlord-Friendly · R+16
- County
- — inherits STATE
- City
- — inherits STATE
ZIP-level market 40160
- Home prices YoY
- -14.1%
- Rents YoY
- 2.2%
- Active inventory
- 176
- Price-to-rent
- 7.0×
Monthly cashflow live
- Estimated rent
- $1,369 medium interval (Pro) →
- Mortgage (P&I)
- −$603
- Tax from tax record
- −$78 /mo · $936/yr
- Insurance
- −$48
- HOA
- −$0
- Vacancy / Maint / Mgmt
- −$288
- Net cashflow
- $353
Break-even live
Sensitivity live
| Price | -10% $418 | -5% $385 | +0% $353 | +5% $320 | +10% $288 |
|---|---|---|---|---|---|
| Rent | -10% $245 | -5% $299 | +0% $353 | +5% $407 | +10% $461 |
| Rate | -1.0pp $411 | -0.5pp $382 | base $353 | +0.5pp $323 | +1.0pp $293 |
UW: 25.0% down · 7.5% · 30yr · 1.5% tax · 5.0% vac · 8.0% maint · 8.0% mgmt
Financing live
Cash to close
- Down payment
- $28,750
- Closing costs
- $3,450
- Reserves months
- —
- Total cash needed
- —
Loan-product check · same deal, 3 products live
Conventional
25% down · 7.5% · 30yr
- Down + closing
- —
- Monthly P&I
- —
- Monthly cashflow
- —
- DSCR
- —
- Eligible?
- —
Personal DTI + credit; lowest rate.
DSCR
20% down · 8.5% · 30yr
- Down + closing
- —
- Monthly P&I
- —
- Monthly cashflow
- —
- DSCR
- —
- Eligible?
- —
No personal income docs; deal must DSCR.
Hard money
10% down · 12.0% · 12mo
- Down + closing
- —
- Monthly P&I
- —
- Monthly cashflow
- —
- DSCR
- —
- Eligible?
- —
Short-term bridge; refi at stabilization.
Listing history 17 events
-
2026-05-20status Active
-
2026-04-20status Pending
-
2026-04-16price $115,000
-
2026-03-24$120,000 Active
-
2025-12-12status Active
-
2025-11-16historical Active Under Contract
-
2025-10-28price $125,000
-
2025-10-14$149,000 Active
-
2016-02-24soldstatus $68,500 423-char remark
Show marketing remark (423 chars)
Sharp home with updated roof, windows and siding. Hardwood floors throughout. Updated kitchen with breakfast bar and natural gas stove. All kitchen appliances included. Additional room could be used as an office or a possible 4th bedroom. Large covered patio area off the side entrance of kitchen, as well as covered deck off the master bedroom. Very large back yard with privacy fence and shed. Oversized 2 car carport.
-
2016-02-24soldstatus $68,500
Show marketing remark (423 chars)
Sharp home with updated roof, windows and siding. Hardwood floors throughout. Updated kitchen with breakfast bar and natural gas stove. All kitchen appliances included. Additional room could be used as an office or a possible 4th bedroom. Large covered patio area off the side entrance of kitchen, as well as covered deck off the master bedroom. Very large back yard with privacy fence and shed. Oversized 2 car carport.
-
2015-12-12$70,000 423-char remark
Show marketing remark (423 chars)
Sharp home with updated roof, windows and siding. Hardwood floors throughout. Updated kitchen with breakfast bar and natural gas stove. All kitchen appliances included. Additional room could be used as an office or a possible 4th bedroom. Large covered patio area off the side entrance of kitchen, as well as covered deck off the master bedroom. Very large back yard with privacy fence and shed. Oversized 2 car carport.
-
2015-11-09$70,000
-
2015-11-06historical
-
2015-05-07$77,500
-
2006-07-12soldstatus $72,000
ⓘ Source: listings_history table (triggers on properties + properties_extension) + one-shot
backfill from property_details.listing_events for pre-trigger history.
Tax reassessment forecast KY · Resets to sale price
- Current annual tax
- $936 · $78/mo
- Projected year-2 tax
- $989 · $82/mo
- Expected delta
- +$53/yr (+$4/mo · 5.6%)
ⓘ Screening estimate from a state-policy table — verify with the county assessor before closing.
Climate risk First Street
- Flood 1/10 Low FEMA zone X (unshaded) · 0% chance over 30 yrs
- Wildfire 3/10 Moderate
- Heat 4/10 Moderate 7 d/yr ≥104°F today · 19 d/yr by 30 yrs out
- Wind 2/10 Low 2% chance of damaging wind over 30 yrs
- Air quality 2/10 Low 0 unhealthy d/yr today · 2 by 30 yrs out
Nearby sold comps map
Loading sold comps map…
Walkable amenities ~0.75 mi
Loading nearby amenities…
Taxation est. · year 1
- Rental income
- $16,433
- − Mortgage interest
- −$6,442
- − Property taxes
- −$936
- − Insurance
- −$575
- − Repairs & maintenance
- −$1,315
- − Management
- −$1,315
- − Depreciation
- −$3,345
- Taxable income
- $2,505
- Est. tax owed @ 24.0%
- −$601
- After-tax cash flow
- $3,633/yr
For passive investors: Depreciation is non-cash, so a rental often shows a tax loss while cash-flowing — sheltering income. Rental losses are passive: they offset passive income freely, and up to $25,000/yr can offset ordinary (W-2) income if you actively participate and your MAGI is under $100k (phasing out to $0 by $150k); unused losses carry forward. On sale, claimed depreciation is recaptured at up to 25%, and gains may owe capital-gains tax (a 1031 exchange can defer both). Figures are a year-1 estimate at your 24.0% rate — not tax advice; consult a CPA.
Schools (NCES district)
- District
- Hardin County
- NCES district ID
- 2102490
- Math proficiency
- 30% ▼ -13.00%
- Reading proficiency
- 43% ▼ -10.00%
- Median HH income
- $50,728
- Composite
- 31.61/100
- National rank
- #5945
- State rank
- #47 of 165 in KY
Livability — Radcliff
- Score
- 61/100
- State rank
- #367
- US rank
- #17445
Category grades
Schools grade is shown separately in the Schools card above.
Census & demographics
- Census place
- Radcliff, KY
- County
- Hardin County · 77,611 people
- City population
- 23,624
- Metro
- Elizabethtown-Fort Knox, KY
- Population (ZIP)
- 23,624
- Household income
- $58,506
- Rent vs Own
- Severe rent burden
- 638.0
Population outlook (Hardin County) Hauer SSP2
- Today (2025)
- 105,573 people
- By 2030
- 103,563 · -1.9%
- By 2040
- 97,077 · -8.0%
- By 2050
- 88,367 · -16.3%
- By 2075
- 65,405 · -38.0%
- By 2100
- 42,245 · -60.0%
Race, ethnicity, and origin ACS 2023
- Neighborhood character
- Diverse neighborhood (Simpson 0.57)
- Race & ethnicity
- White 61% Black 21% Hispanic / Latino 9% Two or more races 7% Asian 3%
- Hispanic origin (detail)
- Mexican 2% Puerto Rican 3%
- Common ancestry
- Slovak 2% Italian 2% Lithuanian 2%
- Foreign-born
- 5% · Canada, South Korea
- Languages at home
- 93% English-only · Spanish 4% German/W. Germanic 1% Korean 1%
Political lean MEDSL · Hardin
- 2024 margin
- Strong R (+29.3) · D 34.5% · R 63.8% · Other 1.7%
- 2008→2024 swing
- -8.7pp toward R · 2008: -20.6pp · 2024: -29.3pp
- All cycles
- 2024: R+29.3 2020: R+24.0 2016: R+30.2 2012: R+20.8 2008: R+20.6
Not yet ingested
- Civics
- —
Market trends
- HPI YoY
- ▼ -44.02%
- Current HPI
- 268.1177
- Rent YoY
- ▲ 2.20%
- Metro
- Elizabethtown-Fort Knox, KY
- State GDP YoY
- ▲ 1.81%
- F500 in state
- 4
Industry mix (Fortune 500 HQ in KY)
| Industry | F500 HQs | Revenue |
|---|---|---|
| Healthcare | 1 | $118B |
|
||
| Food / Beverage | 1 | $7B |
|
||
Price history
+59.7% since first listed17 events — show timeline
- 2026-05-20 Relisted — HKARMLS
- 2026-04-20 Pending — HKARMLS
- 2026-04-16 Price Changed $115,000 HKARMLS
- 2026-03-24 Listed $120,000 HKARMLS
- 2025-12-12 Relisted — RASKMLS
- 2025-11-16 Contingent — RASKMLS
- 2025-10-28 Price Changed $125,000 RASKMLS
- 2025-10-14 Listed $149,000 RASKMLS
- 2016-02-24 Sold (Public Records) $68,500 Public Records
- 2016-02-24 Sold (Public Records) $68,500 Public Records
- 2016-02-24 Sold (MLS) $68,500 HKARMLS
- 2016-02-24 Sold (MLS) $68,500 Metro Search MLS
- 2015-12-12 Listed $70,000 Metro Search MLS
- 2015-11-09 Listed $70,000 HKARMLS
- 2015-11-06 Listing Removed — Metro Search MLS
- 2015-05-07 Listed $77,500 Metro Search MLS
- 2006-07-12 Sold (Public Records) $72,000 Public Records
Property tax history
+3.7%/yrLatest (2025): $936 · +1.0% YoY. Source: county tax records.
Cash-flow waterfall
monthlySold comps — $/sqft
last 12 mo · ≤1 miLoading sold comps…