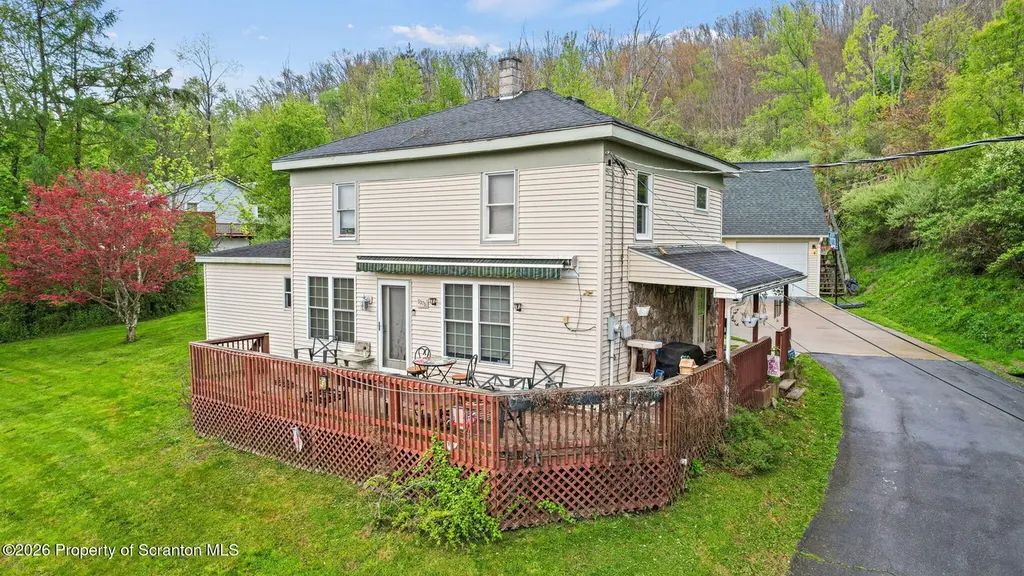
5375 High St · Oakland, PA
Flood risk 1/10 · Minimal
- FEMA flood zone
- X (unshaded)
- Chance of flooding over 30 yrs
- 0.0%
- Est. flood insurance / yr
- $473 – $860
Fire risk 1/10 · Minimal
- Est. fire insurance / yr
- $511 – $949
Heat risk 2/10 · Minimal
- Hot days now (above 92°F)
- 7 days/yr
- Hot days in 30 yrs
- 16 days/yr
Wind risk 2/10 · Minimal
- Chance of severe wind over 30 yrs
- 2.0%
Air-quality risk 2/10 · Minimal
- Unhealthy air days now
- 0 days/yr
- Unhealthy air days in 30 yrs
- 1 days/yr
Risk factors via First Street. Map © Google.
Why this score? — see what drove the D grade
The composite is a weighted blend of 9 inputs, each scored 0–100. Each bar is that input's sub-score; the figure is the points it added to the 100-point composite (weight × sub-score).
- Cash flow +14.2/30.0
- Appreciation +7.5/10.0
- 1% rule +4.8/10.0
- DSCR +4.3/10.0
- Schools +3.3/10.0
- Rent growth +2.5/5.0
- Livability +2.5/5.0
- Condition / age +2.5/5.0
- ARV discount +0.0/15.0
$140,000
🖨 Deal sheet 📄 Offer letter ✓ Due diligence
Listing remarks
Great potential in this spacious two-story home! Features include a convenient first-floor primary bedroom, three additional bedrooms upstairs, and two full baths. With some updating and personal touches, this home could shine. Situated on a generous lot with a paved driveway, large porch, and an oversized heated 3-car garage complete with full upper-level space ideal for storage or future expansion possibilities. Sold As-Is.
Key facts
- Paved driveway
- Large porch
- 0.69 acre lot
Tags
Property features AI
Finance
- Other: Living area approximately 1,552 (above grade finished area 1,552); Lot size about 0.69 acre; Land value reported
Exterior
- Parking: Detached garage; 3 garage spaces; Paved driveway; Driveway parking; 6 additional open parking spaces
- Utilities: Public water; Public sewer; Electricity connected with circuit breakers; Water connected; Sewer connected
- Home design: Single family residence; Two levels; Built in 1950; Vinyl siding; Stone foundation; Shingle roof; City street frontage on asphalt road
- Construction: Vinyl siding construction; Stone foundation; Shingle roof; Year built 1950
- Exterior features: Private yard with front and back yard; Awning(s); Patio; Covered front porch; Exterior storage
Interior
- Kitchen: Dishwasher; Refrigerator; Microwave; Free-standing gas range
- Bedrooms: 4 bedrooms total; Primary bedroom (approximately 14.67 x 12.75); Bedroom 2 (approximately 10 x 11.9); Bedroom 3 (approximately 11.67 x 13.33)
- Flooring: Carpet; Linoleum; Laminate; Hardwood
- Bathrooms: 2 full bathrooms; Primary bathroom (approximately 14.75 x 6.08)
- Heating & cooling: Forced air heating (propane); Ceiling fans for cooling
- Interior features: Eat-in kitchen; Walk-in closets; High-speed internet; Crawl space attic access; Unfinished partial basement with dirt floor
- Laundry & utility: Main level laundry
Neighborhood map
What this means for you Summary
Snapshot
- This is a 4-bed/2.0-bath single-family listed at $140k.
Deal economics
- At list price, monthly cash flow is $22 ($262/yr) — positive.
- The deal already cash-flows at list — no discount required.
- To meet the 1% rule (rent ≥ 1% of price), the offer needs to be $137k (1.8% below list).
- Recommended offer: $137k (1.8% below list) — sets the bar for 1% rule.
Location & tenants
- Location reads: area grade D — affects rentability + tenant quality, not the cash-flow math above.
- Susquehanna Community SD (rural): math 30% / reading 50% proficiency, ranked #364 of 539 in PA (top 68%) — families likely to look elsewhere, expect single-tenant / working-renter base with shorter leases.
- Market conditions: 45 active listings in the ZIP; 80 units permitted in Susquehanna County in 2024 (5 in 5+ unit buildings).
Forward outlook
- In year one you build about $8k of equity ($968 loan paydown + $7k appreciation (5.0% local appreciation)).
- Susquehanna County population projected at -30% by 2050 — secular population decline; favor cash flow + early exit over multi-decade hold.
- At projected returns (5.0% appreciation + 3.0% rent growth), your $39k cash investment doubles in ~5 years — after that, you're playing with house money.
- By year 5, paydown + projected appreciation supports a ~$35k cash-out refi (75% LTV) — recoverable capital for the next deal without selling this one.
Negotiation context
- Only 8 days on market — expect competitive offers; lowballing is unlikely to land.
- Current owner paid $120k; 17% above their basis — modest negotiation headroom, anchor on the comps not their cost.
Risks & watch-outs
- Watch-outs: built in 1950 — expect roof / HVAC / electrical / plumbing capex.
Questions for the listing agent
- Built in 1950 — when were the roof, HVAC, electrical panel, plumbing, and water heater last replaced?
- Is there a deadline driving the sale (1031 exchange, divorce, estate, relocation)? That informs how much negotiation room exists.
- The area grade is low — what's the realistic commute time and amenity access for the typical tenant pool here? Any planned neighborhood developments (good or bad) we should know about?
- What's the average days-on-market for RENTAL listings here right now (not sales)? A rising rental-DOM trend means longer vacancies and softer asking-rent achievability than the comps imply.
- What's the recent tenant-quality profile in this submarket — average credit score on applications, eviction rate, late-payment / NSF rate, and stable-employment percentage? A property-management company in the area should have these aggregated.
- How much new for-sale + rental construction is in the pipeline within 1–3 miles? Heavy new supply typically softens prices + rents 12–24 months out; constrained supply supports both.
Investment metrics
- 1% rule
- 0.98% ✗
- Cap rate
- 6.48%
- Cash-on-cash
- 0.67%
- DSCR
- 1.03
- GRM
- 8.5
CMA / ARV
- ARV (median comp)
- $95,345
- List price
- $140,000
- Delta
- 46.83%
- Verdict
- OVERPRICED
- Comps
- 20 within 1.0 mi
Show comp detail 6 sales within ~0.75 mi
| Address | Dist | Beds/Ba | Sqft | Sold | Price | $/sf | Match |
|---|---|---|---|---|---|---|---|
| 151 Third Ave | 0.41mi | 4/2.0 | 1,720 (+11%) | 9mo | $141,500 | $82 | 55 |
| 5333 Prospect St | 0.44mi | 3/1.0 (-1) | 1,584 (+2%) | 19mo | $62,000 | $39 | 52 |
| 5146 Prospect St | 0.26mi | 3/1.0 (-1) | 1,450 (-7%) | 21mo | $140,000 | $97 | 51 |
| 396 Prospect St | 0.53mi | 4/1.0 | 1,454 (-6%) | 19mo | $150,000 | $103 | 45 |
| 235 Washington Street St | 0.47mi | 3/1.5 (-1) | 1,612 (+4%) | 23mo | $150,000 | $93 | 45 |
| 57 Center Ln | 0.54mi | 3/2.0 (-1) | 1,400 (-10%) | 14mo | $253,500 | $181 | 42 |
Match score weights: distance 35% · size 25% · config 20% · recency 20%. Top-matched comps best support the ARV.
Projected returns pro-forma
5.01% appreciation · 3.0% rent growth · sell at horizon
- IRR
- 13.5%
- Equity multiple
- 1.86×
- Total profit
- $33,792
- Equity at exit
- $79,393
- IRR
- 14.3%
- Equity multiple
- 3.58×
- Total profit
- $101,107
- Equity at exit
- $137,069
Cash invested: $39,200 (down + closing). Projections, not guarantees.
Landlord ↔ Tenant lean methodology
- Overall (STATE)
- 62 Landlord-Friendly
- State Pennsylvania
- 62 Landlord-Friendly · EVEN
- County
- — inherits STATE
- City
- — inherits STATE
ZIP-level market 18847
- Home prices YoY
- 4.2%
- Active inventory
- 45
- Price-to-rent
- 8.5×
Monthly cashflow live
- Estimated rent
- $1,374 medium interval (Pro) →
- Mortgage (P&I)
- −$734
- Tax from tax record
- −$271 /mo · $3,258/yr
- Insurance
- −$58
- HOA
- −$0
- Vacancy / Maint / Mgmt
- −$289
- Net cashflow
- $22
Break-even live
UW: 25.0% down · 7.5% · 30yr · 1.5% tax · 5.0% vac · 8.0% maint · 8.0% mgmt
Financing live
Cash to close
- Down payment
- $35,000
- Closing costs
- $4,200
- Reserves months
- —
- Total cash needed
- —
Loan-product check · same deal, 3 products live
Conventional
25% down · 7.5% · 30yr
- Down + closing
- —
- Monthly P&I
- —
- Monthly cashflow
- —
- DSCR
- —
- Eligible?
- —
Personal DTI + credit; lowest rate.
DSCR
20% down · 8.5% · 30yr
- Down + closing
- —
- Monthly P&I
- —
- Monthly cashflow
- —
- DSCR
- —
- Eligible?
- —
No personal income docs; deal must DSCR.
Hard money
10% down · 12.0% · 12mo
- Down + closing
- —
- Monthly P&I
- —
- Monthly cashflow
- —
- DSCR
- —
- Eligible?
- —
Short-term bridge; refi at stabilization.
Listing history 2 events
-
2026-05-13$140,000 Active 429-char remark
-
2019-08-12soldstatus $120,000
ⓘ Source: listings_history table (triggers on properties + properties_extension) + one-shot
backfill from property_details.listing_events for pre-trigger history.
Tax reassessment forecast PA · Partial reset (capped growth)
- Current annual tax
- $3,258 · $271/mo
- Projected year-2 tax
- $3,258 · $271/mo
- Expected delta
- $0/yr ($0/mo · 0.0%)
ⓘ Screening estimate from a state-policy table — verify with the county assessor before closing.
Climate risk First Street
- Flood 1/10 Low FEMA zone X (unshaded) · 0% chance over 30 yrs
- Wildfire 1/10 Low
- Heat 2/10 Low 7 d/yr ≥92°F today · 16 d/yr by 30 yrs out
- Wind 2/10 Low 2% chance of damaging wind over 30 yrs
- Air quality 2/10 Low 0 unhealthy d/yr today · 1 by 30 yrs out
Nearby sold comps map
Loading sold comps map…
Walkable amenities ~0.75 mi
Loading nearby amenities…
Taxation est. · year 1
- Rental income
- $16,494
- − Mortgage interest
- −$7,842
- − Property taxes
- −$3,258
- − Insurance
- −$700
- − Repairs & maintenance
- −$1,319
- − Management
- −$1,319
- − Depreciation
- −$4,073
- Taxable loss
- −$2,018
- Est. tax savings @ 24.0%
- +$484
- After-tax cash flow
- $746/yr
For passive investors: Depreciation is non-cash, so a rental often shows a tax loss while cash-flowing — sheltering income. Rental losses are passive: they offset passive income freely, and up to $25,000/yr can offset ordinary (W-2) income if you actively participate and your MAGI is under $100k (phasing out to $0 by $150k); unused losses carry forward. On sale, claimed depreciation is recaptured at up to 25%, and gains may owe capital-gains tax (a 1031 exchange can defer both). Figures are a year-1 estimate at your 24.0% rate — not tax advice; consult a CPA.
Schools (NCES district)
- District
- Susquehanna Community SD
- NCES district ID
- 4222980
- Math proficiency
- 30% ▼ -17.00%
- Reading proficiency
- 50% ▼ -10.00%
- Median HH income
- $39,980
- Composite
- 33.46/100
- National rank
- #5458
- State rank
- #364 of 539 in PA
Livability — Oakland
No livability data for this city. (Only ~50 U.S. cities are tracked.)
Census & demographics
- Census place
- Oakland, PA
- Population (ZIP)
- 5,082
Population outlook (Susquehanna County) Hauer SSP2
- Today (2025)
- 37,552 people
- By 2030
- 35,270 · -6.1%
- By 2040
- 30,663 · -18.3%
- By 2050
- 26,492 · -29.5%
- By 2075
- 19,658 · -47.7%
- By 2100
- 15,179 · -59.6%
Race, ethnicity, and origin ACS 2023
- Neighborhood character
- Predominantly White (97%)
- Race & ethnicity
- White 97% Two or more races 2% Hispanic / Latino 1%
- Common ancestry
- Romanian 5% Lithuanian 2% Iranian 2%
- Foreign-born
- 1%
- Languages at home
- 97% English-only · German/W. Germanic 1%
Political lean MEDSL · Susquehanna
- 2024 margin
- Solid R (+44.7) · D 27.2% · R 71.9%
- 2008→2024 swing
- -33.0pp toward R · 2008: -11.7pp · 2024: -44.7pp
- All cycles
- 2024: R+44.7 2020: R+41.2 2016: R+42.9 2012: R+21.4 2008: R+11.7
Not yet ingested
- Civics
- —
Market trends
- HPI YoY
- ▲ 5.01%
- Current HPI
- 124.2656
- Rent YoY
- —
- Metro
- —
- State GDP YoY
- ▲ 1.68%
- F500 in state
- 34
Industry mix (Fortune 500 HQ in PA)
| Industry | F500 HQs | Revenue |
|---|---|---|
| Healthcare | 2 | $309B |
|
||
| Insurance | 2 | $27B |
|
||
| Telecommunications / Media | 1 | $124B |
|
||
| Industrial Distribution | 1 | $22B |
|
||
| Financial Services | 1 | $20B |
|
||
| Chemicals / Materials | 1 | $18B |
|
||
Price history
+16.7% since first listed3 events — show timeline
- 2026-05-22 Pending — GSBR as distributed by MLS GRID
- 2026-05-13 Listed $140,000 GSBR as distributed by MLS GRID
- 2019-08-12 Sold (Public Records) $120,000 Public Records
Property tax history
+1.9%/yrLatest (2026): $3,258 · +2.1% YoY. Source: county tax records.
Cash-flow waterfall
monthlySold comps — $/sqft
last 12 mo · ≤1 miLoading sold comps…