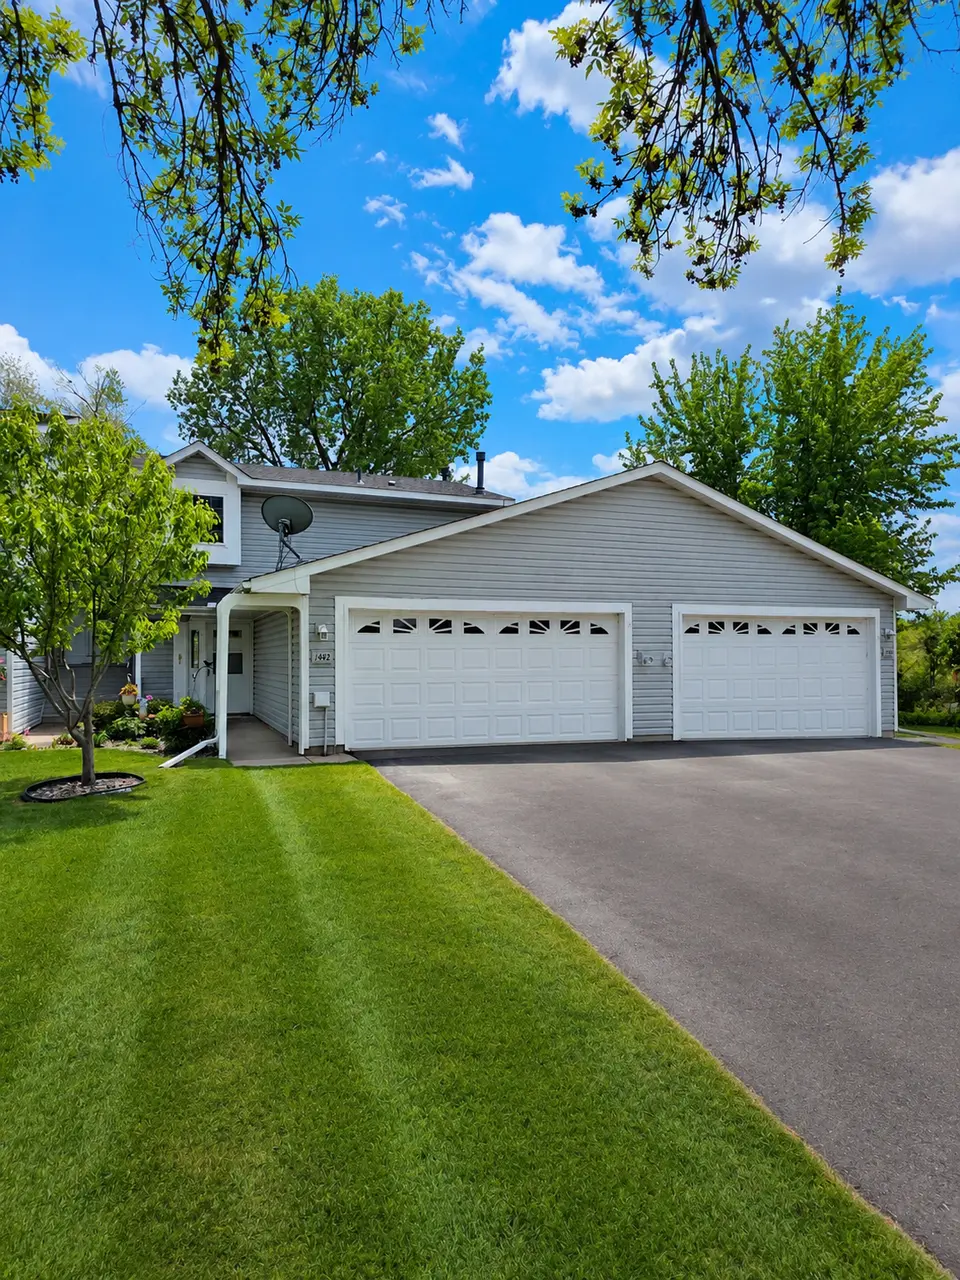
1442 Cleveland St · Anoka, MN
Flood risk 1/10 · Minimal
- FEMA flood zone
- X (unshaded)
- Chance of flooding over 30 yrs
- 0.0%
- Est. flood insurance / yr
- $507 – $1,088
Fire risk 1/10 · Minimal
- Est. fire insurance / yr
- $888 – $1,650
Heat risk 2/10 · Minimal
- Hot days now (above 99°F)
- 7 days/yr
- Hot days in 30 yrs
- 14 days/yr
Wind risk 2/10 · Minimal
- Chance of severe wind over 30 yrs
- —
Air-quality risk 2/10 · Minimal
- Unhealthy air days now
- 2 days/yr
- Unhealthy air days in 30 yrs
- 2 days/yr
Risk factors via First Street. Map © Google.
Why this score? — see what drove the D grade
The composite is a weighted blend of 9 inputs, each scored 0–100. Each bar is that input's sub-score; the figure is the points it added to the 100-point composite (weight × sub-score).
- Cash flow +12.7/30.0
- ARV discount +7.5/15.0
- Schools +4.7/10.0
- 1% rule +4.4/10.0
- Livability +4.0/5.0
- DSCR +3.8/10.0
- Rent growth +3.6/5.0
- Condition / age +2.5/5.0
- Appreciation +0.0/10.0
$245,000
🖨 Deal sheet (PDF) 📄 Offer letter ✓ Due diligence
Listing remarks
Welcome home to this 3-bedroom, 2-bathroom home with a 2-car garage tucked into a convenient Anoka location! The main level offers an inviting layout with a spacious living room, abundant natural light, and a kitchen that flows seamlessly into the dining area — perfect for everyday living and entertaining. Step outside to the patio where you can relax and enjoy peaceful pond views, frequent wildlife sightings, and a private outdoor setting. Located just minutes from parks, walking trails, shopping, restaurants, and all the charm of downtown Anoka, this home offers both comfort and convenience. Enjoy easy access to the Rum River, local community events, Riverdale shopping, and nearby s
Key facts
- $262 HOA
- 2 garage spots
- Built 1987
Property features AI
Finance
- HOA & community: Part of Anoka Meadows Townhome Association; Monthly association fee of $262; HOA covers hazard insurance, lawn care, grounds maintenance, professional management, and snow removal
Exterior
- Parking: Attached garage with 2 spaces (garage approx. 22x20)
- Utilities: City water connected; City sewer connected; Natural gas; Electric with circuit breakers
- Home design: Residential attached property; One and one-half levels; Slab foundation; Common lot dimensions
- Construction: Frame construction; Roof older than 8 years; Foundation: slab
- Exterior features: Vinyl exterior; Patio; No fencing; Irregular lot; City street frontage; Publicly maintained road
Interior
- Kitchen: Range; Refrigerator; Dishwasher
- Bedrooms: Three bedrooms (all on the upper level)
- Bathrooms: One full bathroom (upper level); One half bathroom (main level)
- Heating & cooling: Forced air heating; Central air conditioning
- Interior features: Open living room; Dining area combined with kitchen; Main floor half bathroom; Upper level full bathroom; Main floor patio access
- Laundry & utility: Main level laundry room; Washer and dryer included; Gas water heater
Neighborhood map
What this means for you Summary
Snapshot
- This is a 3-bed/1.0-bath townhouse listed at $245k.
Deal economics
- At list price, monthly cash flow is $-25 ($-304/yr) — negative.
- To cash-flow at today's rent, offer at most $241k (1.8% below list).
- To meet the 1% rule (rent ≥ 1% of price), the offer needs to be $230k (6.2% below list).
- Recommended offer: $230k (6.2% below list) — sets the bar for 1% rule.
- Cap rate 6.2% vs local median 3.4% in Anoka — top-decile yield for the area; either an underpriced asset or a hidden risk that comps aren't pricing in. Stress-test before assuming the spread holds.
Location & tenants
- Location reads 79/100 on livability (#102 in MN, #2,300 nationally) — a middle-class / working-renter tenant base. Strengths: commute A+, housing A+, cost of living B+; Watch: amenities D+, health & safety F.
- Anoka-Hennepin Public School District (suburban): math 49% / reading 55% proficiency, ranked #71 of 301 in MN (top 24%) — acceptable for families but not a draw, mixed tenant base, ~2y average lease.
- Zoned schools: Wilson Elementary (math 38% / reading 49%, grade F, #569 of 857 statewide, top 67%, 560 students, 55% FRL); Anoka Middle School For The Arts (math 39% / reading 44%, grade F, #138 of 258 statewide, top 55%, 1,678 students, 44% FRL); Anoka High School (math 26% / reading 63%, grade F, #189 of 471 statewide, top 44%, 2,322 students, 36% FRL) — zoned schools average 45% FRL vs 24% district-wide (20 pts higher); higher-poverty schools than district average — tighter screening recommended.
- Market conditions: Rents rising fast (+4.3%/yr); 346 active listings in the ZIP; 2 comparable units currently listed for rent nearby; solid renter incomes; 1,083 units permitted in Anoka County in 2024 (134 in 5+ unit buildings).
Forward outlook
- Local home prices are declining (-3.0%/yr); year-one equity from $2k of loan paydown is wiped out by about $7k of value loss. Plan a longer hold.
- Anoka County population projected at +11% by 2050 — modest demand growth; plan on rents tracking national, not racing it.
Negotiation context
- It's been on market 24 days — a 2% lower offer ($241k) is reasonable based on typical stale-listing flexibility.
- Current owner paid $161k; list at $245k implies a 52% gain — meaningful room to come down on a strong offer.
Questions for the listing agent
- What do current leases actually rent for vs. the listed asking? Can we see a recent rent roll and the last 12 months of T-12 income?
- What does the HOA fee cover, when was the last increase, and are there any pending special assessments or reserve-fund shortfalls?
- Is there a deadline driving the sale (1031 exchange, divorce, estate, relocation)? That informs how much negotiation room exists.
- The area grade is low — what's the realistic commute time and amenity access for the typical tenant pool here? Any planned neighborhood developments (good or bad) we should know about?
- What's the average days-on-market for RENTAL listings here right now (not sales)? A rising rental-DOM trend means longer vacancies and softer asking-rent achievability than the comps imply.
- What's the recent tenant-quality profile in this submarket — average credit score on applications, eviction rate, late-payment / NSF rate, and stable-employment percentage? A property-management company in the area should have these aggregated.
- How much new for-sale + rental construction is in the pipeline within 1–3 miles? Heavy new supply typically softens prices + rents 12–24 months out; constrained supply supports both.
Investment metrics
- 1% rule
- 0.94% ✗
- Cap rate
- 6.17%
- Cash-on-cash
- -0.44%
- DSCR
- 0.98
- GRM
- 8.9
CMA / ARV
No comps found within radius.
Projected returns pro-forma
-3.0% appreciation · 4.31% rent growth · sell at horizon
- IRR
- -15.4%
- Equity multiple
- 0.44×
- Total profit
- $-38,119
- Equity at exit
- $36,530
- IRR
- -4.5%
- Equity multiple
- 0.68×
- Total profit
- $-21,826
- Equity at exit
- $21,183
Cash invested: $68,600 (down + closing). Projections, not guarantees.
Landlord ↔ Tenant lean methodology
- Overall (STATE)
- 46 Balanced
- State Minnesota
- 46 Balanced · D+2
- County
- — inherits STATE
- City
- — inherits STATE
ZIP-level market 55303
- Rents YoY
- 4.3%
- Active inventory
- 346
- Price-to-rent
- 8.9×
Monthly cashflow live
- Estimated rent
- $2,298 medium interval (Pro) →
- Mortgage (P&I)
- −$1,285
- Tax from tax record
- −$192 /mo · $2,306/yr
- Insurance
- −$102
- HOA
- −$262
- Vacancy / Maint / Mgmt
- −$483
- Net cashflow
- $-25
Break-even live
Sensitivity live
| Price | -10% $113 | -5% $44 | +0% $-25 | +5% $-95 | +10% $-164 |
|---|---|---|---|---|---|
| Rent | -10% $-207 | -5% $-116 | +0% $-25 | +5% $65 | +10% $156 |
| Rate | -1.0pp $98 | -0.5pp $37 | base $-25 | +0.5pp $-89 | +1.0pp $-153 |
UW: 25.0% down · 7.5% · 30yr · 1.5% tax · 5.0% vac · 8.0% maint · 8.0% mgmt
Financing live
Cash to close
- Down payment
- $61,250
- Closing costs
- $7,350
- Reserves months
- —
- Total cash needed
- —
Loan-product check · same deal, 3 products live
Conventional
25% down · 7.5% · 30yr
- Down + closing
- —
- Monthly P&I
- —
- Monthly cashflow
- —
- DSCR
- —
- Eligible?
- —
Personal DTI + credit; lowest rate.
DSCR
20% down · 8.5% · 30yr
- Down + closing
- —
- Monthly P&I
- —
- Monthly cashflow
- —
- DSCR
- —
- Eligible?
- —
No personal income docs; deal must DSCR.
Hard money
10% down · 12.0% · 12mo
- Down + closing
- —
- Monthly P&I
- —
- Monthly cashflow
- —
- DSCR
- —
- Eligible?
- —
Short-term bridge; refi at stabilization.
Rent comps 2 comps
| Address | Beds | Baths | Sqft | Rent | $/sqft | DOM | Units | Dist |
|---|---|---|---|---|---|---|---|---|
| 13752 Round Lake Blvd NW Unit 1 Andover, MN | 3.0 | 1.0 | 1146 | $2,525 | $2.20 | 19d | 1 | 0.56mi |
| 3130 Northdale Blvd NW Minneapolis, MN | 2.0 | 1.0–2.0 | 958 | $2,619 | $2.73 | 0d | 18 | 1.46mi |
HOA detail
- Monthly dues
- $262 · $3,144/yr
Listing history 17 events
-
2026-06-21days on market $245,000 Active 24 DOM
-
2026-06-18days on market $245,000 Active 21 DOM
-
2026-06-17days on market $245,000 Active 20 DOM
-
2026-06-16days on market $245,000 Active 19 DOM
-
2026-06-15days on market $245,000 Active 18 DOM
-
2026-06-13days on market $245,000 Active 16 DOM
-
2026-06-13statusdays on market $245,000 Active 15 DOM
-
2026-06-09days on market $245,000 Contingent - Inspection 12 DOM
-
2026-06-08days on market $245,000 Contingent - Inspection 11 DOM
-
2026-06-07statusdays on market $245,000 Contingent - Inspection 10 DOM
-
2026-06-04days on market $245,000 Active 7 DOM
-
2026-06-03days on market $245,000 Active 6 DOM
-
2026-06-02days on market $245,000 Active 5 DOM
-
2026-06-01days on market $245,000 Active 4 DOM
-
2026-05-31days on market $245,000 Active 3 DOM
-
2026-05-22historical $245,000
-
2026-04-30soldstatus $161,000
ⓘ Source: listings_history table (triggers on properties + properties_extension) + one-shot
backfill from property_details.listing_events for pre-trigger history.
Tax reassessment forecast MN · Partial reset (capped growth)
- Current annual tax
- $2,306 · $192/mo
- Projected year-2 tax
- $2,525 · $210/mo
- Expected delta
- +$219/yr (+$18/mo · 9.5%)
ⓘ Screening estimate from a state-policy table — verify with the county assessor before closing.
Climate risk First Street
- Flood 1/10 Low FEMA zone X (unshaded) · 0% chance over 30 yrs
- Wildfire 1/10 Low
- Heat 2/10 Low 7 d/yr ≥99°F today · 14 d/yr by 30 yrs out
- Wind 2/10 Low
- Air quality 2/10 Low 2 unhealthy d/yr today · 2 by 30 yrs out
Nearby sold comps map
Loading sold comps map…
Walkable amenities ~0.75 mi
Loading nearby amenities…
Taxation est. · year 1
- Rental income
- $27,581
- − Mortgage interest
- −$13,724
- − Property taxes
- −$2,306
- − Insurance
- −$1,225
- − Repairs & maintenance
- −$2,207
- − Management
- −$2,207
- − HOA
- −$3,144
- − Depreciation
- −$7,127
- Taxable loss
- −$4,358
- Est. tax savings @ 24.0%
- +$1,046
- After-tax cash flow
- $742/yr
For passive investors: Depreciation is non-cash, so a rental often shows a tax loss while cash-flowing — sheltering income. Rental losses are passive: they offset passive income freely, and up to $25,000/yr can offset ordinary (W-2) income if you actively participate and your MAGI is under $100k (phasing out to $0 by $150k); unused losses carry forward. On sale, claimed depreciation is recaptured at up to 25%, and gains may owe capital-gains tax (a 1031 exchange can defer both). Figures are a year-1 estimate at your 24.0% rate — not tax advice; consult a CPA.
Schools (NCES district)
- District
- Anoka-Hennepin Public School District
- NCES district ID
- 2703180
- Math proficiency
- 49% ▼ -14.00%
- Reading proficiency
- 55% ▼ -10.00%
- Median HH income
- $73,837
- Composite
- 46.7/100
- National rank
- #2400
- State rank
- #71 of 301 in MN
Livability — Anoka
- Score
- 79/100
- State rank
- #102
- US rank
- #2300
Category grades
Schools grade is shown separately in the Schools card above.
Census & demographics
- Census place
- Anoka, MN
- County
- Anoka County · 277,116 people
- Metro
- Minneapolis-St. Paul-Bloomington, MN-WI
- Population (ZIP)
- 52,614
- Household income
- $102,986
- Rent vs Own
- Severe rent burden
- 1060.0
Population outlook (Anoka County) Hauer SSP2
- Today (2025)
- 375,223 people
- By 2030
- 387,850 · +3.4%
- By 2040
- 407,239 · +8.5%
- By 2050
- 417,541 · +11.3%
- By 2075
- 448,447 · +19.5%
- By 2100
- 464,954 · +23.9%
Race, ethnicity, and origin ACS 2023
- Neighborhood character
- Predominantly White (82%)
- Race & ethnicity
- White 82% Black 7% Two or more races 6% Hispanic / Latino 4% Asian 3%
- Common ancestry
- Portuguese 12% Romanian 5% Lithuanian 4%
- Foreign-born
- 7% · Canada, South Korea, Vietnam
- Languages at home
- 92% English-only · Other Asian/Pacific 2% Spanish 2% French/Haitian/Cajun 1%
Political lean MEDSL · Anoka
- 2024 margin
- Toss-up / Even · D 46.6% · R 51.0% · Other 2.4%
- 2008→2024 swing
- -2.0pp toward R · 2008: -2.4pp · 2024: -4.4pp
- All cycles
- 2024: R+4.4 2020: R+1.9 2016: R+9.7 2012: R+2.6 2008: R+2.4
Not yet ingested
- Civics
- —
Market trends
- HPI YoY
- ▼ -273.26%
- Current HPI
- 251.4034
- Rent YoY
- ▲ 4.31%
- Metro
- Minneapolis-St. Paul-Bloomington, MN-WI
- State GDP YoY
- ▲ 2.41%
- F500 in state
- 34
Industry mix (Fortune 500 HQ in MN)
| Industry | F500 HQs | Revenue |
|---|---|---|
| Healthcare | 2 | $407B |
|
||
| Retail | 2 | $150B |
|
||
| Consumer Goods | 2 | $32B |
|
||
| Industrial Machinery | 2 | $6B |
|
||
| Agriculture | 1 | $40B |
|
||
| Healthcare / Medical Devices | 1 | $32B |
|
||
Price history
+52.2% since first listed2 events — show timeline
- 2026-05-22 Coming Soon $245,000 NORTHSTARMLS as Distributed by MLS Grid
- 2026-04-30 Sold (Public Records) $161,000 Public Records
Property tax history
+5.6%/yrLatest (2026): $2,306 · +9.0% YoY. Source: county tax records.
Cash-flow waterfall
monthlySold comps — $/sqft
last 12 mo · ≤1 miLoading sold comps…