5108 154th Cir · Urbandale, IA
Flood risk No data
- FEMA flood zone
- —
- Chance of flooding over 30 yrs
- —
- Est. flood insurance / yr
- —
Fire risk No data
- Est. fire insurance / yr
- —
Heat risk No data
- Hot days now (above threshold)
- —
- Hot days in 30 yrs
- —
Wind risk No data
- Chance of severe wind over 30 yrs
- —
Air-quality risk No data
- Unhealthy air days now
- —
- Unhealthy air days in 30 yrs
- —
Risk factors via First Street. Map © Google.
Why this score? — see what drove the D- grade
The composite is a weighted blend of 9 inputs, each scored 0–100. Each bar is that input's sub-score; the figure is the points it added to the 100-point composite (weight × sub-score).
- ARV discount +12.9/15.0
- Appreciation +7.4/10.0
- Schools +7.1/10.0
- Livability +4.5/5.0
- Rent growth +2.5/5.0
- Condition / age +2.5/5.0
- Cash flow +2.2/30.0
- 1% rule +0.0/10.0
- DSCR +0.0/10.0
$529,950
🖨 Deal sheet (PDF) 📄 Offer letter ✓ Due diligence
Listing remarks
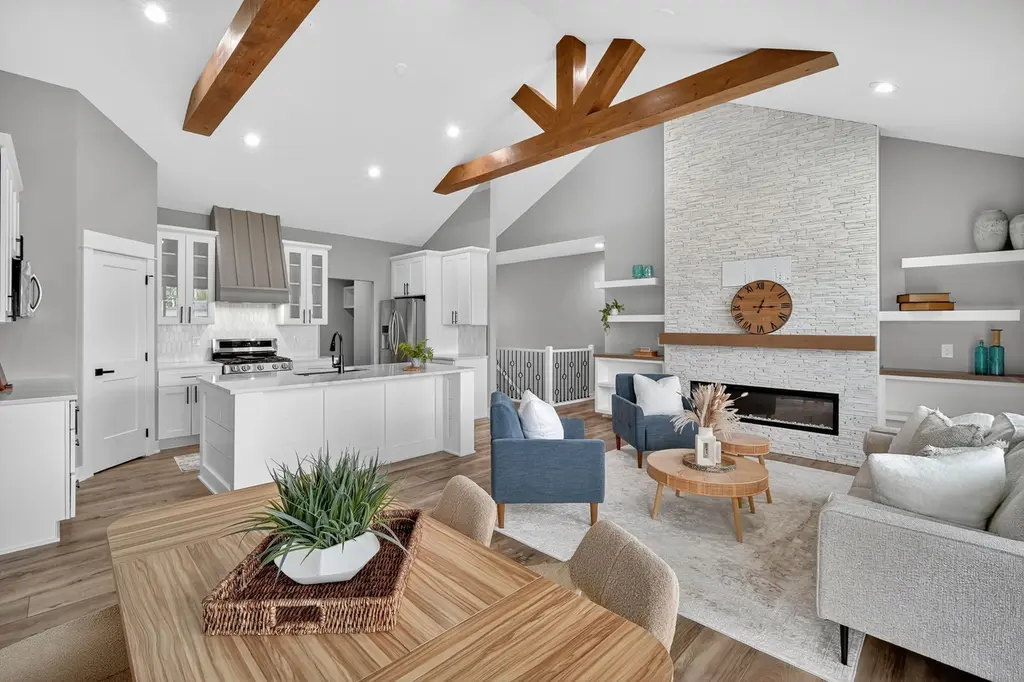
$3,000 SELLER CREDIT! Get a $3,000 buyer incentive for any accepted offer on this home by June 20, 2026. Use it for closing costs, rate buy-downs, or upgrades! This better than new, east-facing, one-owner walk-out ranch offers premium features you won’t find in today’s new construction homes. Situated on a quiet cul-de-sac and built with durable 2x6 construction, the main level provides 1,600 sq. ft. of open-concept living highlighted by striking 20ft vaulted ceilings with large exposed beams and a highly functional layout featuring three bedrooms on the main floor. This 5-bedroom, 3-bathroom home is filled with fully custom details, including wooden closet shelving throughout&m
Key facts
- 2x6 construction
- Cul-de-sac
- 0.33 acre lot
Tags
Property features AI
Finance
- HOA & community: Homeowners association (Terrus Real Estate Group) with an annual fee of $230
Exterior
- Parking: Attached three-car garage
- Security: Security system; Fire alarm; Smoke detectors
- Utilities: Public water; Public sewer
- Home design: One-story home; Resale property; Built by Emanation Homes; Pie-shaped lot on a cul-de-sac; Concrete road access; Facing R zoning
- Construction: Poured foundation; Asphalt shingle roof
- Exterior features: Deck; Covered deck/porch; Sprinkler/irrigation system
Interior
- Kitchen: Dishwasher; Microwave; Refrigerator; Stove
- Bedrooms: Three main-level bedrooms
- Flooring: Carpet; Tile
- Bathrooms: Two full bathrooms; One three-quarter bathroom
- Heating & cooling: Forced-air heating (natural gas); Central air conditioning
- Interior features: Wet bar; Dining area; Eat-in kitchen; Cable TV; Window treatments; Finished basement with walk-out access; Electric fireplace (1)
- Laundry & utility: Main-level laundry
Neighborhood map
What this means for you Summary
Snapshot
- This is a 5-bed/3.0-bath other listed at $530k.
Deal economics
- At list price, monthly cash flow is $-2k ($-23k/yr) — negative.
- To cash-flow at today's rent, offer at most $194k (63.4% below list).
- To meet the 1% rule (rent ≥ 1% of price), the offer needs to be $229k (56.9% below list).
- Recommended offer: $194k (63.4% below list) — sets the bar for cash-flow.
Location & tenants
- Location reads 90/100 on livability (#4 in IA, #69 nationally) — a professional / high-income tenant draw. Strengths: crime A+, amenities A+, employment A+; Watch: commute F.
- Waukee Community School District (suburban): math 80% / reading 79% proficiency, ranked #14 of 289 in IA (top 5%) — strong family-tenant draw, lease renewals of 3-5y typical; only 11% free/reduced lunch — higher-income household profile.
- Zoned schools: Walnut Hills Elementary School (math 91% / reading 81%, grade A+, #26 of 616 statewide, top 4%, 625 students, 9% FRL); Waukee Middle School (math 83% / reading 81%, grade A+, #22 of 246 statewide, top 12%, 1,069 students, 12% FRL); Waukee High School (math 74% / reading 82%, grade A-, #53 of 336 statewide, top 16%, 1,268 students, 24% FRL) — zoned schools at 15% FRL track the district average.
- Market conditions: 381 active listings in the ZIP; 1 comparable units currently listed for rent nearby; high-income renter base; 1,503 units permitted in Dallas County in 2024 (630 in 5+ unit buildings).
- This rent is only 16% of the median local income ($176k/yr) — well below the 30% rent-burden line; pricing power to push rent on renewal without tenant pushback.
Forward outlook
- In year one you build about $29k of equity ($4k loan paydown + $25k appreciation (4.8% local appreciation)).
- Dallas County population projected at +74% by 2050 — long-run rental-demand tailwind backs the buy-and-hold thesis.
- By year 2, paydown + projected appreciation supports a ~$47k cash-out refi (75% LTV) — recoverable capital for the next deal without selling this one.
Negotiation context
- It's been on market 16 days — a 2% lower offer ($522k) is reasonable based on typical stale-listing flexibility.
- 13 sale attempts since 5y ago; this cycle's ask is 11677% above the opening price — seller raised mid-cycle; expect resistance to lowballs.
Questions for the listing agent
- What do current leases actually rent for vs. the listed asking? Can we see a recent rent roll and the last 12 months of T-12 income?
- What does the HOA fee cover, when was the last increase, and are there any pending special assessments or reserve-fund shortfalls?
- Is there a deadline driving the sale (1031 exchange, divorce, estate, relocation)? That informs how much negotiation room exists.
- Schools are A-rated — typically a magnet for longer-tenancy family renters. What's the average tenant stay here, and is there a school-zone premium baked into asking?
- The area grade is low — what's the realistic commute time and amenity access for the typical tenant pool here? Any planned neighborhood developments (good or bad) we should know about?
- What's the average days-on-market for RENTAL listings here right now (not sales)? A rising rental-DOM trend means longer vacancies and softer asking-rent achievability than the comps imply.
- What's the recent tenant-quality profile in this submarket — average credit score on applications, eviction rate, late-payment / NSF rate, and stable-employment percentage? A property-management company in the area should have these aggregated.
- How much new for-sale + rental construction is in the pipeline within 1–3 miles? Heavy new supply typically softens prices + rents 12–24 months out; constrained supply supports both.
Investment metrics
- 1% rule
- 0.43% ✗
- Cap rate
- 1.99%
- Cash-on-cash
- -15.38%
- DSCR
- 0.32
- GRM
- 19.3
CMA / ARV
- ARV (median comp)
- $601,731
- List price
- $529,950
- Delta
- -11.94%
- Verdict
- UNDERPRICED
- Comps
- 20 within 1.0 mi
Projected returns pro-forma
4.81% appreciation · 3.0% rent growth · sell at horizon
- IRR
- -0.5%
- Equity multiple
- 0.97×
- Total profit
- $-4,747
- Equity at exit
- $294,135
- IRR
- 3.3%
- Equity multiple
- 1.63×
- Total profit
- $93,416
- Equity at exit
- $502,600
Cash invested: $148,386 (down + closing). Projections, not guarantees.
Landlord ↔ Tenant lean methodology
- Overall (STATE)
- 83 Strongly Landlord-Friendly
- State Iowa
- 83 Strongly Landlord-Friendly · R+6
- County
- — inherits STATE
- City
- — inherits STATE
ZIP-level market 50323
- Home prices YoY
- 2.5%
- Active inventory
- 381
- Price-to-rent
- 19.3×
Monthly cashflow live
- Estimated rent
- $2,285 medium interval (Pro) →
- Mortgage (P&I)
- −$2,779
- Tax from tax record
- −$688 /mo · $8,262/yr
- Insurance
- −$221
- HOA
- −$19
- Vacancy / Maint / Mgmt
- −$480
- Net cashflow
- $-1,902
Break-even live
Sensitivity live
| Price | -10% $-1,602 | -5% $-1,752 | +0% $-1,902 | +5% $-2,052 | +10% $-2,202 |
|---|---|---|---|---|---|
| Rent | -10% $-2,083 | -5% $-1,992 | +0% $-1,902 | +5% $-1,812 | +10% $-1,722 |
| Rate | -1.0pp $-1,635 | -0.5pp $-1,767 | base $-1,902 | +0.5pp $-2,039 | +1.0pp $-2,179 |
UW: 25.0% down · 7.5% · 30yr · 1.5% tax · 5.0% vac · 8.0% maint · 8.0% mgmt
Financing live
Cash to close
- Down payment
- $132,488
- Closing costs
- $15,898
- Reserves months
- —
- Total cash needed
- —
Loan-product check · same deal, 3 products live
Conventional
25% down · 7.5% · 30yr
- Down + closing
- —
- Monthly P&I
- —
- Monthly cashflow
- —
- DSCR
- —
- Eligible?
- —
Personal DTI + credit; lowest rate.
DSCR
20% down · 8.5% · 30yr
- Down + closing
- —
- Monthly P&I
- —
- Monthly cashflow
- —
- DSCR
- —
- Eligible?
- —
No personal income docs; deal must DSCR.
Hard money
10% down · 12.0% · 12mo
- Down + closing
- —
- Monthly P&I
- —
- Monthly cashflow
- —
- DSCR
- —
- Eligible?
- —
Short-term bridge; refi at stabilization.
Rent comps 1 comps
| Address | Beds | Baths | Sqft | Rent | $/sqft | DOM | Units | Dist |
|---|---|---|---|---|---|---|---|---|
| 5440 154th Ct Urbandale, IA | 4.0 | 3.5 | 2367 | $2,200 | $0.93 | 21d | 1 | 0.19mi |
HOA detail
- Monthly dues
- $19 · $228/yr
Listing history 46 events
-
2026-06-21days on market $529,950 Active 16 DOM
-
2026-06-18days on market $529,950 Active 13 DOM
-
2026-06-17days on market $529,950 Active 12 DOM
-
2026-06-16days on market $529,950 Active 11 DOM
-
2026-06-15days on market $529,950 Active 10 DOM
-
2026-06-14days on market $529,950 Active 8 DOM
-
2026-06-13days on market $529,950 Active 7 DOM
-
2026-06-10days on market $529,950 Active 5 DOM
-
2026-06-09days on market $529,950 Active 4 DOM
-
2026-06-09remarks 687-char remark
-
2026-06-08days on market $529,950 Active 3 DOM
-
2026-06-07pricedays on market $529,950 Active 2 DOM
-
2026-06-05days on market $529,900 Active 33 DOM
-
2026-06-03days on market $529,900 Active 32 DOM
-
2026-06-02days on market $529,900 Active 31 DOM
-
2026-06-01days on market $529,900 Active 30 DOM
-
2026-05-31days on market $529,900 Active 29 DOM
-
2026-05-31days on market $529,900 Active 28 DOM
-
2026-05-14status Pending 1314-char remark
-
2026-04-29status Active 1314-char remark
-
2026-04-27historical $4,500
-
2026-04-20status Pending 1314-char remark
-
2026-04-13$4,500
-
2026-04-10$529,900 Active 1314-char remark
-
2026-04-10historical
-
2026-03-26historical $4,750
-
2026-03-19price $535,000
-
2026-03-03$539,900 Active
-
2026-03-03historical
-
2026-02-13price $549,900
-
2026-01-24$4,750
-
2026-01-18price $559,900
-
2026-01-10historical $4,750
-
2026-01-02price $565,000
-
2026-01-02$565,000 Active
-
2026-01-02historical
-
2025-12-06price $4,750
-
2025-11-17price $569,900
-
2025-11-10$4,950
-
2025-11-02price $579,900
-
2025-10-19price $589,900
-
2025-09-29$599,900 Active
-
2021-10-12historical
-
2021-07-22status Active
-
2021-07-22price $523,923
-
2021-03-30$499,923 Active
ⓘ Source: listings_history table (triggers on properties + properties_extension) + one-shot
backfill from property_details.listing_events for pre-trigger history.
Tax reassessment forecast IA · Partial reset (capped growth)
- Current annual tax
- $8,262 · $688/mo
- Projected year-2 tax
- $8,291 · $691/mo
- Expected delta
- +$29/yr (+$2/mo · 0.4%)
ⓘ Screening estimate from a state-policy table — verify with the county assessor before closing.
Nearby sold comps map
Loading sold comps map…
Walkable amenities ~0.75 mi
Loading nearby amenities…
Taxation est. · year 1
- Rental income
- $27,423
- − Mortgage interest
- −$29,685
- − Property taxes
- −$8,262
- − Insurance
- −$2,650
- − Repairs & maintenance
- −$2,194
- − Management
- −$2,194
- − HOA
- −$228
- − Depreciation
- −$15,417
- Taxable loss
- −$33,207
- Est. tax savings @ 24.0%
- +$7,970
- After-tax cash flow
- $-14,856/yr
For passive investors: Depreciation is non-cash, so a rental often shows a tax loss while cash-flowing — sheltering income. Rental losses are passive: they offset passive income freely, and up to $25,000/yr can offset ordinary (W-2) income if you actively participate and your MAGI is under $100k (phasing out to $0 by $150k); unused losses carry forward. On sale, claimed depreciation is recaptured at up to 25%, and gains may owe capital-gains tax (a 1031 exchange can defer both). Figures are a year-1 estimate at your 24.0% rate — not tax advice; consult a CPA.
Schools (NCES district)
- District
- Waukee Community School District
- NCES district ID
- 1930510
- Math proficiency
- 80% ▼ -6.00%
- Reading proficiency
- 79% ▼ -5.00%
- Median HH income
- $88,580
- Composite
- 70.94/100
- National rank
- #245
- State rank
- #14 of 289 in IA
Livability — Urbandale
- Score
- 90/100
- State rank
- #4
- US rank
- #69
Category grades
Schools grade is shown separately in the Schools card above.
Census & demographics
- Census place
- Urbandale, IA
- County
- Polk County · 453,298 people
- City population
- 49,196
- Metro
- Des Moines-West Des Moines, IA
- Population (ZIP)
- 17,265
- Household income
- $175,944
- Rent vs Own
- Severe rent burden
- 63.0
Population outlook (Dallas County) Hauer SSP2
- Today (2025)
- 111,904 people
- By 2030
- 127,807 · +14.2%
- By 2040
- 160,576 · +43.5%
- By 2050
- 194,154 · +73.5%
- By 2075
- 271,895 · +143.0%
- By 2100
- 326,525 · +191.8%
Race, ethnicity, and origin ACS 2023
- Neighborhood character
- Predominantly White (86%)
- Race & ethnicity
- White 86% Asian 6% Two or more races 4% Hispanic / Latino 3% Black 2%
- Common ancestry
- Portuguese 6% Iranian 5% Lithuanian 2%
- Foreign-born
- 7% · Canada, China, Philippines
- Languages at home
- 92% English-only · Russian/Polish/Slavic 2% Chinese 1% Spanish 1%
Political lean MEDSL · Dallas
- 2024 margin
- Toss-up / Even · D 46.9% · R 51.7% · Other 1.4%
- 2008→2024 swing
- +0.8pp no change · 2008: -5.5pp · 2024: -4.8pp
- All cycles
- 2024: R+4.8 2020: R+2.0 2016: R+9.6 2012: R+11.8 2008: R+5.5
Not yet ingested
- Civics
- —
Market trends
- HPI YoY
- ▲ 4.81%
- Current HPI
- 199.789
- Rent YoY
- —
- Metro
- Des Moines-West Des Moines, IA
- State GDP YoY
- ▲ 2.48%
- F500 in state
- 4
Industry mix (Fortune 500 HQ in IA)
| Industry | F500 HQs | Revenue |
|---|---|---|
| Financial Services | 1 | $16B |
|
||
| Retail / Convenience | 1 | $15B |
|
||
Price history
-99.1% since first listed32 events — show timeline
- 2026-06-05 Listed for Rent $4,500 TURBOTENANT
- 2026-06-05 Listing Removed — DMMLS
- 2026-06-05 Listed $529,950 DMMLS
- 2026-05-28 Relisted — DMMLS
- 2026-05-14 Pending — DMMLS
- 2026-04-29 Relisted — DMMLS
- 2026-04-27 Rental Removed $4,500 TURBOTENANT
- 2026-04-20 Pending — DMMLS
- 2026-04-13 Listed for Rent $4,500 TURBOTENANT
- 2026-04-10 Listing Removed — DMMLS
- 2026-04-10 Listed $529,900 DMMLS
- 2026-03-26 Rental Removed $4,750 TURBOTENANT
- 2026-03-19 Price Changed $535,000 DMMLS
- 2026-03-03 Listing Removed — DMMLS
- 2026-03-03 Listed $539,900 DMMLS
- 2026-02-13 Price Changed $549,900 DMMLS
- 2026-01-24 Listed for Rent $4,750 TURBOTENANT
- 2026-01-18 Price Changed $559,900 DMMLS
- 2026-01-10 Rental Removed $4,750 TURBOTENANT
- 2026-01-02 Price Changed $565,000 DMMLS
- 2026-01-02 Listing Removed — DMMLS
- 2026-01-02 Listed $565,000 DMMLS
- 2025-12-06 Price Changed $4,750 TURBOTENANT
- 2025-11-17 Price Changed $569,900 DMMLS
- 2025-11-10 Listed for Rent $4,950 TURBOTENANT
- 2025-11-02 Price Changed $579,900 DMMLS
- 2025-10-19 Price Changed $589,900 DMMLS
- 2025-09-29 Listed $599,900 DMMLS
- 2021-10-12 Listing Removed — DMMLS
- 2021-07-22 Relisted — DMMLS
- 2021-07-22 Price Changed $523,923 DMMLS
- 2021-03-30 Listed $499,923 DMMLS
Property tax history
+412.2%/yrLatest (2025): $8,262 · +1.8% YoY. Source: county tax records.
Cash-flow waterfall
monthlySold comps — $/sqft
last 12 mo · ≤1 miLoading sold comps…