1096 Woodshire Ln Unit C210 · Naples, FL
Flood risk 6/10 · Moderate
- FEMA flood zone
- X (shaded)
- Chance of flooding over 30 yrs
- 0.72%
- Est. flood insurance / yr
- $507 – $1,088
Fire risk 1/10 · Minimal
- Est. fire insurance / yr
- $947 – $1,759
Heat risk 10/10 · Severe
- Hot days now (above 107°F)
- 7 days/yr
- Hot days in 30 yrs
- 29 days/yr
Wind risk 10/10 · Severe
- Chance of severe wind over 30 yrs
- 99.0%
Air-quality risk 2/10 · Minimal
- Unhealthy air days now
- 2 days/yr
- Unhealthy air days in 30 yrs
- 2 days/yr
Risk factors via First Street. Map © Google.
Why this score? — see what drove the F grade
The composite is a weighted blend of 9 inputs, each scored 0–100. Each bar is that input's sub-score; the figure is the points it added to the 100-point composite (weight × sub-score).
- ARV discount +7.5/15.0
- Cash flow +7.0/30.0
- Schools +5.0/10.0
- 1% rule +4.2/10.0
- Livability +4.0/5.0
- Rent growth +2.7/5.0
- Condition / age +2.5/5.0
- DSCR +1.2/10.0
- Appreciation +0.0/10.0
$280,000
🖨 Deal sheet (PDF) 📄 Offer letter ✓ Due diligence
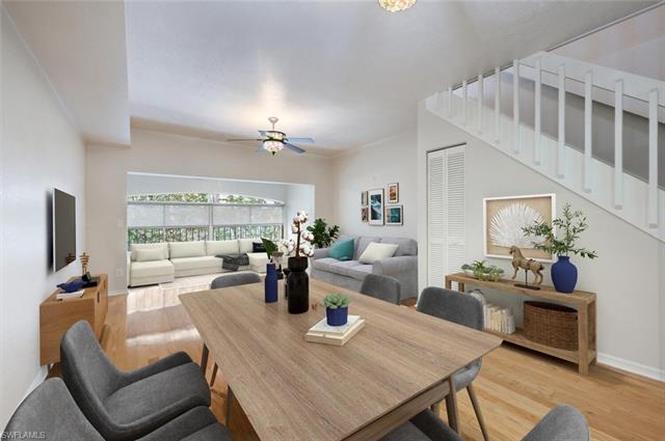
Listing remarks
Fairways at Emerald Greens offers an exceptional location in a top-tier school district, just minutes from beach access at Clam Pass and the scenic boardwalk, along with world-class shopping and dining at Waterside Shops. Everyday conveniences are truly just blocks away—Publix, Home Depot, Target, Staples, and a wide variety of popular eateries. This immaculate second-floor condo features two private suites upstairs and an open, light-filled living space below. The lanai has been extended and enclosed under air, enhancing the main living area. Enjoy peaceful treetop views on both levels, providing a rare sense of privacy. The interior showcases beautiful hardwood floors in the downsta
Key facts
- Scenic boardwalk
- World-class shopping
- Beach access
Tags
Property features AI
Finance
- Other: Property is part of a complex with 141 units and 8 units in the building; 2 units per floor, building has 2 floors; Restrictions include architectural, deeded, no commercial, no motorcycles, no RVs
- HOA & community: Quarterly condo fee; Condo fee $1,843 quarterly (total annual recurring fees $7,372); One-time fees $150; Professional management; HOA maintenance covers cable, insurance, internet/Wi-Fi, lawn/land maintenance, legal/accounting, manager, exterior pest control, reserves, sewer, street lights, street maintenance and water; Community amenities include BBQ/picnic area, community pool, internet access, sidewalks, streetlights and tennis court; Community type: see remarks; Sub-association: FAIRWAYS AT EMERALD GREENS
Exterior
- Parking: 1 assigned parking space; Deeded parking; Paved parking
- Utilities: Water assessment paid; Sewer assessment paid; Cable available
- Home design: Residential property; Low-rise (1-3) building; 2-story building; 2-story floor plan; Rear exposure faces north
- Construction: Concrete block construction; Built in 1991; Tile roof; Stucco finish; Foundation information not provided
- Exterior features: Courtyard; Stucco exterior; Shutters (electric); Single-hung windows; Tile roof; Landscaped view
Interior
- Kitchen: Pantry; Dishwasher; Disposal; Microwave; Range; Refrigerator
- Bedrooms: 2 bedrooms; Master bedroom upstairs; Split bedroom floor plan; Two master suites
- Flooring: Tile; Wood
- Bathrooms: 2 full bathrooms; 1 half bathroom; Master bath with combo tub and shower and dual sinks
- Heating & cooling: Central electric heat; Central electric cooling; Ceiling fans
- Interior features: Bar; Built-in cabinets; Cable prewire; Cathedral ceiling; High-speed internet available; Pantry; Smoke detectors; Window coverings; Breakfast bar; Guest bath; Guest room; Laundry in residence
- Laundry & utility: Washer and dryer in unit
Neighborhood map
What this means for you Summary
Snapshot
- This is a 2-bed/2.5-bath condo listed at $280k.
Deal economics
- At list price, monthly cash flow is $-414 ($-5k/yr) — negative.
- To cash-flow at today's rent, offer at most $207k (26.1% below list).
- To meet the 1% rule (rent ≥ 1% of price), the offer needs to be $257k (8.1% below list).
- Recommended offer: $207k (26.1% below list) — sets the bar for cash-flow.
Location & tenants
- Location reads 80/100 on livability (#126 in FL, #1,903 nationally) — a professional / high-income tenant draw. Strengths: crime A+, amenities A+, employment A+; Watch: commute D+, cost of living F.
- Collier (suburban): math 60% / reading 56% proficiency, ranked #16 of 73 in FL (top 22%) — acceptable for families but not a draw, mixed tenant base, ~2y average lease.
- Zoned schools: Sea Gate Elementary School (math 86% / reading 81%, grade A+, #60 of 2,144 statewide, top 3%, 703 students, 26% FRL); Pine Ridge Middle School (math 74% / reading 70%, grade A, #52 of 571 statewide, top 10%, 832 students, 31% FRL); Barron Collier High School (math 62% / reading 68%, grade B, #76 of 667 statewide, top 11%, 1,650 students, 26% FRL) — zoned schools average 27% FRL vs 55% district-wide (28 pts lower); this property's tenant base skews higher-income than the district average.
- Zoned-school proficiency averages 74% at this address vs 58% district-wide (+16 pts) — the actual schools serving this property are materially stronger than the Collier average implies; a family-tenant draw the district grade alone would hide.
- Market conditions: Rents flat; 334 active listings in the ZIP; 40 comparable units currently listed for rent nearby; rentals at typical pace (median 16d on market — plan ~3-4 weeks tenant-placement turnaround); solid renter incomes; 3,520 units permitted in Collier County in 2024 (959 in 5+ unit buildings).
- This rent runs 33% of the median local income ($92k/yr) — at the standard rent-burdened threshold; future hikes will face affordability resistance.
Forward outlook
- Local home prices are declining (-3.0%/yr); year-one equity from $2k of loan paydown is wiped out by about $8k of value loss. Plan a longer hold.
- Collier County population projected at +30% by 2050 — long-run rental-demand tailwind backs the buy-and-hold thesis.
Negotiation context
- It's been on market 125 days — a 12% lower offer ($246k) is reasonable based on typical stale-listing flexibility.
- 2 sale attempts since 2y ago with the ask held roughly flat each time — persistent listings suggest the price (not the market) is what's stuck; bring a comps-based counter.
- Current owner paid $80k; list at $280k implies a 250% gain — meaningful room to come down on a strong offer.
Risks & watch-outs
- Watch-outs: HOA is 24% of rent.
- Climate carrying-cost: major flood risk; severe wind risk, 99% chance of damaging wind over 30y; extreme-heat days projected 7→29/yr by 2055 (HVAC capex compounding) — expect insurance premiums to compound above CPI over the hold.
Questions for the listing agent
- What do current leases actually rent for vs. the listed asking? Can we see a recent rent roll and the last 12 months of T-12 income?
- It's been on market 125 days. Have you received any prior offers? Is the seller open to a 26% concession, seller financing, or rate buy-down credit?
- What does the HOA fee cover, when was the last increase, and are there any pending special assessments or reserve-fund shortfalls?
- Any open or pending special assessments — roof, HVAC, plumbing, elevator, façade? What's the per-unit balance and payoff schedule, and is the seller paying it off at close or rolling it to the buyer?
- Why hasn't it sold? Are there any deal-killer items the seller is aware of (foundation, flood, title, zoning, code violations)?
- Is there a deadline driving the sale (1031 exchange, divorce, estate, relocation)? That informs how much negotiation room exists.
- Schools are B-rated — typically a magnet for longer-tenancy family renters. What's the average tenant stay here, and is there a school-zone premium baked into asking?
- The area grade is low — what's the realistic commute time and amenity access for the typical tenant pool here? Any planned neighborhood developments (good or bad) we should know about?
- What's the average days-on-market for RENTAL listings here right now (not sales)? A rising rental-DOM trend means longer vacancies and softer asking-rent achievability than the comps imply.
- What's the recent tenant-quality profile in this submarket — average credit score on applications, eviction rate, late-payment / NSF rate, and stable-employment percentage? A property-management company in the area should have these aggregated.
- How much new apartment / multifamily construction is in the pipeline within 1–3 miles? Heavy new supply (>2% of stock underway) typically softens rents 12–24 months out; light construction supports rent growth.
Investment metrics
- 1% rule
- 0.92% ✗
- Cap rate
- 4.52%
- Cash-on-cash
- -6.34%
- DSCR
- 0.72
- GRM
- 9.1
CMA / ARV
No comps found within radius.
Projected returns pro-forma
-3.0% appreciation · 0.85% rent growth · sell at horizon
- IRR
- -30.3%
- Equity multiple
- 0.02×
- Total profit
- $-76,837
- Equity at exit
- $41,749
- IRR
- -49.6%
- Equity multiple
- -0.54×
- Total profit
- $-120,847
- Equity at exit
- $24,209
Cash invested: $78,400 (down + closing). Projections, not guarantees.
Landlord ↔ Tenant lean methodology
- Overall (STATE)
- 87 Strongly Landlord-Friendly
- State Florida
- 87 Strongly Landlord-Friendly · R+3
- County
- — inherits STATE
- City
- — inherits STATE
ZIP-level market 34105
- Home prices YoY
- -30.5%
- Rents YoY
- 0.8%
- Active inventory
- 334
- Price-to-rent
- 9.1×
Monthly cashflow live
- Estimated rent
- $2,574 high interval (Pro) →
- Mortgage (P&I)
- −$1,468
- Tax from tax record
- −$248 /mo · $2,978/yr
- Insurance
- −$117
- HOA
- −$614
- Vacancy / Maint / Mgmt
- −$540
- Net cashflow
- $-414
Break-even live
Sensitivity live
| Price | -10% $-255 | -5% $-335 | +0% $-414 | +5% $-493 | +10% $-572 |
|---|---|---|---|---|---|
| Rent | -10% $-617 | -5% $-516 | +0% $-414 | +5% $-312 | +10% $-211 |
| Rate | -1.0pp $-273 | -0.5pp $-343 | base $-414 | +0.5pp $-487 | +1.0pp $-560 |
UW: 25.0% down · 7.5% · 30yr · 1.5% tax · 5.0% vac · 8.0% maint · 8.0% mgmt
Financing live
Cash to close
- Down payment
- $70,000
- Closing costs
- $8,400
- Reserves months
- —
- Total cash needed
- —
Loan-product check · same deal, 3 products live
Conventional
25% down · 7.5% · 30yr
- Down + closing
- —
- Monthly P&I
- —
- Monthly cashflow
- —
- DSCR
- —
- Eligible?
- —
Personal DTI + credit; lowest rate.
DSCR
20% down · 8.5% · 30yr
- Down + closing
- —
- Monthly P&I
- —
- Monthly cashflow
- —
- DSCR
- —
- Eligible?
- —
No personal income docs; deal must DSCR.
Hard money
10% down · 12.0% · 12mo
- Down + closing
- —
- Monthly P&I
- —
- Monthly cashflow
- —
- DSCR
- —
- Eligible?
- —
Short-term bridge; refi at stabilization.
Rent comps 40 comps
| Address | Beds | Baths | Sqft | Rent | $/sqft | DOM | Units | Dist |
|---|---|---|---|---|---|---|---|---|
| 1044 Woodshire Ln Unit B212 Naples, FL | 3.0 | 2.0 | 1250 | $8,000 | $6.40 | 25d | 1 | 0.03mi |
| 190 Turtle Lake Ct Unit 6 Naples, FL | 2.0 | 2.0 | 842 | $2,100 | $2.49 | 15d | 1 | 0.25mi |
| 180 Turtle Lake Ct #102 Naples, FL | 2.0 | 2.0 | 842 | $1,850 | $2.20 | 23d | 1 | 0.27mi |
| 200 Turtle Lake Ct #109 Naples, FL | 2.0 | 2.0 | 842 | $1,295 | $1.54 | 25d | 1 | 0.31mi |
| 170 Turtle Lake Ct Naples, FL | 2.0 | 2.0 | 842 | $2,975 | $3.53 | 15d | 1 | 0.31mi |
| 287 Quail Forest Blvd #117 Naples, FL | 2.0 | 2.0 | 993 | $1,695 | $1.71 | 15d | 1 | 0.32mi |
| 287 Quail Forest Blvd #117 Naples, FL | 2.0 | 2.0 | 993 | $1,995 | $2.01 | 23d | 1 | 0.32mi |
| 260 Quail Forest Blvd Naples, FL | 1.0–2.0 | 1.0–2.0 | 875 | $2,533 | $2.89 | 15d | 22 | 0.35mi |
| 225 Turtle Lake Ct Naples, FL | 1.0–2.0 | 1.0–2.0 | 740 | $1,900 | $2.57 | 25d | 2 | 0.38mi |
| 1545 Oyster Catcher Pt Unit A Naples, FL | 2.0 | 2.0 | 1124 | $2,200 | $1.96 | 15d | 1 | 0.38mi |
| 1085 Forest Lakes Dr Unit 8106 Naples, FL | 2.0 | 2.0 | 1000 | $1,900 | $1.90 | 15d | 1 | 0.39mi |
| 1085 Forest Lakes Dr Unit 8305 Naples, FL | 1.0 | 1.0 | 766 | $3,000 | $3.92 | 15d | 1 | 0.39mi |
| 1085 Forest Lakes Dr Unit 8202 Naples, FL | 2.0 | 2.0 | 1086 | $2,800 | $2.58 | 15d | 1 | 0.39mi |
| 1554 Oyster Catcher Pt Unit C Naples, FL | 2.0 | 2.0 | 1124 | $2,900 | $2.58 | 25d | 1 | 0.43mi |
| 175 Turtle Lake Ct Naples, FL | 1.0–2.0 | 1.0–2.0 | 740 | $1,650 | $2.23 | 15d | 2 | 0.43mi |
| 1086 Forest Lakes Dr Unit 9303 Naples, FL | 2.0 | 2.0 | 1000 | $2,395 | $2.40 | 15d | 1 | 0.44mi |
| 200 Forest Lakes Blvd #111 Naples, FL | 2.0 | 2.0 | 842 | $3,100 | $3.68 | 15d | 1 | 0.46mi |
| 1629 Spoonbill Ln Unit 1629-A Naples, FL | 2.0 | 2.0 | 1250 | $2,000 | $1.60 | 15d | 1 | 0.47mi |
| 100 Forest Lakes Blvd Naples, FL | 1.0–2.0 | 2.0 | 842 | $3,500 | $4.16 | 15d | 3 | 0.47mi |
| 300 Forest Lakes Blvd Naples, FL | 2.0 | 2.0 | 842 | $2,700 | $3.21 | 25d | 2 | 0.49mi |
| 1350 Misty Pines Cir Unit E-204 Naples, FL | 2.0 | 2.0 | 1200 | $7,500 | $6.25 | 15d | 1 | 0.51mi |
| 400 Forest Lakes Blvd Naples, FL | 2.0 | 2.0 | 842 | $2,350 | $2.79 | 23d | 4 | 0.51mi |
| 500 Misty Pines Cir #206 Naples, FL | 2.0 | 2.0 | 1260 | $6,000 | $4.76 | 15d | 1 | 0.52mi |
| 500 Misty Pines Cir Unit 2-204 Naples, FL | 2.0 | 2.0 | 1260 | $5,750 | $4.56 | 15d | 1 | 0.52mi |
| 499 Forest Lakes Blvd #105 Naples, FL | 2.0 | 2.0 | 919 | $1,950 | $2.12 | 15d | 1 | 0.52mi |
| 1860 Bald Eagle Dr Unit 403B Naples, FL | 2.0 | 2.0 | 1325 | $3,000 | $2.26 | 15d | 1 | 0.54mi |
| 501 Forest Lakes Blvd #111 Naples, FL | 2.0 | 2.0 | 919 | $2,300 | $2.50 | 15d | 1 | 0.56mi |
| 3308 Europa Dr #30 Naples, FL | 2.0 | 2.0 | 1205 | $5,500 | $4.56 | 25d | 1 | 0.74mi |
| 2581 Poinciana St Naples, FL | 3.0 | 2.0 | 1255 | $9,000 | $7.17 | 25d | 1 | 0.94mi |
| 1400 Pompei Ln Naples, FL | 2.0 | 2.0 | 1012 | $1,888 | $1.86 | 25d | 2 | 1.03mi |
| 1400 Pompei Ln Unit S-21 Naples, FL | 2.0 | 2.0 | 1025 | $3,000 | $2.93 | 25d | 1 | 1.03mi |
| 1400 Pompei Ln Unit O-21 Naples, FL | 2.0 | 2.0 | 1025 | $2,200 | $2.15 | 25d | 1 | 1.03mi |
| 3520 Bolero Way Unit 1325569P Naples, FL | 3.0 | 2.0 | 1399 | $5,021 | $3.59 | 15d | 1 | 1.03mi |
| 5934 Premier Way Naples, FL | 1.0–3.0 | 1.0–3.0 | 1350 | $3,618 | $2.68 | 15d | 29 | 1.09mi |
| 4525 Fluvia Ave Naples, FL | 2.0 | 1.0 | 1050 | $5,500 | $5.24 | 25d | 1 | 1.11mi |
| 4523 Fluvia Ave Naples, FL | 2.0 | 1.0 | 1050 | $5,500 | $5.24 | 25d | 1 | 1.11mi |
| 5301 Summerwind Dr Naples, FL | 1.0–2.0 | 1.0–2.0 | 836 | $1,864 | $2.23 | 15d | 12 | 1.12mi |
| 1082 Capri Dr Naples, FL | 3.0 | 2.0 | 1500 | $9,000 | $6.00 | 25d | 1 | 1.27mi |
| 3225 Cypress Glen Way #105 Naples, FL | 2.0 | 2.0 | 1191 | $2,900 | $2.43 | 25d | 1 | 1.37mi |
| 1100 Pine Ridge Rd Naples, FL | 1.0 | 1.0 | 868 | $2,125 | $2.45 | 15d | 3 | 1.39mi |
HOA detail condo
- Monthly dues
- $614 · $7,368/yr
- Likely covers
- water
- Assessments
- None detected in remarks — confirm with the listing agent.
Listing history 20 events
-
2026-06-21days on market $280,000 Active 125 DOM
-
2026-06-18days on market $280,000 Active 122 DOM
-
2026-06-17days on market $280,000 Active 121 DOM
-
2026-06-16days on market $280,000 Active 120 DOM
-
2026-06-15days on market $280,000 Active 119 DOM
-
2026-06-14days on market $280,000 Active 117 DOM
-
2026-06-10days on market $280,000 Active 114 DOM
-
2026-06-09days on market $280,000 Active 113 DOM
-
2026-06-08days on market $280,000 Active 112 DOM
-
2026-06-07days on market $280,000 Active 111 DOM
-
2026-06-03days on market $280,000 Active 107 DOM
-
2026-06-02days on market $280,000 Active 106 DOM
-
2026-06-01days on market $280,000 Active 105 DOM
-
2026-05-31days on market $280,000 Active 104 DOM
-
2026-05-30days on market $280,000 Active 103 DOM
-
2026-02-16$280,000 Active
-
2025-03-18historical
-
2025-01-14price $355,000
-
2024-06-26$375,000 Active
-
1991-09-01soldstatus $79,900
ⓘ Source: listings_history table (triggers on properties + properties_extension) + one-shot
backfill from property_details.listing_events for pre-trigger history.
Tax reassessment forecast FL · Resets to sale price
- Current annual tax
- $2,978 · $248/mo
- Projected year-2 tax
- $2,978 · $248/mo
- Expected delta
- $0/yr ($0/mo · 0.0%)
ⓘ Screening estimate from a state-policy table — verify with the county assessor before closing.
Climate risk First Street
- Flood 6/10 Major FEMA zone X (shaded) · 72% chance over 30 yrs
- Wildfire 1/10 Low
- Heat 10/10 Extreme 7 d/yr ≥107°F today · 29 d/yr by 30 yrs out
- Wind 10/10 Extreme 99% chance of damaging wind over 30 yrs
- Air quality 2/10 Low 2 unhealthy d/yr today · 2 by 30 yrs out
Nearby sold comps map
Loading sold comps map…
Walkable amenities ~0.75 mi
Loading nearby amenities…
Taxation est. · year 1
- Rental income
- $30,884
- − Mortgage interest
- −$15,684
- − Property taxes
- −$2,978
- − Insurance
- −$1,400
- − Repairs & maintenance
- −$2,471
- − Management
- −$2,471
- − HOA
- −$7,368
- − Depreciation
- −$8,145
- Taxable loss
- −$9,633
- Est. tax savings @ 24.0%
- +$2,312
- After-tax cash flow
- $-2,656/yr
For passive investors: Depreciation is non-cash, so a rental often shows a tax loss while cash-flowing — sheltering income. Rental losses are passive: they offset passive income freely, and up to $25,000/yr can offset ordinary (W-2) income if you actively participate and your MAGI is under $100k (phasing out to $0 by $150k); unused losses carry forward. On sale, claimed depreciation is recaptured at up to 25%, and gains may owe capital-gains tax (a 1031 exchange can defer both). Figures are a year-1 estimate at your 24.0% rate — not tax advice; consult a CPA.
Schools (NCES district)
- District
- Collier
- NCES district ID
- 1200330
- Math proficiency
- 60% ▼ -4.00%
- Reading proficiency
- 56% ▼ -2.00%
- Median HH income
- $58,275
- Composite
- 50.23/100
- National rank
- #1892
- State rank
- #16 of 73 in FL
Livability — Naples
- Score
- 80/100
- State rank
- #126
- US rank
- #1903
Category grades
Schools grade is shown separately in the Schools card above.
Census & demographics
- County
- Collier County · 396,295 people
- City population
- 344,941
- Metro
- Naples-Marco Island, FL
- Population (ZIP)
- 15,441
- Household income
- $92,214
- Rent vs Own
- Severe rent burden
- 780.0
Population outlook (Collier County) Hauer SSP2
- Today (2025)
- 420,858 people
- By 2030
- 450,054 · +6.9%
- By 2040
- 502,232 · +19.3%
- By 2050
- 544,932 · +29.5%
- By 2075
- 627,203 · +49.0%
- By 2100
- 659,015 · +56.6%
Race, ethnicity, and origin ACS 2023
- Neighborhood character
- Predominantly White (79%)
- Race & ethnicity
- White 79% Hispanic / Latino 14% Two or more races 7% Asian 5%
- Hispanic origin (detail)
- Mexican 3% Puerto Rican 1% Cuban 3% Salvadoran 1%
- Common ancestry
- Romanian 3% Lithuanian 3% Italian 3%
- Foreign-born
- 22% · Canada, China, Jamaica
- Languages at home
- 77% English-only · Spanish 11% Other Indo-European 3% Russian/Polish/Slavic 3%
Political lean MEDSL · Collier
- 2024 margin
- Solid R (+33.1) · D 33.1% · R 66.2%
- 2008→2024 swing
- -10.6pp toward R · 2008: -22.5pp · 2024: -33.1pp
- All cycles
- 2024: R+33.1 2020: R+24.7 2016: R+26.0 2012: R+30.1 2008: R+22.5
Not yet ingested
- Civics
- —
Market trends
- HPI YoY
- ▼ -124.65%
- Current HPI
- 283.9084
- Rent YoY
- ▲ 0.85%
- Metro
- Naples-Marco Island, FL
- State GDP YoY
- ▲ 3.28%
- F500 in state
- 36
Industry mix (Fortune 500 HQ in FL)
| Industry | F500 HQs | Revenue |
|---|---|---|
| Industrial Technology | 2 | $29B |
|
||
| Insurance | 2 | $17B |
|
||
| Retail | 1 | $60B |
|
||
| Technology Distribution | 1 | $58B |
|
||
| Homebuilding | 1 | $35B |
|
||
| Technology Manufacturing | 1 | $35B |
|
||
Price history
+250.4% since first listed5 events — show timeline
- 2026-02-16 Listed $280,000 NAPLESMLS
- 2025-03-18 Listing Removed — NAPLESMLS
- 2025-01-14 Price Changed $355,000 NAPLESMLS
- 2024-06-26 Listed $375,000 NAPLESMLS
- 1991-09-01 Sold (Public Records) $79,900 Public Records
Property tax history
+14.0%/yrLatest (2025): $2,978 · +239.6% YoY. Source: county tax records.
Cash-flow waterfall
monthlySold comps — $/sqft
last 12 mo · ≤1 miLoading sold comps…