14638 E Fm 1716 · Lake Cherokee, TX
Flood risk 1/10 · Minimal
- FEMA flood zone
- X (unshaded)
- Chance of flooding over 30 yrs
- 0.0%
- Est. flood insurance / yr
- $507 – $1,088
Fire risk 6/10 · Moderate
- Est. fire insurance / yr
- $1,222 – $2,270
Heat risk 7/10 · Major
- Hot days now (above 110°F)
- 7 days/yr
- Hot days in 30 yrs
- 24 days/yr
Wind risk 6/10 · Moderate
- Chance of severe wind over 30 yrs
- 64.0%
Air-quality risk 2/10 · Minimal
- Unhealthy air days now
- 1 days/yr
- Unhealthy air days in 30 yrs
- 1 days/yr
Risk factors via First Street. Map © Google.
Why this score? — see what drove the D- grade
The composite is a weighted blend of 9 inputs, each scored 0–100. Each bar is that input's sub-score; the figure is the points it added to the 100-point composite (weight × sub-score).
- ARV discount +15.0/15.0
- Appreciation +8.0/10.0
- Schools +4.2/10.0
- Cash flow +4.1/30.0
- Livability +3.3/5.0
- Rent growth +2.5/5.0
- Condition / age +2.5/5.0
- 1% rule +0.2/10.0
- DSCR +0.0/10.0
$264,900
🖨 Deal sheet 📄 Offer letter ✓ Due diligence
Listing remarks MLS
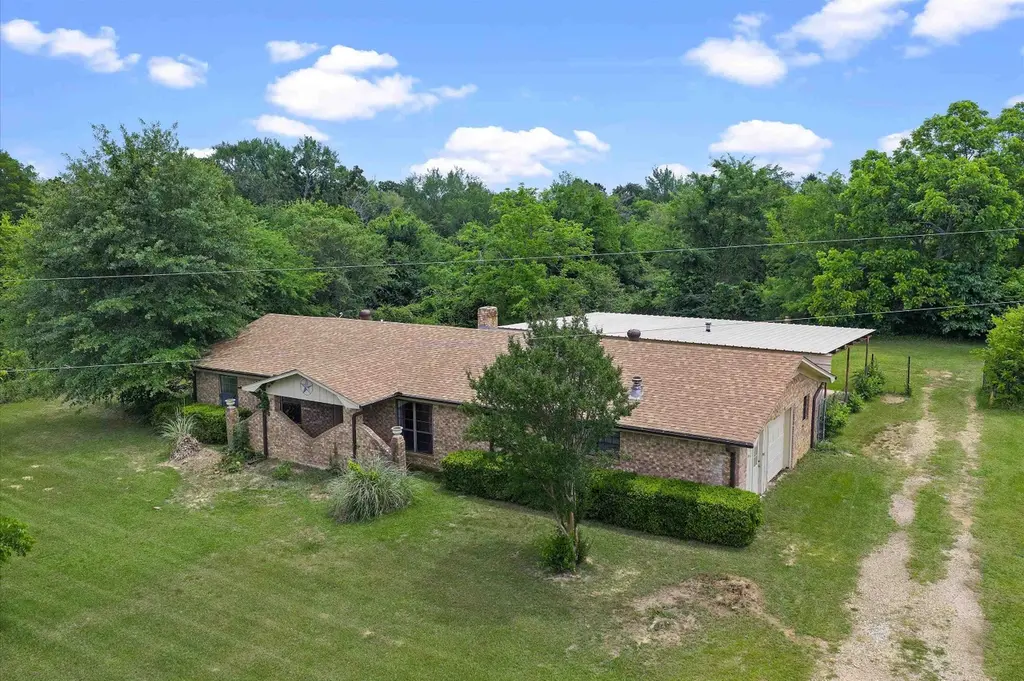
Discover the perfect blend of space, convenience, and opportunity with this 3-bedroom, 2-bath home situated on approximately 6 acres in a highly desirable location. Ideally positioned between Kilgore and Longview, this property offers easy access to nearby amenities while still enjoying the peace of country living. Located within a great school district, this home is perfect for families seeking both comfort and convenience. With a little updating, this property has incredible potential to truly become your dream home. The solid layout and spacious setting provide the perfect foundation to add your personal touch and style. The property also features a separate building that was previously used for to-go orders, complete with essential components—offering endless possibilities for a small business, home office, or creative space to fit your needs. An oversized carport with an attached smoker adds even more potential. With a little work, this space could be transformed into the ultimate outdoor entertaining area. With acreage, versatility, and a fantastic location, this property is full of potential and ready for its next owner to make it their own.
Key facts
- Separate building
- Oversized carport
- 6 acres
Tags
Neighborhood map
What this means for you Summary
Snapshot
- This is a 3-bed/2.5-bath single-family listed at $265k.
Deal economics
- At list price, monthly cash flow is $-725 ($-9k/yr) — negative.
- To cash-flow at today's rent, offer at most $137k (48.4% below list).
- To meet the 1% rule (rent ≥ 1% of price), the offer needs to be $138k (48.0% below list).
- Recommended offer: $137k (48.4% below list) — sets the bar for cash-flow.
Location & tenants
- Location reads 66/100 on livability (#650 in TX) — a middle-class / working-renter tenant base. Strengths: crime A+, housing A+, employment A; Watch: schools D-, amenities F, commute F.
- Tatum ISD (rural): math 48% / reading 50% proficiency, ranked #194 of 826 in TX (top 24%) — families likely to look elsewhere, expect single-tenant / working-renter base with shorter leases.
- Market conditions: 113 active listings in the ZIP; 4 units permitted in Rusk County in 2024 (0 in 5+ unit buildings).
Forward outlook
- In year one you build about $18k of equity ($2k loan paydown + $16k appreciation (6.1% local appreciation)).
- Rusk County population projected to shrink 5% by 2050 — rents likely to lag national; underwrite the cash flow, not the appreciation.
- By year 3, paydown + projected appreciation supports a ~$44k cash-out refi (75% LTV) — recoverable capital for the next deal without selling this one.
Negotiation context
- It's been on market 65 days — a 6% lower offer ($249k) is reasonable based on typical stale-listing flexibility.
Risks & watch-outs
- Climate carrying-cost: major wind risk, 64% chance of damaging wind over 30y; major wildfire risk; extreme-heat days projected 7→24/yr by 2055 (HVAC capex compounding) — expect insurance premiums to compound above CPI over the hold.
Questions for the listing agent
- What do current leases actually rent for vs. the listed asking? Can we see a recent rent roll and the last 12 months of T-12 income?
- It's been on market 65 days. Have you received any prior offers? Is the seller open to a 48% concession, seller financing, or rate buy-down credit?
- Why hasn't it sold? Are there any deal-killer items the seller is aware of (foundation, flood, title, zoning, code violations)?
- Is there a deadline driving the sale (1031 exchange, divorce, estate, relocation)? That informs how much negotiation room exists.
- Schools are D-rated, which usually means shorter tenancies and higher turnover. Who's the typical renter profile here, and what's been the actual vacancy rate?
- The area grade is low — what's the realistic commute time and amenity access for the typical tenant pool here? Any planned neighborhood developments (good or bad) we should know about?
- What's the average days-on-market for RENTAL listings here right now (not sales)? A rising rental-DOM trend means longer vacancies and softer asking-rent achievability than the comps imply.
- What's the recent tenant-quality profile in this submarket — average credit score on applications, eviction rate, late-payment / NSF rate, and stable-employment percentage? A property-management company in the area should have these aggregated.
- How much new for-sale + rental construction is in the pipeline within 1–3 miles? Heavy new supply typically softens prices + rents 12–24 months out; constrained supply supports both.
Investment metrics
- 1% rule
- 0.52% ✗
- Cap rate
- 3.01%
- Cash-on-cash
- -11.74%
- DSCR
- 0.48
- GRM
- 16.0
CMA / ARV
- ARV (median comp)
- $389,573
- List price
- $264,900
- Delta
- -32.00%
- Verdict
- UNDERPRICED
- Comps
- 1 within 2.0 mi
Projected returns pro-forma
6.06% appreciation · 3.0% rent growth · sell at horizon
- IRR
- 6.1%
- Equity multiple
- 1.42×
- Total profit
- $31,223
- Equity at exit
- $167,519
- IRR
- 8.3%
- Equity multiple
- 2.72×
- Total profit
- $127,786
- Equity at exit
- $304,648
Cash invested: $74,172 (down + closing). Projections, not guarantees.
Landlord ↔ Tenant lean methodology
- Overall (STATE)
- 87 Strongly Landlord-Friendly
- State Texas
- 87 Strongly Landlord-Friendly · R+5
- County
- — inherits STATE
- City
- — inherits STATE
ZIP-level market 75652
- Home prices YoY
- 1.8%
- Active inventory
- 113
- Price-to-rent
- 16.0×
Monthly cashflow live
- Estimated rent
- $1,377 medium interval (Pro) →
- Mortgage (P&I)
- −$1,389
- Tax from tax record
- −$314 /mo · $3,764/yr
- Insurance
- −$110
- HOA
- −$0
- Vacancy / Maint / Mgmt
- −$289
- Net cashflow
- $-725
Break-even live
UW: 25.0% down · 7.5% · 30yr · 1.5% tax · 5.0% vac · 8.0% maint · 8.0% mgmt
Financing live
Cash to close
- Down payment
- $66,225
- Closing costs
- $7,947
- Reserves months
- —
- Total cash needed
- —
Loan-product check · same deal, 3 products live
Conventional
25% down · 7.5% · 30yr
- Down + closing
- —
- Monthly P&I
- —
- Monthly cashflow
- —
- DSCR
- —
- Eligible?
- —
Personal DTI + credit; lowest rate.
DSCR
20% down · 8.5% · 30yr
- Down + closing
- —
- Monthly P&I
- —
- Monthly cashflow
- —
- DSCR
- —
- Eligible?
- —
No personal income docs; deal must DSCR.
Hard money
10% down · 12.0% · 12mo
- Down + closing
- —
- Monthly P&I
- —
- Monthly cashflow
- —
- DSCR
- —
- Eligible?
- —
Short-term bridge; refi at stabilization.
Listing history 20 events
-
2026-06-19days on market $264,900 Active 65 DOM
-
2026-06-18days on market $264,900 Active 64 DOM
-
2026-06-17days on market $264,900 Active 63 DOM
-
2026-06-16days on market $264,900 Active 62 DOM
-
2026-06-15days on market $264,900 Active 61 DOM
-
2026-06-14days on market $264,900 Active 59 DOM
-
2026-06-13days on market $264,900 Active 58 DOM
-
2026-06-10days on market $264,900 Active 56 DOM
-
2026-06-09days on market $264,900 Active 55 DOM
-
2026-06-08days on market $264,900 Active 54 DOM
-
2026-06-07days on market $264,900 Active 53 DOM
-
2026-06-05days on market $264,900 Active 50 DOM
-
2026-06-03days on market $264,900 Active 49 DOM
-
2026-06-02pricedays on market $264,900 Active 48 DOM
-
2026-06-01days on market $280,000 Active 47 DOM
-
2026-05-31days on market $280,000 Active 46 DOM
-
2026-05-30days on market $280,000 Active 45 DOM
-
2026-04-15$280,000 Active 1172-char remark
Show marketing remark (1172 chars)
Discover the perfect blend of space, convenience, and opportunity with this 3-bedroom, 2-bath home situated on approximately 6 acres in a highly desirable location. Ideally positioned between Kilgore and Longview, this property offers easy access to nearby amenities while still enjoying the peace of country living. Located within a great school district, this home is perfect for families seeking both comfort and convenience. With a little updating, this property has incredible potential to truly become your dream home. The solid layout and spacious setting provide the perfect foundation to add your personal touch and style. The property also features a separate building that was previously used for to-go orders, complete with essential components—offering endless possibilities for a small business, home office, or creative space to fit your needs. An oversized carport with an attached smoker adds even more potential. With a little work, this space could be transformed into the ultimate outdoor entertaining area. With acreage, versatility, and a fantastic location, this property is full of potential and ready for its next owner to make it their own.
-
2016-11-14soldstatus
-
1988-01-27soldstatus
ⓘ Source: listings_history table (triggers on properties + properties_extension) + one-shot
backfill from property_details.listing_events for pre-trigger history.
Tax reassessment forecast TX · Resets to sale price
- Current annual tax
- $3,764 · $314/mo
- Projected year-2 tax
- $4,848 · $404/mo
- Expected delta
- +$1,084/yr (+$90/mo · 28.8%)
ⓘ Screening estimate from a state-policy table — verify with the county assessor before closing.
Climate risk First Street
- Flood 1/10 Low FEMA zone X (unshaded) · 0% chance over 30 yrs
- Wildfire 6/10 Major
- Heat 7/10 Severe 7 d/yr ≥110°F today · 24 d/yr by 30 yrs out
- Wind 6/10 Major 64% chance of damaging wind over 30 yrs
- Air quality 2/10 Low 1 unhealthy d/yr today · 1 by 30 yrs out
Nearby sold comps map
Loading sold comps map…
Walkable amenities ~0.75 mi
Loading nearby amenities…
Taxation est. · year 1
- Rental income
- $16,523
- − Mortgage interest
- −$14,839
- − Property taxes
- −$3,764
- − Insurance
- −$1,324
- − Repairs & maintenance
- −$1,322
- − Management
- −$1,322
- − Depreciation
- −$7,706
- Taxable loss
- −$13,754
- Est. tax savings @ 24.0%
- +$3,301
- After-tax cash flow
- $-5,404/yr
For passive investors: Depreciation is non-cash, so a rental often shows a tax loss while cash-flowing — sheltering income. Rental losses are passive: they offset passive income freely, and up to $25,000/yr can offset ordinary (W-2) income if you actively participate and your MAGI is under $100k (phasing out to $0 by $150k); unused losses carry forward. On sale, claimed depreciation is recaptured at up to 25%, and gains may owe capital-gains tax (a 1031 exchange can defer both). Figures are a year-1 estimate at your 24.0% rate — not tax advice; consult a CPA.
Schools (NCES district)
- District
- Tatum ISD
- NCES district ID
- 4842240
- Math proficiency
- 48% ▼ -18.00%
- Reading proficiency
- 50% ▼ -7.00%
- Median HH income
- $49,958
- Composite
- 41.95/100
- National rank
- #3351
- State rank
- #194 of 826 in TX
Livability — Lake Cherokee
- Score
- 66/100
- State rank
- #650
- US rank
- #12274
Category grades
Schools grade is shown separately in the Schools card above.
Census & demographics
- Population (ZIP)
- 14,782
Population outlook (Rusk County) Hauer SSP2
- Today (2025)
- 52,498 people
- By 2030
- 52,093 · -0.8%
- By 2040
- 50,866 · -3.1%
- By 2050
- 49,696 · -5.3%
- By 2075
- 48,583 · -7.5%
- By 2100
- 43,265 · -17.6%
Race, ethnicity, and origin ACS 2023
- Neighborhood character
- Diverse neighborhood (Simpson 0.63)
- Race & ethnicity
- White 54% Hispanic / Latino 20% Black 20% Two or more races 16%
- Hispanic origin (detail)
- Mexican 17% Puerto Rican 1%
- Common ancestry
- Lithuanian 3% Slovak 2% Iranian 1%
- Foreign-born
- 7% · Canada
- Languages at home
- 85% English-only · Spanish 14%
Political lean MEDSL · Rusk
- 2024 margin
- Solid R (+59.4) · D 20.0% · R 79.4%
- 2008→2024 swing
- -13.2pp toward R · 2008: -46.3pp · 2024: -59.4pp
- All cycles
- 2024: R+59.4 2020: R+55.7 2016: R+56.5 2012: R+51.1 2008: R+46.3
Not yet ingested
- Civics
- —
Market trends
- HPI YoY
- ▲ 6.06%
- Current HPI
- 345.63
- Rent YoY
- —
- Metro
- —
- State GDP YoY
- ▲ 3.95%
- F500 in state
- 110
Industry mix (Fortune 500 HQ in TX)
| Industry | F500 HQs | Revenue |
|---|---|---|
| Energy | 16 | $1,198B |
|
||
| Technology | 5 | $198B |
|
||
| Engineering / Construction | 4 | $72B |
|
||
| Energy Services | 3 | $60B |
|
||
| Utilities | 3 | $41B |
|
||
| Healthcare | 2 | $330B |
|
||
Price history
3 events — show timeline
- 2026-04-15 Listed $280,000 LAAR
- 2016-11-14 Sold (Public Records) — Public Records
- 1988-01-27 Sold (Public Records) — Public Records
Property tax history
+4.6%/yrLatest (2025): $3,764 · +10.0% YoY. Source: county tax records.
Cash-flow waterfall
monthlySold comps — $/sqft
last 12 mo · ≤1 miLoading sold comps…