 Duplex
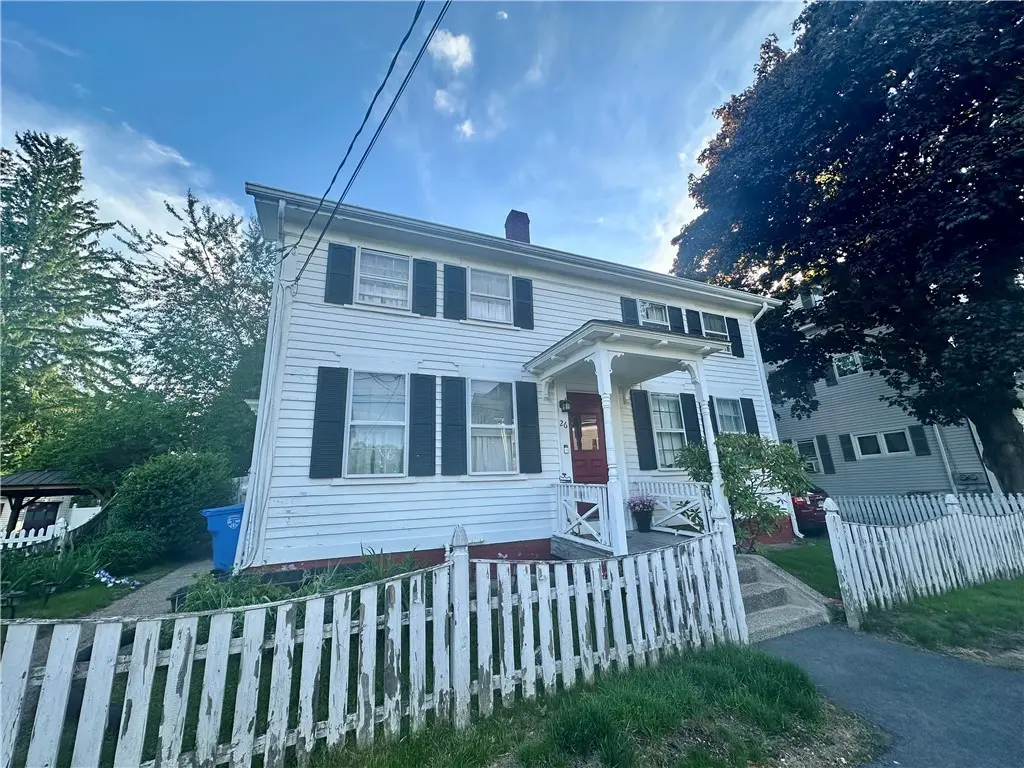
26 Pleasant St · Valley Falls, RI
Flood risk 1/10 · Minimal
- FEMA flood zone
- X (unshaded)
- Chance of flooding over 30 yrs
- 0.0%
- Est. flood insurance / yr
- $473 – $860
Fire risk 1/10 · Minimal
- Est. fire insurance / yr
- $835 – $1,551
Heat risk 5/10 · Moderate
- Hot days now (above 96°F)
- 7 days/yr
- Hot days in 30 yrs
- 15 days/yr
Wind risk 6/10 · Moderate
- Chance of severe wind over 30 yrs
- 69.0%
Air-quality risk 2/10 · Minimal
- Unhealthy air days now
- 1 days/yr
- Unhealthy air days in 30 yrs
- 2 days/yr
Risk factors via First Street. Map © Google.
Why this score? — see what drove the D- grade
The composite is a weighted blend of 9 inputs, each scored 0–100. Each bar is that input's sub-score; the figure is the points it added to the 100-point composite (weight × sub-score).
- Cash flow +11.1/30.0
- ARV discount +7.5/15.0
- Schools +3.9/10.0
- Livability +3.8/5.0
- DSCR +3.2/10.0
- 1% rule +2.8/10.0
- Rent growth +2.5/5.0
- Condition / age +2.5/5.0
- Appreciation +0.0/10.0
$410,000
🖨 Deal sheet (PDF) 📄 Offer letter ✓ Due diligence
Multi-family units
County records classify this as Multi-Family (2-4 Unit). Listing-text estimate: 2 units. confirmed
Listing remarks
Opportunity awaits with this two-family home in a highly desirable location! Conveniently located near shopping, dining, schools, and major routes, this property offers solid bones and endless potential. Ideal for investors, contractors, or owner-occupants looking to build equity, this multi-family gem is ready for your vision and creativity. Property features full basement, newer heating system, large, fenced yard for plenty of outdoor living. Property needs work and is being sold as-is. Will most likely not pass FHA financing.
Key facts
- Fenced yard
- Two-family home
- Full basement
Tags
Property features AI
Finance
- Other: Property configured as two units in one building
- HOA & community: Community amenities nearby include golf, pool, public transportation, recreation area, restaurants, shopping, and tennis courts
Exterior
- Parking: No garage; 2 total parking spaces
- Utilities: Public water (connected); Public sewer (connected); Electric service with circuit breakers
- Home design: Two-story building; Clapboard exterior
- Construction: Concrete perimeter foundation; Clapboard construction
- Exterior features: Fenced yard; Lot approximately 0.15 acres
Interior
- Kitchen: Oven; Range; Refrigerator
- Bedrooms: Total of 7 rooms including storage and utility rooms
- Flooring: Ceramic tile; Hardwood; Vinyl; Carpet
- Bathrooms: 2 full bathrooms
- Heating & cooling: Individual gas baseboard heating
- Interior features: Full, unfinished basement; Tub/shower
- Laundry & utility: Water heater (gas, rented); Gas water heater
Neighborhood map
What this means for you Summary
Snapshot
- This is a 2 × 3-bed/2.0-bath units multifamily listed at $410k.
Deal economics
- At list price, monthly cash flow is $-162 ($-2k/yr) — negative. Per door: $-81/mo.
- To cash-flow at today's rent, offer at most $381k (7.0% below list).
- To meet the 1% rule (rent ≥ 1% of price), the offer needs to be $320k (22.0% below list).
- Recommended offer: $320k (22.0% below list) — sets the bar for 1% rule.
- Cap rate 5.8% vs local median 3.3% in Valley Falls — top-decile yield for the area; either an underpriced asset or a hidden risk that comps aren't pricing in. Stress-test before assuming the spread holds.
Location & tenants
- Location reads 75/100 on livability (#8 in RI, #4,293 nationally) — a middle-class / working-renter tenant base. Strengths: crime A+, employment A+, housing A+; Watch: schools D, amenities F, commute F.
- Lincoln (suburban): math 38% / reading 48% proficiency, ranked #13 of 39 in RI (top 33%) — families likely to look elsewhere, expect single-tenant / working-renter base with shorter leases.
- Market conditions: 93 active listings in the ZIP; 14 comparable units currently listed for rent nearby; rentals leasing fast (median 13d on market — plan ~1-2 weeks tenant-placement turnaround); 776 units permitted in Providence County in 2024 (229 in 5+ unit buildings).
Forward outlook
- Local home prices are declining (-3.0%/yr); year-one equity from $3k of loan paydown is wiped out by about $12k of value loss. Plan a longer hold.
- Providence County population projected at +5% by 2050 — modest demand growth; plan on rents tracking national, not racing it.
Negotiation context
- It's been on market 16 days — a 2% lower offer ($404k) is reasonable based on typical stale-listing flexibility.
Risks & watch-outs
- Watch-outs: built in 1890 — expect roof / HVAC / electrical / plumbing capex.
- Climate carrying-cost: major wind risk, 69% chance of damaging wind over 30y; extreme-heat days projected 7→15/yr by 2055 (HVAC capex compounding) — expect insurance premiums to compound above CPI over the hold.
Questions for the listing agent
- What do current leases actually rent for vs. the listed asking? Can we see a recent rent roll and the last 12 months of T-12 income?
- Can we see the unit-by-unit rent roll, current vacancy, and any below-market leases? What's the average tenancy length?
- What capital expenditures (roof, boiler, parking lot, exteriors) have been made in the last 5 years, and what's planned in the next 2?
- Built in 1890 — when were the roof, HVAC, electrical panel, plumbing, and water heater last replaced?
- Is there a deadline driving the sale (1031 exchange, divorce, estate, relocation)? That informs how much negotiation room exists.
- Schools are D-rated, which usually means shorter tenancies and higher turnover. Who's the typical renter profile here, and what's been the actual vacancy rate?
- The area grade is low — what's the realistic commute time and amenity access for the typical tenant pool here? Any planned neighborhood developments (good or bad) we should know about?
- What's the average days-on-market for RENTAL listings here right now (not sales)? A rising rental-DOM trend means longer vacancies and softer asking-rent achievability than the comps imply.
- What's the recent tenant-quality profile in this submarket — average credit score on applications, eviction rate, late-payment / NSF rate, and stable-employment percentage? A property-management company in the area should have these aggregated.
- How much new apartment / multifamily construction is in the pipeline within 1–3 miles? Heavy new supply (>2% of stock underway) typically softens rents 12–24 months out; light construction supports rent growth.
Investment metrics
- 1% rule
- 0.78% ✗
- Cap rate
- 5.82%
- Cash-on-cash
- -1.69%
- DSCR
- 0.92
- GRM
- 10.7
CMA / ARV
No comps found within radius.
Projected returns pro-forma
-3.0% appreciation · 3.0% rent growth · sell at horizon
- IRR
- -19.1%
- Equity multiple
- 0.33×
- Total profit
- $-76,769
- Equity at exit
- $61,132
- IRR
- -11.7%
- Equity multiple
- 0.30×
- Total profit
- $-80,264
- Equity at exit
- $35,449
Cash invested: $114,800 (down + closing). Projections, not guarantees.
Landlord ↔ Tenant lean methodology
- Overall (STATE)
- 31 Tenant-Leaning
- State Rhode Island
- 31 Tenant-Leaning · D+8
- County
- — inherits STATE
- City
- — inherits STATE
ZIP-level market 02865
- Active inventory
- 93
- Price-to-rent
- 21.4×
Monthly cashflow live
- Estimated rent
- $3,200 medium interval (Pro) →
- Mortgage (P&I)
- −$2,150
- Tax from tax record
- −$369 /mo · $4,424/yr
- Insurance
- −$171
- HOA
- −$0
- Vacancy / Maint / Mgmt
- −$672
- Net cashflow
- $-162
Break-even live
Sensitivity live
| Price | -10% $71 | -5% $-46 | +0% $-162 | +5% $-278 | +10% $-394 |
|---|---|---|---|---|---|
| Rent | -10% $-414 | -5% $-288 | +0% $-162 | +5% $-35 | +10% $91 |
| Rate | -1.0pp $45 | -0.5pp $-57 | base $-162 | +0.5pp $-268 | +1.0pp $-376 |
2-unit breakdown (identical units grouped — click to expand)
| Units | Beds | Baths | Est. rent |
|---|---|---|---|
| 2× units | 3 | 2 | $3,200 |
| #1 | 3 | 2 | $1,600 |
| #2 | 3 | 2 | $1,600 |
| Total (2 units) | $3,200 | ||
UW: 25.0% down · 7.5% · 30yr · 1.5% tax · 5.0% vac · 8.0% maint · 8.0% mgmt
Financing live
Cash to close
- Down payment
- $102,500
- Closing costs
- $12,300
- Reserves months
- —
- Total cash needed
- —
Loan-product check · same deal, 3 products live
Conventional
25% down · 7.5% · 30yr
- Down + closing
- —
- Monthly P&I
- —
- Monthly cashflow
- —
- DSCR
- —
- Eligible?
- —
Personal DTI + credit; lowest rate.
DSCR
20% down · 8.5% · 30yr
- Down + closing
- —
- Monthly P&I
- —
- Monthly cashflow
- —
- DSCR
- —
- Eligible?
- —
No personal income docs; deal must DSCR.
Hard money
10% down · 12.0% · 12mo
- Down + closing
- —
- Monthly P&I
- —
- Monthly cashflow
- —
- DSCR
- —
- Eligible?
- —
Short-term bridge; refi at stabilization.
Rent comps 14 comps
| Address | Beds | Baths | Sqft | Rent | $/sqft | DOM | Units | Dist |
|---|---|---|---|---|---|---|---|---|
| 105 Arnold St Unit 1 Lincoln, RI | 2.0 | 1.0 | 900 | $1,900 | $2.11 | 44d | 1 | 0.09mi |
| 88 Pleasant St Unit 2 Lincoln, RI | 2.0 | 1.0 | 912 | $2,050 | $2.25 | 44d | 1 | 0.11mi |
| 495 Broad St Unit 2 Cumberland, RI | 3.0 | 1.0 | 1000 | $1,850 | $1.85 | 44d | 1 | 0.89mi |
| 16 Binford St Unit 1 Central Falls, RI | 3.0 | 1.0 | 1134 | $2,200 | $1.94 | 4d | 1 | 0.90mi |
| 96 Shawmut Ave Unit 98 Central Falls, RI | 4.0 | 1.5 | 1398 | $2,700 | $1.93 | 20d | 1 | 1.06mi |
| 134 Dexter St Unit 2 Cumberland, RI | 3.0 | 1.0 | 1200 | $2,500 | $2.08 | 44d | 1 | 1.13mi |
| 40 E Barrows St Unit 2 Cumberland, RI | 2.0 | 1.0 | 1150 | $1,950 | $1.70 | 15d | 1 | 1.17mi |
| 40 E Barrows St Unit 3 Cumberland, RI | 2.0 | 1.0 | 1150 | $1,750 | $1.52 | 12d | 1 | 1.17mi |
| 129 Mill St #1 Cumberland, RI | 2.0 | 1.5 | 1040 | $2,500 | $2.40 | 2d | 1 | 1.35mi |
| 14 Carpenter St Unit 1 Cumberland, RI | 4.0 | 1.0 | 1467 | $2,850 | $1.94 | 2d | 1 | 1.38mi |
| 14 Courtland St Unit 3 Central Falls, RI | 4.0 | 1.0 | 1240 | $1,950 | $1.57 | 11d | 1 | 1.42mi |
| 14 Courtland St Unit 2 Central Falls, RI | 3.0 | 1.0 | 1240 | $1,850 | $1.49 | 11d | 1 | 1.42mi |
| 664 Dexter St Unit 8 Central Falls, RI | 2.0 | 1.0 | 900 | $1,500 | $1.67 | 2d | 1 | 1.47mi |
| 244 Williams St Cumberland, RI | 4.0 | 2.0 | 1550 | $3,000 | $1.94 | 12d | 1 | 1.50mi |
Listing history 11 events
-
2026-06-13statusdays on market $410,000 Pending 16 DOM
-
2026-06-09days on market $410,000 Active 13 DOM
-
2026-06-08days on market $410,000 Active 12 DOM
-
2026-06-07days on market $410,000 Active 11 DOM
-
2026-06-05days on market $410,000 Active 8 DOM
-
2026-06-03days on market $410,000 Active 7 DOM
-
2026-06-02days on market $410,000 Active 6 DOM
-
2026-06-02remarks 534-char remark
-
2026-06-01days on market $410,000 Active 5 DOM
-
2026-05-31days on market $410,000 Active 4 DOM
-
2026-05-27$410,000 Active
ⓘ Source: listings_history table (triggers on properties + properties_extension) + one-shot
backfill from property_details.listing_events for pre-trigger history.
Tax reassessment forecast RI · Partial reset (capped growth)
- Current annual tax
- $4,424 · $369/mo
- Projected year-2 tax
- $5,554 · $463/mo
- Expected delta
- +$1,130/yr (+$94/mo · 25.5%)
ⓘ Screening estimate from a state-policy table — verify with the county assessor before closing.
Climate risk First Street
- Flood 1/10 Low FEMA zone X (unshaded) · 0% chance over 30 yrs
- Wildfire 1/10 Low
- Heat 5/10 Major 7 d/yr ≥96°F today · 15 d/yr by 30 yrs out
- Wind 6/10 Major 69% chance of damaging wind over 30 yrs
- Air quality 2/10 Low 1 unhealthy d/yr today · 2 by 30 yrs out
Nearby sold comps map
Loading sold comps map…
Walkable amenities ~0.75 mi
Loading nearby amenities…
Taxation est. · year 1
- Rental income
- $38,400
- − Mortgage interest
- −$22,966
- − Property taxes
- −$4,424
- − Insurance
- −$2,050
- − Repairs & maintenance
- −$3,072
- − Management
- −$3,072
- − Depreciation
- −$11,927
- Taxable loss
- −$9,112
- Est. tax savings @ 24.0%
- +$2,187
- After-tax cash flow
- $248/yr
For passive investors: Depreciation is non-cash, so a rental often shows a tax loss while cash-flowing — sheltering income. Rental losses are passive: they offset passive income freely, and up to $25,000/yr can offset ordinary (W-2) income if you actively participate and your MAGI is under $100k (phasing out to $0 by $150k); unused losses carry forward. On sale, claimed depreciation is recaptured at up to 25%, and gains may owe capital-gains tax (a 1031 exchange can defer both). Figures are a year-1 estimate at your 24.0% rate — not tax advice; consult a CPA.
Schools (NCES district)
- District
- Lincoln
- NCES district ID
- 4400570
- Math proficiency
- 38% ▼ -8.00%
- Reading proficiency
- 48% ▼ -2.00%
- Median HH income
- $69,500
- Composite
- 38.81/100
- National rank
- #4115
- State rank
- #13 of 39 in RI
Livability — Valley Falls
- Score
- 75/100
- State rank
- #8
- US rank
- #4293
Category grades
Schools grade is shown separately in the Schools card above.
Census & demographics
- Population (ZIP)
- 18,033
Population outlook (Providence County) Hauer SSP2
- Today (2025)
- 653,469 people
- By 2030
- 660,819 · +1.1%
- By 2040
- 672,747 · +3.0%
- By 2050
- 683,741 · +4.6%
- By 2075
- 720,435 · +10.2%
- By 2100
- 741,582 · +13.5%
Race, ethnicity, and origin ACS 2023
- Neighborhood character
- Predominantly White (82%)
- Race & ethnicity
- White 82% Two or more races 9% Hispanic / Latino 6% Asian 5%
- Hispanic origin (detail)
- Mexican 2%
- Common ancestry
- Lithuanian 11% Russian 7% Romanian 4%
- Foreign-born
- 11% · Canada, China, Jamaica
- Languages at home
- 84% English-only · Other Indo-European 7% Spanish 3% Chinese 2%
Political lean MEDSL · Providence
- 2024 margin
- D (+14.4) · D 56.1% · R 41.7% · Other 2.2%
- 2008→2024 swing
- -20.0pp toward R · 2008: 34.4pp · 2024: 14.4pp
- All cycles
- 2024: D+14.4 2020: D+22.9 2016: D+21.2 2012: D+34.9 2008: D+34.4
Not yet ingested
- Civics
- —
Market trends
- HPI YoY
- ▼ -332.01%
- Current HPI
- 325.7543
- Rent YoY
- —
- Metro
- —
- State GDP YoY
- ▲ 2.25%
- F500 in state
- 10
Industry mix (Fortune 500 HQ in RI)
| Industry | F500 HQs | Revenue |
|---|---|---|
| Healthcare | 1 | $373B |
|
||
| Food Distribution | 1 | $31B |
|
||
| Aerospace / Defense | 1 | $14B |
|
||
| Financial Services | 1 | $8B |
|
||
| Consumer Goods | 1 | $4B |
|
||
Price history
1 event — show timeline
- 2026-05-27 Listed $410,000 RIS
Property tax history
+3.3%/yrLatest (2025): $4,424 · +2.1% YoY. Source: county tax records.
Cash-flow waterfall
monthlySold comps — $/sqft
last 12 mo · ≤1 miLoading sold comps…