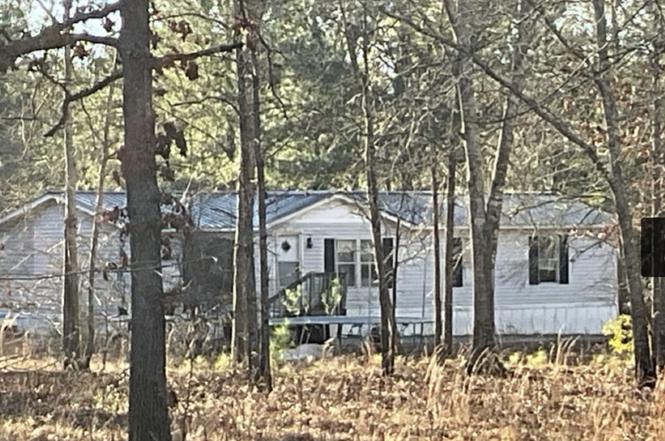
187 Osprey Rd · Empire, GA
Flood risk 1/10 · Minimal
- FEMA flood zone
- X (unshaded)
- Chance of flooding over 30 yrs
- 0.0%
- Est. flood insurance / yr
- $507 – $1,088
Fire risk 6/10 · Moderate
- Est. fire insurance / yr
- $963 – $1,789
Heat risk 7/10 · Major
- Hot days now (above 109°F)
- 7 days/yr
- Hot days in 30 yrs
- 18 days/yr
Wind risk 8/10 · Major
- Chance of severe wind over 30 yrs
- 80.0%
Air-quality risk 2/10 · Minimal
- Unhealthy air days now
- 1 days/yr
- Unhealthy air days in 30 yrs
- 1 days/yr
Risk factors via First Street. Map © Google.
Why this score? — see what drove the C- grade
The composite is a weighted blend of 9 inputs, each scored 0–100. Each bar is that input's sub-score; the figure is the points it added to the 100-point composite (weight × sub-score).
- Cash flow +19.8/30.0
- Appreciation +10.0/10.0
- DSCR +6.3/10.0
- 1% rule +4.0/10.0
- Schools +3.8/10.0
- Livability +3.1/5.0
- Rent growth +2.5/5.0
- Condition / age +2.5/5.0
- ARV discount +0.0/15.0
$150,000
🖨 Deal sheet (PDF) 📄 Offer letter ✓ Due diligence
Listing remarks MLS
This beautiful home in Bleckley County is nestled on 4 partially wooded acres in a quiet neighborhood. Home features 4 bedrooms, 2 bathrooms, dining room, living room, kitchen, laundry, and split floor plan with large master suite. Spacious closets throughout. Easy access to Highway 23 allows for time-saving when traveling or commuting. Great location just outside of the city limits of Cochran, close to Middle Georgia State University and convenient to Eastman, Hawkinsville, Dublin and Warner Robins. Call listing agent to schedule your showing today!
Key facts
- 4 beautiful acres
- Fully functional
- Mature trees
Tags
Property features AI
Finance
- HOA & community: No HOA
Exterior
- Parking: Off-street parking
- Utilities: Well water; Septic tank; Other utilities
- Home design: Manufactured home / Single family residence; One level; Built in 1997; Fixer condition
- Construction: Manufactured house construction; Vinyl siding exterior; Metal roof; Built in 1997
- Exterior features: Metal roof; Vinyl siding; Lot features: none
Interior
- Kitchen: Other appliances
- Bedrooms: Four bedrooms on the main level
- Flooring: Other flooring
- Bathrooms: Two full bathrooms on the main level
- Heating & cooling: Heating present (other type); Cooling present (other type)
- Interior features: Other interior features
- Laundry & utility: Other laundry features
Neighborhood map
What this means for you Summary
Snapshot
- This is a 4-bed/2.0-bath manufactured listed at $150k.
Deal economics
- At list price, monthly cash flow is $179 ($2k/yr) — positive.
- The deal already cash-flows at list — no discount required.
- To meet the 1% rule (rent ≥ 1% of price), the offer needs to be $134k (10.5% below list).
- Recommended offer: $134k (10.5% below list) — sets the bar for 1% rule.
Location & tenants
- Location reads 62/100 on livability (#316 in GA) — a middle-class / working-renter tenant base. Strengths: cost of living A+, housing A+; Watch: crime C-, amenities F, commute F.
- Bleckley County (rural): math 46% / reading 44% proficiency, ranked #28 of 174 in GA (top 16%) — families likely to look elsewhere, expect single-tenant / working-renter base with shorter leases.
- Zoned schools: Bleckley County Primary School (766 students, 71% FRL); Bleckley Middle School (math 43% / reading 48%, grade D+, #97 of 470 statewide, top 22%, 561 students, 52% FRL); Bleckley County High School (math 37% / reading 27%, grade F, #110 of 424 statewide, top 28%, 671 students, 45% FRL) — zoned schools at 56% FRL track the district average.
- Market conditions: 64 active listings in the ZIP; 109 units permitted in Bleckley County in 2024 (45 in 5+ unit buildings).
Forward outlook
- In year one you build about $16k of equity ($1k loan paydown + $15k appreciation (10.0% local appreciation)).
- Bleckley County population projected at -11% by 2050 — secular population decline; favor cash flow + early exit over multi-decade hold.
- At projected returns (10.0% appreciation + 3.0% rent growth), your $42k cash investment doubles in ~3 years — after that, you're playing with house money.
- By year 3, paydown + projected appreciation supports a ~$41k cash-out refi (75% LTV) — recoverable capital for the next deal without selling this one.
Negotiation context
- Only 6 days on market — expect competitive offers; lowballing is unlikely to land.
- 2 sale attempts with the ask held roughly flat each time — persistent listings suggest the price (not the market) is what's stuck; bring a comps-based counter.
- Current owner paid $60k; list at $150k implies a 152% gain — meaningful room to come down on a strong offer.
Risks & watch-outs
- Climate carrying-cost: severe wind risk, 80% chance of damaging wind over 30y; major wildfire risk; extreme-heat days projected 7→18/yr by 2055 (HVAC capex compounding) — expect insurance premiums to compound above CPI over the hold.
Questions for the listing agent
- Is there a deadline driving the sale (1031 exchange, divorce, estate, relocation)? That informs how much negotiation room exists.
- Schools are F-rated, which usually means shorter tenancies and higher turnover. Who's the typical renter profile here, and what's been the actual vacancy rate?
- What's the average days-on-market for RENTAL listings here right now (not sales)? A rising rental-DOM trend means longer vacancies and softer asking-rent achievability than the comps imply.
- What's the recent tenant-quality profile in this submarket — average credit score on applications, eviction rate, late-payment / NSF rate, and stable-employment percentage? A property-management company in the area should have these aggregated.
- How much new for-sale + rental construction is in the pipeline within 1–3 miles? Heavy new supply typically softens prices + rents 12–24 months out; constrained supply supports both.
Investment metrics
- 1% rule
- 0.90% ✗
- Cap rate
- 7.72%
- Cash-on-cash
- 5.11%
- DSCR
- 1.23
- GRM
- 9.3
CMA / ARV
- ARV (on-the-fly)
- $118,080
- Comps found
- 1
Show comp detail 1 sale within ~0.75 mi
| Address | Dist | Beds/Ba | Sqft | Sold | Price | $/sf | Match |
|---|---|---|---|---|---|---|---|
| 172 Old Eastman Rd | 0.47mi | 3/2.0 (-1) | 1,280 (-11%) | 3mo | $105,000 | $82 | 52 |
Match score weights: distance 35% · size 25% · config 20% · recency 20%. Top-matched comps best support the ARV.
Projected returns pro-forma
10.0% appreciation · 3.0% rent growth · sell at horizon
- IRR
- 28.0%
- Equity multiple
- 3.21×
- Total profit
- $93,000
- Equity at exit
- $135,132
- IRR
- 24.4%
- Equity multiple
- 7.30×
- Total profit
- $264,772
- Equity at exit
- $291,417
Cash invested: $42,000 (down + closing). Projections, not guarantees.
Landlord ↔ Tenant lean methodology
- Overall (STATE)
- 90 Strongly Landlord-Friendly
- State Georgia
- 90 Strongly Landlord-Friendly · R+3
- County
- — inherits STATE
- City
- — inherits STATE
ZIP-level market 31014
- Home prices YoY
- 19.6%
- Active inventory
- 64
- Price-to-rent
- 9.3×
Monthly cashflow live
- Estimated rent
- $1,343 medium interval (Pro) →
- Mortgage (P&I)
- −$787
- Tax from tax record
- −$33 /mo · $398/yr
- Insurance
- −$62
- HOA
- −$0
- Vacancy / Maint / Mgmt
- −$282
- Net cashflow
- $179
Break-even live
Sensitivity live
| Price | -10% $264 | -5% $221 | +0% $179 | +5% $136 | +10% $94 |
|---|---|---|---|---|---|
| Rent | -10% $73 | -5% $126 | +0% $179 | +5% $232 | +10% $285 |
| Rate | -1.0pp $254 | -0.5pp $217 | base $179 | +0.5pp $140 | +1.0pp $100 |
UW: 25.0% down · 7.5% · 30yr · 1.5% tax · 5.0% vac · 8.0% maint · 8.0% mgmt
Financing live
Cash to close
- Down payment
- $37,500
- Closing costs
- $4,500
- Reserves months
- —
- Total cash needed
- —
Loan-product check · same deal, 3 products live
Conventional
25% down · 7.5% · 30yr
- Down + closing
- —
- Monthly P&I
- —
- Monthly cashflow
- —
- DSCR
- —
- Eligible?
- —
Personal DTI + credit; lowest rate.
DSCR
20% down · 8.5% · 30yr
- Down + closing
- —
- Monthly P&I
- —
- Monthly cashflow
- —
- DSCR
- —
- Eligible?
- —
No personal income docs; deal must DSCR.
Hard money
10% down · 12.0% · 12mo
- Down + closing
- —
- Monthly P&I
- —
- Monthly cashflow
- —
- DSCR
- —
- Eligible?
- —
Short-term bridge; refi at stabilization.
Listing history 7 events
-
2026-06-17status $150,000 Under Contract 6 DOM
-
2026-06-17days on market $150,000 New 6 DOM
-
2026-06-16days on market $150,000 New 5 DOM
-
2026-06-15days on market $150,000 New 4 DOM
-
2026-06-14days on market $150,000 New 2 DOM
-
2026-06-13remarks 699-char remark
-
2026-06-13$150,000 New 1 DOM
ⓘ Source: listings_history table (triggers on properties + properties_extension) + one-shot
backfill from property_details.listing_events for pre-trigger history.
Tax reassessment forecast GA · Resets to sale price
- Current annual tax
- $398 · $33/mo
- Projected year-2 tax
- $1,380 · $115/mo
- Expected delta
- +$982/yr (+$82/mo · 247.0%)
ⓘ Screening estimate from a state-policy table — verify with the county assessor before closing.
Climate risk First Street
- Flood 1/10 Low FEMA zone X (unshaded) · 0% chance over 30 yrs
- Wildfire 6/10 Major
- Heat 7/10 Severe 7 d/yr ≥109°F today · 18 d/yr by 30 yrs out
- Wind 8/10 Severe 80% chance of damaging wind over 30 yrs
- Air quality 2/10 Low 1 unhealthy d/yr today · 1 by 30 yrs out
Nearby sold comps map
Loading sold comps map…
Walkable amenities ~0.75 mi
Loading nearby amenities…
Taxation est. · year 1
- Rental income
- $16,116
- − Mortgage interest
- −$8,402
- − Property taxes
- −$398
- − Insurance
- −$750
- − Repairs & maintenance
- −$1,289
- − Management
- −$1,289
- − Depreciation
- −$4,364
- Taxable loss
- −$376
- Est. tax savings @ 24.0%
- +$90
- After-tax cash flow
- $2,235/yr
For passive investors: Depreciation is non-cash, so a rental often shows a tax loss while cash-flowing — sheltering income. Rental losses are passive: they offset passive income freely, and up to $25,000/yr can offset ordinary (W-2) income if you actively participate and your MAGI is under $100k (phasing out to $0 by $150k); unused losses carry forward. On sale, claimed depreciation is recaptured at up to 25%, and gains may owe capital-gains tax (a 1031 exchange can defer both). Figures are a year-1 estimate at your 24.0% rate — not tax advice; consult a CPA.
Schools (NCES district)
- District
- Bleckley County
- NCES district ID
- 1300440
- Math proficiency
- 46% ▼ -11.00%
- Reading proficiency
- 44% ▼ -5.00%
- Median HH income
- $38,695
- Composite
- 37.57/100
- National rank
- #4387
- State rank
- #28 of 174 in GA
Livability — Empire
- Score
- 62/100
- State rank
- #316
- US rank
- #17041
Category grades
Schools grade is shown separately in the Schools card above.
Census & demographics
- Population (ZIP)
- 12,944
Population outlook (Bleckley County) Hauer SSP2
- Today (2025)
- 13,189 people
- By 2030
- 12,901 · -2.2%
- By 2040
- 12,398 · -6.0%
- By 2050
- 11,741 · -11.0%
- By 2075
- 10,444 · -20.8%
- By 2100
- 9,000 · -31.8%
Race, ethnicity, and origin ACS 2023
- Neighborhood character
- Majority White (62%)
- Race & ethnicity
- White 62% Black 33% Hispanic / Latino 3% Two or more races 2%
- Common ancestry
- Slovak 1% Italian 1%
- Foreign-born
- 1% · Canada, China
- Languages at home
- 98% English-only · Spanish 1%
Political lean MEDSL · Bleckley
- 2024 margin
- Solid R (+55.4) · D 22.1% · R 77.5%
- 2008→2024 swing
- -10.5pp toward R · 2008: -44.9pp · 2024: -55.4pp
- All cycles
- 2024: R+55.4 2020: R+52.9 2016: R+53.2 2012: R+47.3 2008: R+44.9
Not yet ingested
- Civics
- —
Market trends
- HPI YoY
- ▲ 38.18%
- Current HPI
- 232.753
- Rent YoY
- —
- Metro
- —
- State GDP YoY
- ▲ 2.66%
- F500 in state
- 28
Industry mix (Fortune 500 HQ in GA)
| Industry | F500 HQs | Revenue |
|---|---|---|
| Paper / Packaging | 2 | $29B |
|
||
| Retail | 1 | $160B |
|
||
| Transportation / Logistics | 1 | $91B |
|
||
| Airlines | 1 | $62B |
|
||
| Consumer Goods | 1 | $47B |
|
||
| Utilities | 1 | $25B |
|
||
Price history
+152.1% since first listed5 events — show timeline
- 2026-06-11 Listed $150,000 GAMLS
- 2025-11-25 Listing Removed — GAMLS
- 2025-11-04 Listed $150,000 GAMLS
- 2019-06-03 Sold (Public Records) $59,500 Public Records
- 2019-05-31 Sold (MLS) $59,500 GAMLS
Property tax history
+5.0%/yrLatest (2025): $398 · +0.0% YoY. Source: county tax records.
Cash-flow waterfall
monthlySold comps — $/sqft
last 12 mo · ≤1 miLoading sold comps…