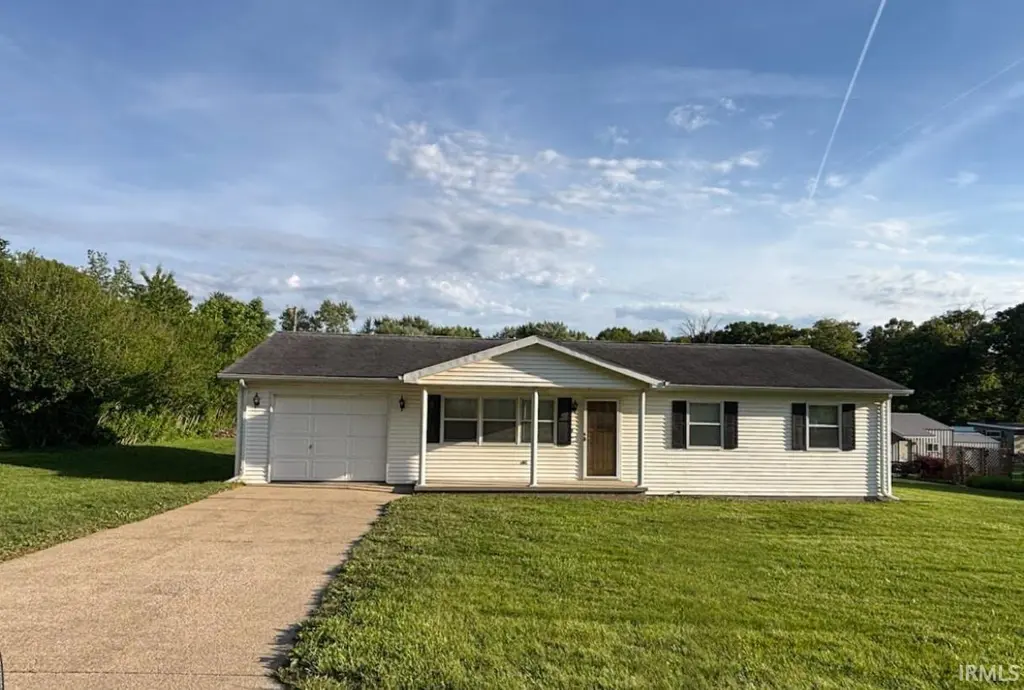
16 Kelly Dr · Washington, IN
Flood risk 1/10 · Minimal
- FEMA flood zone
- —
- Chance of flooding over 30 yrs
- 0.0%
- Est. flood insurance / yr
- —
Fire risk 2/10 · Minimal
- Est. fire insurance / yr
- $717 – $1,331
Heat risk 5/10 · Moderate
- Hot days now (above 106°F)
- 7 days/yr
- Hot days in 30 yrs
- 19 days/yr
Wind risk 2/10 · Minimal
- Chance of severe wind over 30 yrs
- 2.0%
Air-quality risk 2/10 · Minimal
- Unhealthy air days now
- 1 days/yr
- Unhealthy air days in 30 yrs
- 3 days/yr
Risk factors via First Street. Map © Google.
Why this score? — see what drove the F grade
The composite is a weighted blend of 9 inputs, each scored 0–100. Each bar is that input's sub-score; the figure is the points it added to the 100-point composite (weight × sub-score).
- Cash flow +12.9/30.0
- DSCR +3.9/10.0
- 1% rule +3.7/10.0
- Livability +3.6/5.0
- Schools +3.2/10.0
- Rent growth +2.5/5.0
- Condition / age +2.5/5.0
- ARV discount +0.0/15.0
- Appreciation +0.0/10.0
$169,900
🖨 Deal sheet 📄 Offer letter ✓ Due diligence
Listing remarks
This charming ranch-style home offers a welcoming covered front porch perfect for relaxing evenings. Inside, you’ll find 3 bedrooms, a spacious living room, kitchen, and 1 full bath. Step outside to enjoy the back patio area, ideal for entertaining or enjoying the outdoors. The property also features a 1 car detached garage with an additional storage room, providing plenty of space for tools, hobbies, or extra storage needs.
Key facts
- Covered front porch
- Back patio area
- Detached garage
Tags
Property features AI
Finance
- Other: Lot approximately 0.38 acres (dimensions 115 x 145)
Exterior
- Parking: Attached garage with garage door opener (1 car); Concrete driveway
- Utilities: Public water; Public sewer
- Home design: Single-family residence; Site-built home; One story
- Construction: Vinyl siding; Shingle roof; Built on crawl space
- Exterior features: Covered porch; Patio
Interior
- Kitchen: Refrigerator; Electric range
- Bedrooms: 5 total rooms (includes bedrooms and living areas)
- Flooring: Carpet; Vinyl
- Bathrooms: 1 full bathroom (main level)
- Heating & cooling: Electric heating; Central air; Ceiling fan(s)
- Interior features: Ceiling fan(s); Eat-in kitchen
- Laundry & utility: Washer; Dryer; Laundry on main level; Crawl space basement
Neighborhood map
What this means for you Summary
Snapshot
- This is a 3-bed/1.0-bath single-family listed at $170k.
Deal economics
- At list price, monthly cash flow is $-12 ($-139/yr) — negative.
- To cash-flow at today's rent, offer at most $168k (1.2% below list).
- To meet the 1% rule (rent ≥ 1% of price), the offer needs to be $148k (12.9% below list).
- Recommended offer: $148k (12.9% below list) — sets the bar for 1% rule.
- Cap rate 6.2% vs local median 4.9% in Washington — meaningfully above typical; check what's discounted (condition, days-on-market, listing class) to confirm the premium yield is real.
Location & tenants
- Location reads 72/100 on livability (#110 in IN) — a middle-class / working-renter tenant base. Strengths: cost of living A+, housing A+, health & safety A+; Watch: amenities F, commute F, employment F.
- Washington Community Schools (town): math 36% / reading 38% proficiency, ranked #174 of 301 in IN (top 58%) — families likely to look elsewhere, expect single-tenant / working-renter base with shorter leases.
- Zoned schools: Washington Upper Elementary (math 44% / reading 43%, grade D, #90 of 330 statewide, top 27%, 361 students, 62% FRL); Washington High School (math 27% / reading 57%, grade F, #197 of 369 statewide, top 57%, 780 students, 58% FRL) — zoned schools at 60% FRL track the district average.
- Market conditions: 112 active listings in the ZIP; 3 comparable units currently listed for rent nearby; rentals lingering (median 44d on market — plan ~5-8 weeks vacancy on turnover, expect pricing pressure); 100% of comp listings sitting > 30 days — soft ceiling on asking rent; 71 units permitted in Daviess County in 2024 (0 in 5+ unit buildings).
Forward outlook
- Local home prices are declining (-3.0%/yr); year-one equity from $1k of loan paydown is wiped out by about $5k of value loss. Plan a longer hold.
- Daviess County population projected at +6% by 2050 — modest demand growth; plan on rents tracking national, not racing it.
Negotiation context
- It's been on market 17 days — a 2% lower offer ($167k) is reasonable based on typical stale-listing flexibility.
- Current owner paid $110k; list at $170k implies a 54% gain — meaningful room to come down on a strong offer.
Risks & watch-outs
- Climate carrying-cost: extreme-heat days projected 7→19/yr by 2055 (HVAC capex compounding) — expect insurance premiums to compound above CPI over the hold.
Questions for the listing agent
- What do current leases actually rent for vs. the listed asking? Can we see a recent rent roll and the last 12 months of T-12 income?
- Is there a deadline driving the sale (1031 exchange, divorce, estate, relocation)? That informs how much negotiation room exists.
- The area grade is low — what's the realistic commute time and amenity access for the typical tenant pool here? Any planned neighborhood developments (good or bad) we should know about?
- What's the average days-on-market for RENTAL listings here right now (not sales)? A rising rental-DOM trend means longer vacancies and softer asking-rent achievability than the comps imply.
- What's the recent tenant-quality profile in this submarket — average credit score on applications, eviction rate, late-payment / NSF rate, and stable-employment percentage? A property-management company in the area should have these aggregated.
- How much new for-sale + rental construction is in the pipeline within 1–3 miles? Heavy new supply typically softens prices + rents 12–24 months out; constrained supply supports both.
Investment metrics
- 1% rule
- 0.87% ✗
- Cap rate
- 6.21%
- Cash-on-cash
- -0.29%
- DSCR
- 0.99
- GRM
- 9.6
CMA / ARV
- ARV (on-the-fly)
- $138,880
- Comps found
- 10
Show comp detail 10 sales within ~0.75 mi
| Address | Dist | Beds/Ba | Sqft | Sold | Price | $/sf | Match |
|---|---|---|---|---|---|---|---|
| 16 Kelly Dr | 0.00mi | 3/1.0 | 1,120 (0%) | 0mo | $145,000 | $129 | 100 |
| 820 S State Rd 57 | 0.37mi | 2/1.0 (-1) | 1,080 (-4%) | 0mo | $105,000 | $97 | 72 |
| 11 Kelly Dr | 0.07mi | 3/2.0 | 1,220 (+9%) | 21mo | $170,000 | $139 | 60 |
| 822 SE 1st St | 0.52mi | 2/1.0 (-1) | 1,111 (-1%) | 16mo | $90,000 | $81 | 56 |
| 705 SW 1st St | 0.69mi | 2/2.0 (-1) | 1,116 (-0%) | 5mo | $170,000 | $152 | 54 |
| 804 S Meridian St | 0.60mi | 2/1.0 (-1) | 1,154 (+3%) | 12mo | $139,800 | $121 | 52 |
| 809 S State Road 57 | 0.52mi | 3/1.0 | 1,186 (+6%) | 19mo | $147,000 | $124 | 50 |
| 180 E 150 S | 0.58mi | 2/1.0 (-1) | 1,036 (-8%) | 7mo | $70,000 | $68 | 50 |
| 317 SE 7th St | 0.73mi | 2/1.0 (-1) | 1,051 (-6%) | 2mo | $162,500 | $155 | 49 |
| 319 SE 7th St | 0.72mi | 2/1.0 (-1) | 1,012 (-10%) | 23mo | $122,500 | $121 | 26 |
Match score weights: distance 35% · size 25% · config 20% · recency 20%. Top-matched comps best support the ARV.
Projected returns pro-forma
-3.0% appreciation · 3.0% rent growth · sell at horizon
- IRR
- -16.8%
- Equity multiple
- 0.41×
- Total profit
- $-28,244
- Equity at exit
- $25,333
- IRR
- -8.6%
- Equity multiple
- 0.47×
- Total profit
- $-25,440
- Equity at exit
- $14,690
Cash invested: $47,572 (down + closing). Projections, not guarantees.
Landlord ↔ Tenant lean methodology
- Overall (STATE)
- 90 Strongly Landlord-Friendly
- State Indiana
- 90 Strongly Landlord-Friendly · R+11
- County
- — inherits STATE
- City
- — inherits STATE
ZIP-level market 47501
- Home prices YoY
- -23.2%
- Active inventory
- 112
- Price-to-rent
- 9.6×
Monthly cashflow live
- Estimated rent
- $1,480 medium interval (Pro) →
- Mortgage (P&I)
- −$891
- Tax from tax record
- −$219 /mo · $2,624/yr
- Insurance
- −$71
- HOA
- −$0
- Vacancy / Maint / Mgmt
- −$311
- Net cashflow
- $-12
Break-even live
UW: 25.0% down · 7.5% · 30yr · 1.5% tax · 5.0% vac · 8.0% maint · 8.0% mgmt
Financing live
Cash to close
- Down payment
- $42,475
- Closing costs
- $5,097
- Reserves months
- —
- Total cash needed
- —
Loan-product check · same deal, 3 products live
Conventional
25% down · 7.5% · 30yr
- Down + closing
- —
- Monthly P&I
- —
- Monthly cashflow
- —
- DSCR
- —
- Eligible?
- —
Personal DTI + credit; lowest rate.
DSCR
20% down · 8.5% · 30yr
- Down + closing
- —
- Monthly P&I
- —
- Monthly cashflow
- —
- DSCR
- —
- Eligible?
- —
No personal income docs; deal must DSCR.
Hard money
10% down · 12.0% · 12mo
- Down + closing
- —
- Monthly P&I
- —
- Monthly cashflow
- —
- DSCR
- —
- Eligible?
- —
Short-term bridge; refi at stabilization.
Rent comps 3 comps
| Address | Beds | Baths | Sqft | Rent | $/sqft | DOM | Units | Dist |
|---|---|---|---|---|---|---|---|---|
| 499 S 100 E Apt 12 Washington, IN | 3.0 | 2.5 | 1500 | $1,500 | $1.00 | 43d | 1 | 1.18mi |
| 2005 E National Hwy Washington, IN | 1.0–2.0 | 1.0–1.5 | 960 | $1,250 | $1.30 | 43d | 1 | 1.20mi |
| 8 Longbranch Dr Unit NA Washington, IN | 3.0 | 2.0 | 1340 | $1,700 | $1.27 | 44d | 1 | 1.22mi |
Listing history 12 events
-
2026-06-09statusdays on market $169,900 Pending 17 DOM
-
2026-06-08days on market $169,900 Active 16 DOM
-
2026-06-07days on market $169,900 Active 15 DOM
-
2026-06-07days on market $169,900 Active 14 DOM
-
2026-06-04days on market $169,900 Active 11 DOM
-
2026-06-02days on market $169,900 Active 10 DOM
-
2026-06-01days on market $169,900 Active 9 DOM
-
2026-05-31days on market $169,900 Active 8 DOM
-
2026-05-31days on market $169,900 Active 7 DOM
-
2026-05-15status Pending
-
2026-05-08$169,900 Active
-
2025-01-30soldstatus $110,000
ⓘ Source: listings_history table (triggers on properties + properties_extension) + one-shot
backfill from property_details.listing_events for pre-trigger history.
Tax reassessment forecast IN · Partial reset (capped growth)
- Current annual tax
- $2,624 · $219/mo
- Projected year-2 tax
- $2,624 · $219/mo
- Expected delta
- $0/yr ($0/mo · 0.0%)
ⓘ Screening estimate from a state-policy table — verify with the county assessor before closing.
Climate risk First Street
- Flood 1/10 Low 0% chance over 30 yrs
- Wildfire 2/10 Low
- Heat 5/10 Major 7 d/yr ≥106°F today · 19 d/yr by 30 yrs out
- Wind 2/10 Low 2% chance of damaging wind over 30 yrs
- Air quality 2/10 Low 1 unhealthy d/yr today · 3 by 30 yrs out
Nearby sold comps map
Loading sold comps map…
Walkable amenities ~0.75 mi
Loading nearby amenities…
Taxation est. · year 1
- Rental income
- $17,754
- − Mortgage interest
- −$9,517
- − Property taxes
- −$2,624
- − Insurance
- −$850
- − Repairs & maintenance
- −$1,420
- − Management
- −$1,420
- − Depreciation
- −$4,943
- Taxable loss
- −$3,019
- Est. tax savings @ 24.0%
- +$725
- After-tax cash flow
- $585/yr
For passive investors: Depreciation is non-cash, so a rental often shows a tax loss while cash-flowing — sheltering income. Rental losses are passive: they offset passive income freely, and up to $25,000/yr can offset ordinary (W-2) income if you actively participate and your MAGI is under $100k (phasing out to $0 by $150k); unused losses carry forward. On sale, claimed depreciation is recaptured at up to 25%, and gains may owe capital-gains tax (a 1031 exchange can defer both). Figures are a year-1 estimate at your 24.0% rate — not tax advice; consult a CPA.
Schools (NCES district)
- District
- Washington Community Schools
- NCES district ID
- 1812450
- Math proficiency
- 36% ▼ -1.00%
- Reading proficiency
- 38% ▼ -3.00%
- Median HH income
- $45,422
- Composite
- 31.57/100
- National rank
- #5952
- State rank
- #174 of 301 in IN
Livability — Washington
- Score
- 72/100
- State rank
- #110
- US rank
- #5706
Category grades
Schools grade is shown separately in the Schools card above.
Census & demographics
- Census place
- Washington, IN
- City population
- 18,335
- Population (ZIP)
- 18,335
Population outlook (Daviess County) Hauer SSP2
- Today (2025)
- 33,940 people
- By 2030
- 34,457 · +1.5%
- By 2040
- 35,412 · +4.3%
- By 2050
- 35,803 · +5.5%
- By 2075
- 35,173 · +3.6%
- By 2100
- 29,799 · -12.2%
Race, ethnicity, and origin ACS 2023
- Neighborhood character
- Predominantly White (81%)
- Race & ethnicity
- White 81% Hispanic / Latino 11% Two or more races 8% Black 3%
- Hispanic origin (detail)
- Mexican 9%
- Common ancestry
- Hispanic 4% Lithuanian 2% Slovak 1%
- Foreign-born
- 7% · Canada
- Languages at home
- 89% English-only · Spanish 5% French/Haitian/Cajun 3% German/W. Germanic 1%
Political lean MEDSL · Daviess
- 2024 margin
- Solid R (+64.3) · D 17.1% · R 81.5% · Other 1.4%
- 2008→2024 swing
- -29.1pp toward R · 2008: -35.2pp · 2024: -64.3pp
- All cycles
- 2024: R+64.3 2020: R+62.0 2016: R+62.8 2012: R+50.8 2008: R+35.2
Not yet ingested
- Civics
- —
Market trends
- HPI YoY
- ▼ -64.30%
- Current HPI
- 213.3049
- Rent YoY
- —
- Metro
- —
- State GDP YoY
- ▲ 2.90%
- F500 in state
- 18
Industry mix (Fortune 500 HQ in IN)
| Industry | F500 HQs | Revenue |
|---|---|---|
| Industrial Machinery | 2 | $37B |
|
||
| Healthcare | 1 | $177B |
|
||
| Pharmaceuticals | 1 | $45B |
|
||
| Metals / Steel | 1 | $18B |
|
||
| Agriculture | 1 | $17B |
|
||
| Packaging | 1 | $12B |
|
||
Price history
+54.5% since first listed3 events — show timeline
- 2026-05-15 Pending — IRMLS
- 2026-05-08 Listed $169,900 IRMLS
- 2025-01-30 Sold (Public Records) $110,000 Public Records
Property tax history
-1.8%/yrLatest (2024): $2,624 · +3.8% YoY. Source: county tax records.
Cash-flow waterfall
monthlySold comps — $/sqft
last 12 mo · ≤1 miLoading sold comps…