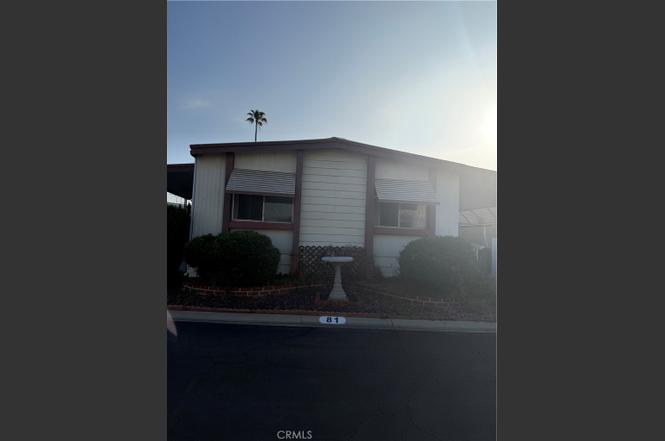
9391 California Ave #81 · Riverside, CA
Flood risk 1/10 · Minimal
- FEMA flood zone
- X (unshaded)
- Chance of flooding over 30 yrs
- 0.0%
- Est. flood insurance / yr
- $507 – $1,088
Fire risk 1/10 · Minimal
- Est. fire insurance / yr
- $659 – $1,223
Heat risk 7/10 · Major
- Hot days now (above 103°F)
- 6 days/yr
- Hot days in 30 yrs
- 16 days/yr
Wind risk 1/10 · Minimal
- Chance of severe wind over 30 yrs
- —
Air-quality risk 9/10 · Severe
- Unhealthy air days now
- 19 days/yr
- Unhealthy air days in 30 yrs
- 23 days/yr
Risk factors via First Street. Map © Google.
Why this score? — see what drove the C- grade
The composite is a weighted blend of 9 inputs, each scored 0–100. Each bar is that input's sub-score; the figure is the points it added to the 100-point composite (weight × sub-score).
- Cash flow +15.0/30.0
- ARV discount +15.0/15.0
- 1% rule +5.0/10.0
- DSCR +5.0/10.0
- Schools +4.1/10.0
- Rent growth +3.4/5.0
- Livability +3.3/5.0
- Condition / age +2.5/5.0
- Appreciation +0.0/10.0
$45,000
🖨 Deal sheet (PDF) 📄 Offer letter ✓ Due diligence
Listing remarks MLS
The home is in a 55+ senior community with a spacious floor plan. The living room opens to the kitchen. The dining area has built ins and chandelier. A built-in wet bar with a stained glass window ceiling is also a great addition! There is a walk-in closet in the master bedroom and also one additional room and bathroom. Lastly, outside there is carport covered parking and also a shed. Amenities include a clubhouse with a pool, spa, kitchen, pool tables, reading room and activities. Shopping center and grocery store are nearby.
Key facts
- Community pool
- Built 1973
- Listed 35 days
Property features AI
Finance
- Other: Lot size category: 0-1 unit/acre; Elevation units shown in feet
- Financial info: Land lease applicable
- HOA & community: Senior community; Manager approval required
Exterior
- Parking: Located in Riverside Country Club Mobile Home Park
- Utilities: Public sewer; District/public water
- Home design: Single-story home; Entry at main level; Manufactured/mobile home (approx. 12' x 51')
- Construction: Year built per public records; Mobile/manufactured construction
- Exterior features: Community pool; Sidewalks
Interior
- Kitchen: No appliances included
- Bathrooms: 2 full bathrooms
- Heating & cooling: Central cooling
- Interior features: Bar
- Laundry & utility: Washer included; Dryer included; Laundry area present
Neighborhood map
What this means for you Summary
Snapshot
- This is a 2-bed/2.0-bath manufactured listed at $45k.
Deal economics
- At list price, monthly cash flow is $2k ($19k/yr) — positive.
- The deal already cash-flows at list — no discount required.
- Meets the 1% rule at list price ($2k rent vs $45k).
- Recommended offer: $44k (3.0% below list) — sets the bar for market timing.
- Cap rate 49.0% vs local median 3.0% in Riverside — top-decile yield for the area; either an underpriced asset or a hidden risk that comps aren't pricing in. Stress-test before assuming the spread holds.
Location & tenants
- Location reads 66/100 on livability (#337 in CA) — a middle-class / working-renter tenant base. Strengths: housing A+, employment A-, commute B+; Watch: health & safety D, crime F, cost of living F.
- Riverside Unified (urban): math 36% / reading 51% proficiency, ranked #574 of 1,400 in CA (top 41%) — families likely to look elsewhere, expect single-tenant / working-renter base with shorter leases.
- Zoned schools: Jackson Elementary (math 24% / reading 24%, grade F, #973 of 1,571 statewide, top 73%, 667 students, 89% FRL); Chemawa Middle (798 students, 90% FRL); Arlington High (1,957 students, 81% FRL) — zoned schools average 87% FRL vs 53% district-wide (34 pts higher); higher-poverty schools than district average — tighter screening recommended.
- Zoned-school proficiency averages 24% at this address vs 44% district-wide (-19 pts) — the specific schools serving this property underperform the Riverside Unified average; the district grade overstates school quality for this exact location.
- Market conditions: Rents rising (+3.4%/yr); 197 active listings in the ZIP; 40 comparable units currently listed for rent nearby; rentals at typical pace (median 26d on market — plan ~3-4 weeks tenant-placement turnaround); solid renter incomes; 9,195 units permitted in Riverside County in 2024 (1,512 in 5+ unit buildings).
Forward outlook
- Local home prices are declining (-3.0%/yr); year-one equity from $311 of loan paydown is wiped out by about $1k of value loss. Plan a longer hold.
- Riverside County population projected at +22% by 2050 — long-run rental-demand tailwind backs the buy-and-hold thesis.
- At projected returns (-3.0% appreciation + 3.4% rent growth), your $13k cash investment doubles in ~1 year — after that, you're playing with house money.
Negotiation context
- It's been on market 35 days — a 3% lower offer ($44k) is reasonable based on typical stale-listing flexibility.
- 5 sale attempts since 22y ago with the ask held roughly flat each time — persistent listings suggest the price (not the market) is what's stuck; bring a comps-based counter.
- Current owner paid $35k; 29% above their basis — modest negotiation headroom, anchor on the comps not their cost.
Risks & watch-outs
- Climate carrying-cost: extreme-heat days projected 6→16/yr by 2055 (HVAC capex compounding) — expect insurance premiums to compound above CPI over the hold.
Questions for the listing agent
- It's been on market 35 days. Have you received any prior offers? Is the seller open to a 3% concession, seller financing, or rate buy-down credit?
- Built in 1973 — when were the roof, HVAC, electrical panel, plumbing, and water heater last replaced?
- Is there a deadline driving the sale (1031 exchange, divorce, estate, relocation)? That informs how much negotiation room exists.
- Crime grade is F in this area — have there been break-ins, vandalism, or insurance claims at this property in the last 3 years? What carrier currently insures it and at what premium?
- What's the average days-on-market for RENTAL listings here right now (not sales)? A rising rental-DOM trend means longer vacancies and softer asking-rent achievability than the comps imply.
- What's the recent tenant-quality profile in this submarket — average credit score on applications, eviction rate, late-payment / NSF rate, and stable-employment percentage? A property-management company in the area should have these aggregated.
- How much new for-sale + rental construction is in the pipeline within 1–3 miles? Heavy new supply typically softens prices + rents 12–24 months out; constrained supply supports both.
Investment metrics
- 1% rule
- 5.24% ✓
- Cap rate
- 48.99%
- Cash-on-cash
- 152.48%
- DSCR
- 7.78
- GRM
- 1.6
CMA / ARV
- ARV (on-the-fly)
- $77,112
- Comps found
- 7
Show comp detail 7 sales within ~0.75 mi
| Address | Dist | Beds/Ba | Sqft | Sold | Price | $/sf | Match |
|---|---|---|---|---|---|---|---|
| 9391 California Ave #13 | 0.03mi | 2/2.0 | 1,248 (+2%) | 2mo | $50,000 | $40 | 94 |
| 9391 California Ave #118 | 0.00mi | 2/2.0 | 1,248 (+2%) | 8mo | $114,900 | $92 | 90 |
| 9391 California Ave #66 | 0.00mi | 2/2.0 | 1,248 (+2%) | 11mo | $60,000 | $48 | 88 |
| 9391 California Ave #97 | 0.00mi | 3/2.0 (+1) | 1,344 (+10%) | 3mo | $85,000 | $63 | 76 |
| 9391 California Ave #22 | 0.00mi | 2/2.0 | 1,344 (+10%) | 11mo | $115,000 | $86 | 75 |
| 9391 California #77 | 0.00mi | 2/2.0 | 1,296 (+6%) | 23mo | $110,000 | $85 | 71 |
| 9391 California Ave #76 | 0.00mi | 2/2.0 | 1,344 (+10%) | 21mo | $83,000 | $62 | 66 |
Match score weights: distance 35% · size 25% · config 20% · recency 20%. Top-matched comps best support the ARV.
Projected returns pro-forma
-3.0% appreciation · 3.41% rent growth · sell at horizon
- IRR
- —
- Equity multiple
- 8.59×
- Total profit
- $95,662
- Equity at exit
- $6,710
- IRR
- —
- Equity multiple
- 18.35×
- Total profit
- $218,671
- Equity at exit
- $3,891
Cash invested: $12,600 (down + closing). Projections, not guarantees.
Landlord ↔ Tenant lean methodology
- Overall (STATE)
- 18 Strongly Tenant-Friendly
- State California
- 18 Strongly Tenant-Friendly · D+13
- County
- — inherits STATE
- City
- — inherits STATE
ZIP-level market 92503
- Rents YoY
- 3.4%
- Active inventory
- 197
- Price-to-rent
- 1.6×
Monthly cashflow live
- Estimated rent
- $2,359 high interval (Pro) →
- Mortgage (P&I)
- −$236
- Tax from tax record
- −$8 /mo · $92/yr
- Insurance
- −$19
- HOA
- −$0
- Vacancy / Maint / Mgmt
- −$495
- Net cashflow
- $1,601
Break-even live
Sensitivity live
| Price | -10% $1,627 | -5% $1,614 | +0% $1,601 | +5% $1,537 | +10% $1,521 |
|---|---|---|---|---|---|
| Rent | -10% $1,415 | -5% $1,508 | +0% $1,601 | +5% $1,694 | +10% $1,787 |
| Rate | -1.0pp $1,624 | -0.5pp $1,612 | base $1,601 | +0.5pp $1,589 | +1.0pp $1,578 |
UW: 25.0% down · 7.5% · 30yr · 1.5% tax · 5.0% vac · 8.0% maint · 8.0% mgmt
Financing live
Cash to close
- Down payment
- $11,250
- Closing costs
- $1,350
- Reserves months
- —
- Total cash needed
- —
Loan-product check · same deal, 3 products live
Conventional
25% down · 7.5% · 30yr
- Down + closing
- —
- Monthly P&I
- —
- Monthly cashflow
- —
- DSCR
- —
- Eligible?
- —
Personal DTI + credit; lowest rate.
DSCR
20% down · 8.5% · 30yr
- Down + closing
- —
- Monthly P&I
- —
- Monthly cashflow
- —
- DSCR
- —
- Eligible?
- —
No personal income docs; deal must DSCR.
Hard money
10% down · 12.0% · 12mo
- Down + closing
- —
- Monthly P&I
- —
- Monthly cashflow
- —
- DSCR
- —
- Eligible?
- —
Short-term bridge; refi at stabilization.
Rent comps 40 comps
| Address | Beds | Baths | Sqft | Rent | $/sqft | DOM | Units | Dist |
|---|---|---|---|---|---|---|---|---|
| 4119 Van Buren Blvd Unit 25 Riverside, CA | 2.0 | 1.0 | 905 | $2,025 | $2.24 | 23d | 1 | 0.23mi |
| 4119 Van Buren Blvd Riverside, CA | 2.0 | 1.0 | 905 | $2,025 | $2.24 | 26d | 2 | 0.23mi |
| 4115 Van Buren Blvd Apt 2 Riverside, CA | 2.0 | 1.0 | 905 | $2,025 | $2.24 | 45d | 1 | 0.24mi |
| 4115 Van Buren Blvd Apt 2 Riverside, CA | 2.0 | 1.0 | 905 | $1,995 | $2.20 | 22d | 1 | 0.24mi |
| 4620 Van Buren Blvd Riverside, CA | 1.0–2.0 | 1.0–2.0 | 665 | $2,495 | $3.75 | 1d | 12 | 0.33mi |
| 9400 Garfield St Riverside, CA | 2.0 | 2.0 | 940 | $2,150 | $2.29 | 25d | 1 | 0.40mi |
| 3928 Everest Ave Riverside, CA | 2.0 | 1.0 | 1324 | $2,000 | $1.51 | 26d | 1 | 0.49mi |
| 4273 Wheeler St Riverside, CA | 3.0 | 2.0 | 1000 | $2,595 | $2.60 | 4d | 1 | 0.52mi |
| 3904 Stotts St Riverside, CA | 2.0 | 2.0 | 1100 | $2,575 | $2.34 | 46d | 1 | 0.54mi |
| 4185 Selma Ave Riverside, CA | 2.0 | 1.0 | 1000 | $2,750 | $2.75 | 45d | 1 | 0.56mi |
| 3918 Jackson St Riverside, CA | 2.0 | 1.0 | 900 | $2,000 | $2.22 | 26d | 1 | 0.63mi |
| 9145 Audrey St Unit 1 Riverside, CA | 2.0 | 1.0 | 850 | $2,400 | $2.82 | 45d | 1 | 0.65mi |
| 4743 Jackson St #64 Riverside, CA | 2.0 | 1.5 | 861 | $2,095 | $2.43 | 26d | 1 | 0.72mi |
| 3750 Taft St Riverside, CA | 3.0 | 2.0 | 1288 | $2,950 | $2.29 | 0d | 1 | 0.78mi |
| 3750 Myers St Riverside, CA | 1.0–2.0 | 1.0 | 803 | $2,100 | $2.61 | 45d | 1 | 0.83mi |
| 3688 Taft St Riverside, CA | 3.0 | 2.0 | 1268 | $3,150 | $2.48 | 0d | 1 | 0.85mi |
| 4853 Jackson St Unit C Riverside, CA | 2.0 | 1.0 | 968 | $1,900 | $1.96 | 45d | 1 | 0.86mi |
| 4853 Jackson St Riverside, CA | 2.0 | 1.0 | 968 | $2,100 | $2.17 | 45d | 1 | 0.86mi |
| 3905 Dawes St Riverside, CA | 2.0 | 2.0 | 1193 | $2,555 | $2.14 | 1d | 4 | 0.87mi |
| 4859 Jackson St Riverside, CA | 3.0 | 1.5 | 1226 | $2,495 | $2.04 | 16d | 1 | 0.87mi |
| 4859 Jackson St Unit B Riverside, CA | 3.0 | 1.5 | 1226 | $2,495 | $2.04 | 23d | 1 | 0.87mi |
| 9090 Colony Pl Unit B Riverside, CA | 2.0 | 1.0 | 888 | $2,100 | $2.36 | 45d | 1 | 0.91mi |
| 3626 Jackson St Unit 3636-L Riverside, CA | 2.0 | 1.0 | 950 | $2,250 | $2.37 | 6d | 1 | 0.97mi |
| 7721 Janet Ave Unit C Riverside, CA | 2.0 | 1.0 | 900 | $1,799 | $2.00 | 26d | 1 | 0.97mi |
| 7721 Janet Ave Unit A Riverside, CA | 3.0 | 2.0 | 900 | $2,449 | $2.72 | 26d | 1 | 0.97mi |
| 4486 Santee Pl Riverside, CA | 3.0 | 2.0 | 1400 | $3,000 | $2.14 | 21d | 1 | 0.98mi |
| 5910 Warren St Unit A7 Riverside, CA | 2.0 | 1.0 | 750 | $1,950 | $2.60 | 26d | 1 | 1.03mi |
| 5910 Warren St Unit B8 Riverside, CA | 2.0 | 1.0 | 720 | $1,950 | $2.71 | 0d | 1 | 1.03mi |
| 5910 Warren St Riverside, CA | 2.0 | 1.0 | 750 | $1,950 | $2.60 | 18d | 1 | 1.03mi |
| 9535 Hannah Way Unit 30 Riverside, CA | 3.0 | 3.0 | 1465 | $3,295 | $2.25 | 18d | 1 | 1.03mi |
| 9535 Hannah Way Riverside, CA | 3.0 | 3.0 | 1465 | $3,195 | $2.18 | 1d | 1 | 1.03mi |
| 10150 Cook Ave Riverside, CA | 3.0 | 2.0 | 1469 | $3,045 | $2.07 | 7d | 1 | 1.05mi |
| 8641 Garfield St Riverside, CA | 3.0 | 2.0 | 1122 | $2,995 | $2.67 | 26d | 1 | 1.05mi |
| 8641 Garfield St Riverside, CA | 3.0 | 2.0 | 1122 | $2,995 | $2.67 | 23d | 1 | 1.05mi |
| 8715 Magnolia Ave Riverside, CA | 1.0–2.0 | 1.0–2.5 | 1150 | $2,200 | $1.91 | 45d | 4 | 1.07mi |
| 6195 Pegasus Dr Riverside, CA | 2.0 | 1.0 | 810 | $2,173 | $2.68 | 1d | 5 | 1.07mi |
| 3644 Harrison St Riverside, CA | 2.0 | 1.0–2.0 | 805 | $2,845 | $3.53 | 45d | 38 | 1.07mi |
| 3644 Harrison St Unit 104 Riverside, CA | 1.0 | 1.0 | 773 | $2,445 | $3.16 | 26d | 1 | 1.07mi |
| 9513 Hannah Way Riverside, CA | 3.0 | 3.0 | 1464 | $3,195 | $2.18 | 1d | 1 | 1.08mi |
| 9525 Hannah Way Riverside, CA | 3.0 | 3.0 | 1464 | $3,300 | $2.25 | 11d | 1 | 1.08mi |
Listing history 2 events
-
2026-06-17remarks 292-char remark
-
2026-06-17$45,000 Active 35 DOM
ⓘ Source: listings_history table (triggers on properties + properties_extension) + one-shot
backfill from property_details.listing_events for pre-trigger history.
Tax reassessment forecast CA · Resets to sale price
- Current annual tax
- $92 · $8/mo
- Projected year-2 tax
- $342 · $28/mo
- Expected delta
- +$250/yr (+$21/mo · 273.2%)
ⓘ Screening estimate from a state-policy table — verify with the county assessor before closing.
Climate risk First Street
- Flood 1/10 Low FEMA zone X (unshaded) · 0% chance over 30 yrs
- Wildfire 1/10 Low
- Heat 7/10 Severe 6 d/yr ≥103°F today · 16 d/yr by 30 yrs out
- Wind 1/10 Low
- Air quality 9/10 Extreme 19 unhealthy d/yr today · 23 by 30 yrs out
Nearby sold comps map
Loading sold comps map…
Walkable amenities ~0.75 mi
Loading nearby amenities…
Taxation est. · year 1
- Rental income
- $28,305
- − Mortgage interest
- −$2,521
- − Property taxes
- −$92
- − Insurance
- −$225
- − Repairs & maintenance
- −$2,264
- − Management
- −$2,264
- − Depreciation
- −$1,309
- Taxable income
- $19,630
- Est. tax owed @ 24.0%
- −$4,711
- After-tax cash flow
- $14,501/yr
For passive investors: Depreciation is non-cash, so a rental often shows a tax loss while cash-flowing — sheltering income. Rental losses are passive: they offset passive income freely, and up to $25,000/yr can offset ordinary (W-2) income if you actively participate and your MAGI is under $100k (phasing out to $0 by $150k); unused losses carry forward. On sale, claimed depreciation is recaptured at up to 25%, and gains may owe capital-gains tax (a 1031 exchange can defer both). Figures are a year-1 estimate at your 24.0% rate — not tax advice; consult a CPA.
Schools (NCES district)
- District
- Riverside Unified
- NCES district ID
- 0633150
- Math proficiency
- 36% ▲ 1.00%
- Reading proficiency
- 51% ▲ 2.00%
- Median HH income
- $62,038
- Composite
- 40.8/100
- National rank
- #7563
- State rank
- #574 of 1400 in CA
Livability — Riverside
- Score
- 66/100
- State rank
- #337
- US rank
- #11613
Category grades
Schools grade is shown separately in the Schools card above.
Census & demographics
- Census place
- Riverside, CA
- County
- Riverside County · 2,287,001 people
- City population
- 367,890
- Metro
- Riverside-San Bernardino-Ontario, CA
- Population (ZIP)
- 88,395
- Household income
- $96,268
- Rent vs Own
- Severe rent burden
- 2337.0
Population outlook (Riverside County) Hauer SSP2
- Today (2025)
- 2,664,475 people
- By 2030
- 2,802,692 · +5.2%
- By 2040
- 3,050,904 · +14.5%
- By 2050
- 3,256,783 · +22.2%
- By 2075
- 3,655,058 · +37.2%
- By 2100
- 3,766,594 · +41.4%
Race, ethnicity, and origin ACS 2023
- Neighborhood character
- Diverse neighborhood (Simpson 0.57)
- Race & ethnicity
- Hispanic / Latino 61% White 24% Two or more races 15% Asian 8% Black 4%
- Hispanic origin (detail)
- Mexican 52%
- Common ancestry
- Lithuanian 1% Italian 1% Slovak 1%
- Foreign-born
- 27% · Canada, Vietnam, South Korea
- Languages at home
- 44% English-only · Spanish 45% Other Indo-European 2% Tagalog/Filipino 2%
Political lean MEDSL · Riverside
- 2024 margin
- Toss-up / Even · D 48.0% · R 49.3% · Other 2.6%
- 2008→2024 swing
- -3.6pp toward R · 2008: 2.3pp · 2024: -1.3pp
- All cycles
- 2024: R+1.3 2020: D+8.0 2016: D+4.3 2012: R+0.4 2008: D+2.3
Not yet ingested
- Civics
- —
Market trends
- HPI YoY
- ▼ -414.52%
- Current HPI
- 393.407
- Rent YoY
- ▲ 3.41%
- Metro
- Riverside-San Bernardino-Ontario, CA
- State GDP YoY
- ▲ 3.21%
- F500 in state
- 116
Industry mix (Fortune 500 HQ in CA)
| Industry | F500 HQs | Revenue |
|---|---|---|
| Technology | 27 | $1,492B |
|
||
| Financial Services | 3 | $174B |
|
||
| Retail | 3 | $44B |
|
||
| Insurance | 3 | $26B |
|
||
| Media / Entertainment | 2 | $115B |
|
||
| Pharmaceuticals / Biotech | 2 | $62B |
|
||
Price history
-10.0% since first listed8 events — show timeline
- 2026-06-17 Relisted — CRMLS
- 2026-05-17 Relisted — CRMLS
- 2026-03-14 Listed $45,000 CRMLS
- 2018-12-21 Sold (MLS) $35,000 CRMLS
- 2018-11-21 Pending — CRMLS
- 2018-11-02 Listed $37,500 CRMLS
- 2004-07-14 Sold (MLS) $45,000 CRMLS
- 2004-02-10 Listed $50,000 CRMLS
Property tax history
-8.2%/yrLatest (2025): $92 · +5.2% YoY. Source: county tax records.
Cash-flow waterfall
monthlySold comps — $/sqft
last 12 mo · ≤1 miLoading sold comps…