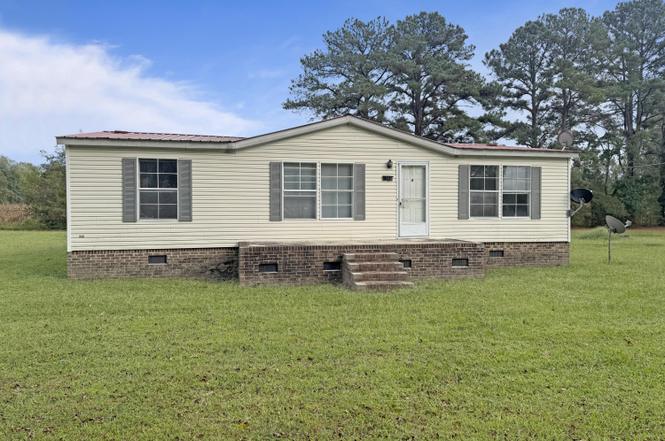
1335 Free Union Rd · Plymouth, NC
Flood risk 1/10 · Minimal
- FEMA flood zone
- X (unshaded)
- Chance of flooding over 30 yrs
- 0.0%
- Est. flood insurance / yr
- $507 – $1,088
Fire risk 5/10 · Moderate
- Est. fire insurance / yr
- $906 – $1,684
Heat risk 8/10 · Major
- Hot days now (above 108°F)
- 7 days/yr
- Hot days in 30 yrs
- 17 days/yr
Wind risk 8/10 · Major
- Chance of severe wind over 30 yrs
- 80.0%
Air-quality risk 2/10 · Minimal
- Unhealthy air days now
- 1 days/yr
- Unhealthy air days in 30 yrs
- 1 days/yr
Risk factors via First Street. Map © Google.
Why this score? — see what drove the A- grade
The composite is a weighted blend of 9 inputs, each scored 0–100. Each bar is that input's sub-score; the figure is the points it added to the 100-point composite (weight × sub-score).
- Cash flow +30.0/30.0
- ARV discount +15.0/15.0
- 1% rule +10.0/10.0
- DSCR +10.0/10.0
- Appreciation +9.7/10.0
- Livability +2.8/5.0
- Rent growth +2.5/5.0
- Condition / age +2.5/5.0
- Schools +2.4/10.0
$34,900
🖨 Deal sheet 📄 Offer letter ✓ Due diligence
Listing remarks
Great investment property featuring a 3-bedroom, 2-bathroom double-wide home on a 1-acre country lot, ready for your vision and designs. Property is being offered for sale. Please contact a local agent for details. Buyer to sign HHA for mobile home. Buyer would be responsible for retiring the title or requesting the duplicate title from the DMV once they are owners of record.
Key facts
- 1.01 acre lot
- Built 1995
- Listed 114 days
Property features AI
Exterior
- Parking: Shared driveway
- Utilities: Well water; Septic tank; Other utilities
- Home design: Manufactured home; Single-story (one level); Entry at level 1
- Construction: Vinyl siding and frame construction; Brick/mortar foundation; Composition roof; Built as a manufactured home
- Exterior features: Porch; Shed(s); Property has a view
Interior
- Kitchen: No appliances listed
- Bedrooms: 6 total rooms
- Flooring: Carpet; Vinyl
- Bathrooms: 2 full bathrooms
- Heating & cooling: Electric heating; Forced air heating; Central air conditioning
- Interior features: Ceiling fan(s); Unfurnished
- Laundry & utility: Washer hookup; Electric water heater
Neighborhood map
What this means for you Summary
Snapshot
- This is a 3-bed/2.0-bath manufactured listed at $35k.
Deal economics
- At list price, monthly cash flow is $478 ($6k/yr) — positive.
- The deal already cash-flows at list — no discount required.
- Meets the 1% rule at list price ($944 rent vs $35k).
- Recommended offer: $32k (9.0% below list) — sets the bar for market timing.
Location & tenants
- Location reads 56/100 on livability (#627 in NC) — a working-class tenant base; expect higher turnover. Strengths: cost of living A+, health & safety A+; Watch: crime F, amenities D-, commute F.
- Martin County Schools (rural): math 24% / reading 34% proficiency, ranked #150 of 178 in NC (top 84%) — low school quality limits family demand, transient renter base, plan for 1-2y turnover; 62% free/reduced lunch — lower-income household profile, screen leases tightly.
- Zoned schools: Jamesville Elementary (math 52% / reading 57%, grade C, #302 of 1,410 statewide, top 23%, 208 students, 99% FRL) — zoned schools average 99% FRL vs 62% district-wide (36 pts higher); higher-poverty schools than district average — tighter screening recommended.
- Zoned-school proficiency averages 54% at this address vs 29% district-wide (+26 pts) — the actual schools serving this property are materially stronger than the Martin County Schools average implies; a family-tenant draw the district grade alone would hide.
- Market conditions: 6 active listings in the ZIP.
Forward outlook
- In year one you build about $4k of equity ($241 loan paydown + $3k appreciation (9.5% local appreciation)).
- Martin County population projected at -33% by 2050 — secular population decline; favor cash flow + early exit over multi-decade hold.
- At projected returns (9.5% appreciation + 3.0% rent growth), your $10k cash investment doubles in ~2 years — after that, you're playing with house money.
- By year 8, paydown + projected appreciation supports a ~$30k cash-out refi (75% LTV) — recoverable capital for the next deal without selling this one.
Negotiation context
- It's been on market 114 days — a 9% lower offer ($32k) is reasonable based on typical stale-listing flexibility.
- 5 sale attempts; this cycle's ask has dropped $25k (42%) from the opening price — seller is motivated, your offer sets the floor, not the list.
Risks & watch-outs
- Climate carrying-cost: severe wind risk, 80% chance of damaging wind over 30y; moderate wildfire risk; extreme-heat days projected 7→17/yr by 2055 (HVAC capex compounding) — expect insurance premiums to compound above CPI over the hold.
Questions for the listing agent
- It's been on market 114 days. Have you received any prior offers? Is the seller open to a 9% concession, seller financing, or rate buy-down credit?
- Why hasn't it sold? Are there any deal-killer items the seller is aware of (foundation, flood, title, zoning, code violations)?
- Is there a deadline driving the sale (1031 exchange, divorce, estate, relocation)? That informs how much negotiation room exists.
- Schools are F-rated, which usually means shorter tenancies and higher turnover. Who's the typical renter profile here, and what's been the actual vacancy rate?
- Crime grade is F in this area — have there been break-ins, vandalism, or insurance claims at this property in the last 3 years? What carrier currently insures it and at what premium?
- What's the average days-on-market for RENTAL listings here right now (not sales)? A rising rental-DOM trend means longer vacancies and softer asking-rent achievability than the comps imply.
- What's the recent tenant-quality profile in this submarket — average credit score on applications, eviction rate, late-payment / NSF rate, and stable-employment percentage? A property-management company in the area should have these aggregated.
- How much new for-sale + rental construction is in the pipeline within 1–3 miles? Heavy new supply typically softens prices + rents 12–24 months out; constrained supply supports both.
Investment metrics
- 1% rule
- 2.71% ✓
- Cap rate
- 22.74%
- Cash-on-cash
- 58.72%
- DSCR
- 3.61
- GRM
- 3.1
CMA / ARV
- ARV (on-the-fly)
- $57,024
- Comps found
- 1
Show comp detail 1 sale within ~0.75 mi
| Address | Dist | Beds/Ba | Sqft | Sold | Price | $/sf | Match |
|---|---|---|---|---|---|---|---|
| 3140 Piney Woods Rd | 0.37mi | 3/2.0 | 1,248 (+5%) | 21mo | $60,000 | $48 | 57 |
Match score weights: distance 35% · size 25% · config 20% · recency 20%. Top-matched comps best support the ARV.
Projected returns pro-forma
9.48% appreciation · 3.0% rent growth · sell at horizon
- IRR
- 70.5%
- Equity multiple
- 5.94×
- Total profit
- $48,250
- Equity at exit
- $30,115
- IRR
- 64.8%
- Equity multiple
- 13.07×
- Total profit
- $117,900
- Equity at exit
- $63,584
Cash invested: $9,772 (down + closing). Projections, not guarantees.
Landlord ↔ Tenant lean methodology
- Overall (STATE)
- 85 Strongly Landlord-Friendly
- State North Carolina
- 85 Strongly Landlord-Friendly · R+3
- County
- — inherits STATE
- City
- — inherits STATE
ZIP-level market 27846
- Home prices YoY
- 6.5%
- Active inventory
- 6
- Price-to-rent
- 3.1×
Monthly cashflow live
- Estimated rent
- $944 medium interval (Pro) →
- Mortgage (P&I)
- −$183
- Tax from tax record
- −$70 /mo · $841/yr
- Insurance
- −$15
- HOA
- −$0
- Vacancy / Maint / Mgmt
- −$198
- Net cashflow
- $478
Break-even live
UW: 25.0% down · 7.5% · 30yr · 1.5% tax · 5.0% vac · 8.0% maint · 8.0% mgmt
Financing live
Cash to close
- Down payment
- $8,725
- Closing costs
- $1,047
- Reserves months
- —
- Total cash needed
- —
Loan-product check · same deal, 3 products live
Conventional
25% down · 7.5% · 30yr
- Down + closing
- —
- Monthly P&I
- —
- Monthly cashflow
- —
- DSCR
- —
- Eligible?
- —
Personal DTI + credit; lowest rate.
DSCR
20% down · 8.5% · 30yr
- Down + closing
- —
- Monthly P&I
- —
- Monthly cashflow
- —
- DSCR
- —
- Eligible?
- —
No personal income docs; deal must DSCR.
Hard money
10% down · 12.0% · 12mo
- Down + closing
- —
- Monthly P&I
- —
- Monthly cashflow
- —
- DSCR
- —
- Eligible?
- —
Short-term bridge; refi at stabilization.
Listing history 12 events
-
2026-05-13price $34,900
-
2026-05-07status Active
-
2026-05-06status Pending
-
2026-04-09price $39,900
-
2026-03-10price $49,900
-
2026-02-23status Active
-
2026-02-02Active Under Contract
-
2026-02-02$59,900
-
2025-12-24historical Active Under Contract
-
2025-12-24historical
-
2025-11-05price $59,900
-
2025-10-07$74,000 Active
ⓘ Source: listings_history table (triggers on properties + properties_extension) + one-shot
backfill from property_details.listing_events for pre-trigger history.
Tax reassessment forecast NC · Resets to sale price
- Current annual tax
- $841 · $70/mo
- Projected year-2 tax
- $841 · $70/mo
- Expected delta
- $0/yr ($0/mo · 0.0%)
ⓘ Screening estimate from a state-policy table — verify with the county assessor before closing.
Climate risk First Street
- Flood 1/10 Low FEMA zone X (unshaded) · 0% chance over 30 yrs
- Wildfire 5/10 Major
- Heat 8/10 Severe 7 d/yr ≥108°F today · 17 d/yr by 30 yrs out
- Wind 8/10 Severe 80% chance of damaging wind over 30 yrs
- Air quality 2/10 Low 1 unhealthy d/yr today · 1 by 30 yrs out
Nearby sold comps map
Loading sold comps map…
Walkable amenities ~0.75 mi
Loading nearby amenities…
Taxation est. · year 1
- Rental income
- $11,330
- − Mortgage interest
- −$1,955
- − Property taxes
- −$841
- − Insurance
- −$174
- − Repairs & maintenance
- −$906
- − Management
- −$906
- − Depreciation
- −$1,015
- Taxable income
- $5,531
- Est. tax owed @ 24.0%
- −$1,327
- After-tax cash flow
- $4,411/yr
For passive investors: Depreciation is non-cash, so a rental often shows a tax loss while cash-flowing — sheltering income. Rental losses are passive: they offset passive income freely, and up to $25,000/yr can offset ordinary (W-2) income if you actively participate and your MAGI is under $100k (phasing out to $0 by $150k); unused losses carry forward. On sale, claimed depreciation is recaptured at up to 25%, and gains may owe capital-gains tax (a 1031 exchange can defer both). Figures are a year-1 estimate at your 24.0% rate — not tax advice; consult a CPA.
Schools (NCES district)
- District
- Martin County Schools
- NCES district ID
- 3702880
- Math proficiency
- 24% ▼ -2.00%
- Reading proficiency
- 34% ▲ 1.00%
- Median HH income
- $35,403
- Composite
- 23.94/100
- National rank
- #7781
- State rank
- #150 of 178 in NC
Livability — Plymouth
- Score
- 56/100
- State rank
- #627
- US rank
- #22812
Category grades
Schools grade is shown separately in the Schools card above.
Census & demographics
- Population (ZIP)
- 2,689
Population outlook (Martin County) Hauer SSP2
- Today (2025)
- 21,018 people
- By 2030
- 19,693 · -6.3%
- By 2040
- 16,793 · -20.1%
- By 2050
- 14,171 · -32.6%
- By 2075
- 9,804 · -53.4%
- By 2100
- 6,894 · -67.2%
Race, ethnicity, and origin ACS 2023
- Neighborhood character
- Predominantly White (73%)
- Race & ethnicity
- White 73% Black 23% Two or more races 3% Hispanic / Latino 2%
- Common ancestry
- Slovak 1% German 1% Italian 1%
- Foreign-born
- 0%
Political lean MEDSL · Martin
- 2024 margin
- R (+10.3) · D 44.6% · R 54.9%
- 2008→2024 swing
- -15.0pp toward R · 2008: 4.6pp · 2024: -10.3pp
- All cycles
- 2024: R+10.3 2020: R+5.0 2016: R+0.5 2012: D+4.4 2008: D+4.6
Not yet ingested
- Civics
- —
Market trends
- HPI YoY
- ▲ 9.48%
- Current HPI
- 155.5151
- Rent YoY
- —
- Metro
- —
- State GDP YoY
- ▲ 3.28%
- F500 in state
- 26
Industry mix (Fortune 500 HQ in NC)
| Industry | F500 HQs | Revenue |
|---|---|---|
| Financial Services | 2 | $213B |
|
||
| Retail | 2 | $95B |
|
||
| Industrial Conglomerate | 1 | $38B |
|
||
| Metals / Steel | 1 | $35B |
|
||
| Utilities | 1 | $30B |
|
||
| Industrial Machinery | 1 | $19B |
|
||
Price history
-52.8% since first listed12 events — show timeline
- 2026-05-13 Price Changed $34,900 Hive MLS
- 2026-05-07 Relisted — Hive MLS
- 2026-05-06 Pending — Hive MLS
- 2026-04-09 Price Changed $39,900 Hive MLS
- 2026-03-10 Price Changed $49,900 Hive MLS
- 2026-02-23 Relisted — Hive MLS
- 2026-02-02 Listed $59,900 Hive MLS
- 2026-02-02 Listed — Hive MLS
- 2025-12-24 Contingent — Hive MLS
- 2025-12-24 Listing Removed — Hive MLS
- 2025-11-05 Price Changed $59,900 Hive MLS
- 2025-10-07 Listed $74,000 Hive MLS
Property tax history
+6.1%/yrLatest (2025): $841 · +39.3% YoY. Source: county tax records.
Cash-flow waterfall
monthlySold comps — $/sqft
last 12 mo · ≤1 miLoading sold comps…