 Fourplex
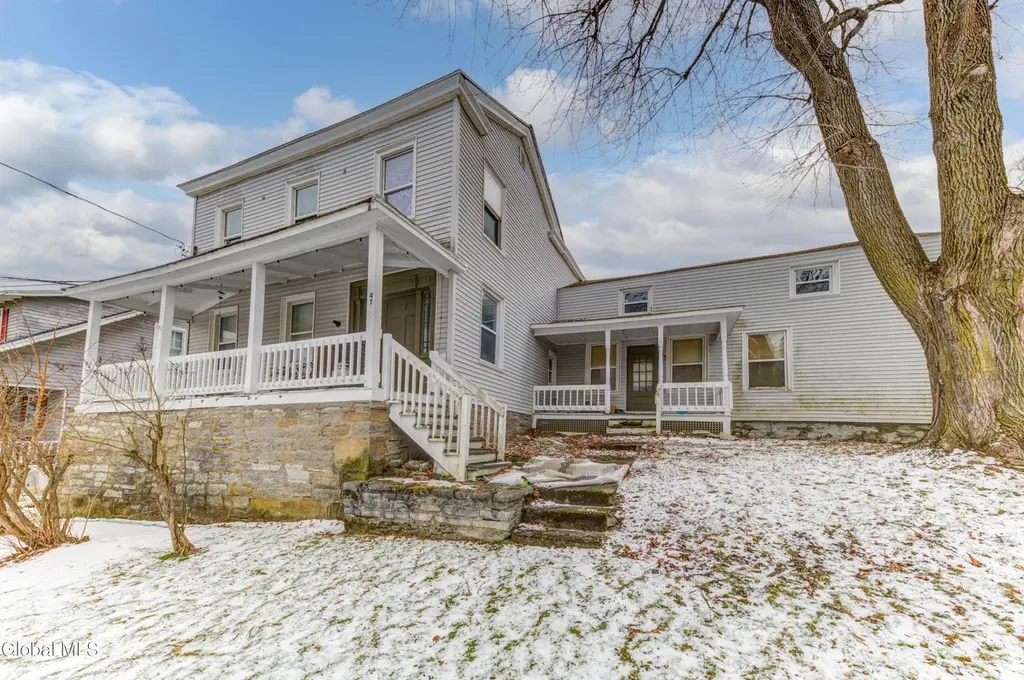
47-49 Moyer St · Canajoharie, NY
Flood risk 1/10 · Minimal
- FEMA flood zone
- X (unshaded)
- Chance of flooding over 30 yrs
- 0.0%
- Est. flood insurance / yr
- $473 – $860
Fire risk 1/10 · Minimal
- Est. fire insurance / yr
- $691 – $1,283
Heat risk 3/10 · Minor
- Hot days now (above 96°F)
- 7 days/yr
- Hot days in 30 yrs
- 17 days/yr
Wind risk 2/10 · Minimal
- Chance of severe wind over 30 yrs
- 2.0%
Air-quality risk 1/10 · Minimal
- Unhealthy air days now
- 0 days/yr
- Unhealthy air days in 30 yrs
- 0 days/yr
Risk factors via First Street. Map © Google.
Why this score? — see what drove the A grade
The composite is a weighted blend of 9 inputs, each scored 0–100. Each bar is that input's sub-score; the figure is the points it added to the 100-point composite (weight × sub-score).
- Cash flow +30.0/30.0
- ARV discount +15.0/15.0
- DSCR +10.0/10.0
- Appreciation +9.7/10.0
- 1% rule +9.6/10.0
- Schools +4.1/10.0
- Livability +3.5/5.0
- Rent growth +2.5/5.0
- Condition / age +2.2/5.0
$269,999
🖨 Deal sheet 📄 Offer letter ✓ Due diligence
Multi-family units
County records classify this as Multi-Family (2-4 Unit). Listing-text estimate: 4 units. confirmed
Listing remarks MLS
Well-maintained 4-unit multifamily located on a quiet residential side street. This solid investment property features all separate utilities and has been owned long-term, reflecting pride of ownership throughout. The building offers a desirable unit mix of two 2-bedroom apartments, one 3-bedroom apartment, and one 1-bedroom apartment, providing strong rental appeal. Many long-term tenants in place. Exterior is vinyl sided, and the property includes off-street parking. A great opportunity for investors seeking steady income in a residential neighborhood.
Key facts
- Separate utilities
- Multifamily
- Off-street parking
Tags
Neighborhood map
What this means for you Summary
Snapshot
- This is a 2×2bd/1ba + 1×3bd/1ba + 1×1bd/1ba units multifamily listed at $270k. Condition is rated fair.
Deal economics
- At list price, monthly cash flow is $1k ($15k/yr) — positive. Per door: $311/mo.
- The deal already cash-flows at list — no discount required.
- Meets the 1% rule at list price ($4k rent vs $270k).
- Recommended offer: $238k (12.0% below list) — sets the bar for market timing.
Location & tenants
- Location reads 69/100 on livability (#510 in NY) — a middle-class / working-renter tenant base. Strengths: cost of living A+, health & safety A+, crime A-; Watch: amenities F, commute F, employment F.
- Canajoharie Central School District (town): math 38% / reading 59% proficiency, ranked #414 of 590 in NY (top 70%) — families likely to look elsewhere, expect single-tenant / working-renter base with shorter leases.
- Market conditions: 30 active listings in the ZIP; 210 units permitted in Montgomery County in 2024 (168 in 5+ unit buildings).
Forward outlook
- In year one you build about $27k of equity ($2k loan paydown + $26k appreciation (9.5% local appreciation)).
- Montgomery County population projected at -11% by 2050 — secular population decline; favor cash flow + early exit over multi-decade hold.
- At projected returns (9.5% appreciation + 3.0% rent growth), your $76k cash investment doubles in ~2 years — after that, you're playing with house money.
- By year 2, paydown + projected appreciation supports a ~$44k cash-out refi (75% LTV) — recoverable capital for the next deal without selling this one.
Negotiation context
- It's been on market 157 days — a 12% lower offer ($238k) is reasonable based on typical stale-listing flexibility.
- 3 sale attempts since 10y ago with the ask held roughly flat each time — persistent listings suggest the price (not the market) is what's stuck; bring a comps-based counter.
Risks & watch-outs
- Watch-outs: built in 1920 — expect roof / HVAC / electrical / plumbing capex.
Questions for the listing agent
- It's been on market 157 days. Have you received any prior offers? Is the seller open to a 12% concession, seller financing, or rate buy-down credit?
- Can we see the unit-by-unit rent roll, current vacancy, and any below-market leases? What's the average tenancy length?
- What capital expenditures (roof, boiler, parking lot, exteriors) have been made in the last 5 years, and what's planned in the next 2?
- Have any recent inspections been done? Can we get a copy of the seller's disclosures and any deferred-maintenance estimates?
- Built in 1920 — when were the roof, HVAC, electrical panel, plumbing, and water heater last replaced?
- Why hasn't it sold? Are there any deal-killer items the seller is aware of (foundation, flood, title, zoning, code violations)?
- Is there a deadline driving the sale (1031 exchange, divorce, estate, relocation)? That informs how much negotiation room exists.
- What's the average days-on-market for RENTAL listings here right now (not sales)? A rising rental-DOM trend means longer vacancies and softer asking-rent achievability than the comps imply.
- What's the recent tenant-quality profile in this submarket — average credit score on applications, eviction rate, late-payment / NSF rate, and stable-employment percentage? A property-management company in the area should have these aggregated.
- How much new apartment / multifamily construction is in the pipeline within 1–3 miles? Heavy new supply (>2% of stock underway) typically softens rents 12–24 months out; light construction supports rent growth.
Investment metrics
- 1% rule
- 1.46% ✓
- Cap rate
- 11.82%
- Cash-on-cash
- 19.74%
- DSCR
- 1.88
- GRM
- 5.7
CMA / ARV
- ARV (median comp)
- $353,859
- List price
- $269,999
- Delta
- -23.70%
- Verdict
- UNDERPRICED
- Comps
- 5 within 1.0 mi
Projected returns pro-forma
9.48% appreciation · 3.0% rent growth · sell at horizon
- IRR
- 38.1%
- Equity multiple
- 3.87×
- Total profit
- $216,830
- Equity at exit
- $233,152
- IRR
- 33.1%
- Equity multiple
- 8.59×
- Total profit
- $574,100
- Equity at exit
- $492,444
Cash invested: $75,600 (down + closing). Projections, not guarantees.
Landlord ↔ Tenant lean methodology
- Overall (STATE)
- 15 Strongly Tenant-Friendly
- State New York
- 15 Strongly Tenant-Friendly · D+10
- County
- — inherits STATE
- City
- — inherits STATE
ZIP-level market 13317
- Home prices YoY
- 3.2%
- Active inventory
- 30
- Price-to-rent
- 23.1×
Monthly cashflow live
- Estimated rent
- $3,936 medium interval (Pro) →
- Mortgage (P&I)
- −$1,416
- Tax est. 1.5%
- −$337 /mo · $4,050/yr
- Insurance
- −$112
- HOA
- −$0
- Vacancy / Maint / Mgmt
- −$827
- Net cashflow
- $1,244
Break-even live
4-unit breakdown (identical units grouped — click to expand)
| Units | Beds | Baths | Est. rent |
|---|---|---|---|
| 2× units | 2 | 1 | $1,950 |
| #1 | 2 | 1 | $975 |
| #2 | 2 | 1 | $975 |
| 1× unit | 3 | 1 | $1,049 |
| 1× unit | 1 | 1 | $938 |
| Total (4 units) | $3,936 | ||
UW: 25.0% down · 7.5% · 30yr · 1.5% tax · 5.0% vac · 8.0% maint · 8.0% mgmt
Financing live
Cash to close
- Down payment
- $67,500
- Closing costs
- $8,100
- Reserves months
- —
- Total cash needed
- —
Loan-product check · same deal, 3 products live
Conventional
25% down · 7.5% · 30yr
- Down + closing
- —
- Monthly P&I
- —
- Monthly cashflow
- —
- DSCR
- —
- Eligible?
- —
Personal DTI + credit; lowest rate.
DSCR
20% down · 8.5% · 30yr
- Down + closing
- —
- Monthly P&I
- —
- Monthly cashflow
- —
- DSCR
- —
- Eligible?
- —
No personal income docs; deal must DSCR.
Hard money
10% down · 12.0% · 12mo
- Down + closing
- —
- Monthly P&I
- —
- Monthly cashflow
- —
- DSCR
- —
- Eligible?
- —
Short-term bridge; refi at stabilization.
Listing history 19 events
-
2026-06-18days on market $269,999 Active 157 DOM
-
2026-06-17days on market $269,999 Active 156 DOM
-
2026-06-16days on market $269,999 Active 155 DOM
-
2026-06-15days on market $269,999 Active 154 DOM
-
2026-06-13days on market $269,999 Active 152 DOM
-
2026-06-12days on market $269,999 Active 151 DOM
-
2026-06-09days on market $269,999 Active 148 DOM
-
2026-06-08days on market $269,999 Active 147 DOM
-
2026-06-07days on market $269,999 Active 146 DOM
-
2026-06-07days on market $269,999 Active 145 DOM
-
2026-06-04days on market $269,999 Active 142 DOM
-
2026-06-02days on market $269,999 Active 141 DOM
-
2026-06-01days on market $269,999 Active 140 DOM
-
2026-05-31days on market $269,999 Active 139 DOM
-
2026-03-11status Active 560-char remark
Show marketing remark (560 chars)
Well-maintained 4-unit multifamily located on a quiet residential side street. This solid investment property features all separate utilities and has been owned long-term, reflecting pride of ownership throughout. The building offers a desirable unit mix of two 2-bedroom apartments, one 3-bedroom apartment, and one 1-bedroom apartment, providing strong rental appeal. Many long-term tenants in place. Exterior is vinyl sided, and the property includes off-street parking. A great opportunity for investors seeking steady income in a residential neighborhood.
-
2026-02-26historical Contingent 560-char remark
Show marketing remark (560 chars)
Well-maintained 4-unit multifamily located on a quiet residential side street. This solid investment property features all separate utilities and has been owned long-term, reflecting pride of ownership throughout. The building offers a desirable unit mix of two 2-bedroom apartments, one 3-bedroom apartment, and one 1-bedroom apartment, providing strong rental appeal. Many long-term tenants in place. Exterior is vinyl sided, and the property includes off-street parking. A great opportunity for investors seeking steady income in a residential neighborhood.
-
2026-01-10$269,999 Active 560-char remark
Show marketing remark (560 chars)
Well-maintained 4-unit multifamily located on a quiet residential side street. This solid investment property features all separate utilities and has been owned long-term, reflecting pride of ownership throughout. The building offers a desirable unit mix of two 2-bedroom apartments, one 3-bedroom apartment, and one 1-bedroom apartment, providing strong rental appeal. Many long-term tenants in place. Exterior is vinyl sided, and the property includes off-street parking. A great opportunity for investors seeking steady income in a residential neighborhood.
-
2016-09-13historical
-
2016-03-06$131,500 New
ⓘ Source: listings_history table (triggers on properties + properties_extension) + one-shot
backfill from property_details.listing_events for pre-trigger history.
Climate risk First Street
- Flood 1/10 Low FEMA zone X (unshaded) · 0% chance over 30 yrs
- Wildfire 1/10 Low
- Heat 3/10 Moderate 7 d/yr ≥96°F today · 17 d/yr by 30 yrs out
- Wind 2/10 Low 2% chance of damaging wind over 30 yrs
- Air quality 1/10 Low 0 unhealthy d/yr today · 0 by 30 yrs out
Nearby sold comps map
Loading sold comps map…
Walkable amenities ~0.75 mi
Loading nearby amenities…
Taxation est. · year 1
- Rental income
- $47,232
- − Mortgage interest
- −$15,124
- − Property taxes
- −$4,050
- − Insurance
- −$1,350
- − Repairs & maintenance
- −$3,779
- − Management
- −$3,779
- − Depreciation
- −$7,855
- Taxable income
- $11,296
- Est. tax owed @ 24.0%
- −$2,711
- After-tax cash flow
- $12,211/yr
For passive investors: Depreciation is non-cash, so a rental often shows a tax loss while cash-flowing — sheltering income. Rental losses are passive: they offset passive income freely, and up to $25,000/yr can offset ordinary (W-2) income if you actively participate and your MAGI is under $100k (phasing out to $0 by $150k); unused losses carry forward. On sale, claimed depreciation is recaptured at up to 25%, and gains may owe capital-gains tax (a 1031 exchange can defer both). Figures are a year-1 estimate at your 24.0% rate — not tax advice; consult a CPA.
Condition & rehab AI · 12 photos
This 4-unit multifamily property requires moderate renovations to improve its condition and increase its value. Key areas for improvement include the roof, exterior siding, flooring, interior walls, and windows.
Repairs flagged
- Major roof — Missing shingles
- Major exterior siding — Weathered and peeling
- Major flooring — Worn-out carpet
- Major interior walls — Peeling paint
- Major windows — Dirty and old
Value-add opportunities
- Both New roof — Improves both resale and rental value
- Both New siding — Enhances curb appeal and value
- Both New flooring — Improves living space and rental appeal
- Both Paint interior walls — Fresh paint enhances curb appeal and interior aesthetics
- Both Clean and replace windows — Fresh windows improve energy efficiency and curb appeal
Renovation cost estimate screening
| Repair item | Severity | Est. cost |
|---|---|---|
| roof · Missing shingles | Major | $15,000–50,000 |
| exterior siding · Weathered and peeling | Major | $15,000–50,000 |
| flooring · Worn-out carpet | Major | $15,000–50,000 |
| interior walls · Peeling paint | Major | $15,000–50,000 |
| windows · Dirty and old | Major | $15,000–50,000 |
| Total estimated repair cost · 5 items | $75,000–250,000 |
Value-add ROI direction
- Both New roof — Improves both resale and rental value ↑
- Both New siding — Enhances curb appeal and value ↑
- Both New flooring — Improves living space and rental appeal ↑
- Both Paint interior walls — Fresh paint enhances curb appeal and interior aesthetics ↑
- Both Clean and replace windows — Fresh windows improve energy efficiency and curb appeal ↑
ⓘ Cost ranges are severity-bucket heuristics (US national rule-of-thumb). Get contractor quotes + a written scope before underwriting a rehab budget.
Schools (NCES district)
- District
- Canajoharie Central School District
- NCES district ID
- 3606300
- Math proficiency
- 38% ▼ -12.00%
- Reading proficiency
- 59% ▲ 10.00%
- Median HH income
- $49,296
- Composite
- 41.39/100
- National rank
- #3482
- State rank
- #414 of 590 in NY
Livability — Canajoharie
- Score
- 69/100
- State rank
- #510
- US rank
- #9061
Category grades
Schools grade is shown separately in the Schools card above.
Census & demographics
- Census place
- Canajoharie, NY
- Population (ZIP)
- 3,970
Population outlook (Montgomery County) Hauer SSP2
- Today (2025)
- 48,683 people
- By 2030
- 47,785 · -1.8%
- By 2040
- 45,492 · -6.6%
- By 2050
- 43,161 · -11.3%
- By 2075
- 38,134 · -21.7%
- By 2100
- 32,337 · -33.6%
Race, ethnicity, and origin ACS 2023
- Neighborhood character
- Predominantly White (95%)
- Race & ethnicity
- White 95% Two or more races 3% Hispanic / Latino 2%
- Common ancestry
- Iranian 5% Romanian 3% Lithuanian 3%
- Foreign-born
- 1% · Canada
- Languages at home
- 79% English-only · German/W. Germanic 19% Spanish 1% French/Haitian/Cajun 1%
Political lean MEDSL · Montgomery
- 2024 margin
- Strong R (+28.7) · D 35.6% · R 64.4%
- 2008→2024 swing
- -20.6pp toward R · 2008: -8.1pp · 2024: -28.7pp
- All cycles
- 2024: R+28.7 2020: R+22.6 2016: R+26.5 2012: R+4.4 2008: R+8.1
Not yet ingested
- Civics
- —
Market trends
- HPI YoY
- ▲ 9.48%
- Current HPI
- 303.1499
- Rent YoY
- —
- Metro
- —
- State GDP YoY
- ▲ 2.60%
- F500 in state
- 92
Industry mix (Fortune 500 HQ in NY)
| Industry | F500 HQs | Revenue |
|---|---|---|
| Financial Services | 10 | $950B |
|
||
| Consumer Goods | 9 | $162B |
|
||
| Insurance | 4 | $225B |
|
||
| Telecommunications | 2 | $144B |
|
||
| Pharmaceuticals | 2 | $112B |
|
||
| Media / Entertainment | 2 | $69B |
|
||
Price history
+105.3% since first listed5 events — show timeline
- 2026-03-11 Relisted — Global MLS
- 2026-02-26 Contingent — Global MLS
- 2026-01-10 Listed $269,999 Global MLS
- 2016-09-13 Listing Removed — Global MLS
- 2016-03-06 Listed $131,500 Global MLS
Cash-flow waterfall
monthlySold comps — $/sqft
last 12 mo · ≤1 miLoading sold comps…