133 Dowling Rd · Geistown, PA
Flood risk 1/10 · Minimal
- FEMA flood zone
- X (unshaded)
- Chance of flooding over 30 yrs
- 0.0%
- Est. flood insurance / yr
- $473 – $860
Fire risk 1/10 · Minimal
- Est. fire insurance / yr
- $511 – $949
Heat risk 2/10 · Minimal
- Hot days now (above 91°F)
- 7 days/yr
- Hot days in 30 yrs
- 17 days/yr
Wind risk 2/10 · Minimal
- Chance of severe wind over 30 yrs
- —
Air-quality risk 2/10 · Minimal
- Unhealthy air days now
- 1 days/yr
- Unhealthy air days in 30 yrs
- 2 days/yr
Risk factors via First Street. Map © Google.
Why this score? — see what drove the D grade
The composite is a weighted blend of 9 inputs, each scored 0–100. Each bar is that input's sub-score; the figure is the points it added to the 100-point composite (weight × sub-score).
- Cash flow +12.8/30.0
- ARV discount +7.5/15.0
- Schools +5.5/10.0
- Livability +3.9/5.0
- DSCR +3.8/10.0
- 1% rule +2.8/10.0
- Rent growth +2.5/5.0
- Condition / age +2.5/5.0
- Appreciation +0.0/10.0
$139,900
🖨 Deal sheet 📄 Offer letter ✓ Due diligence
Listing remarks MLS
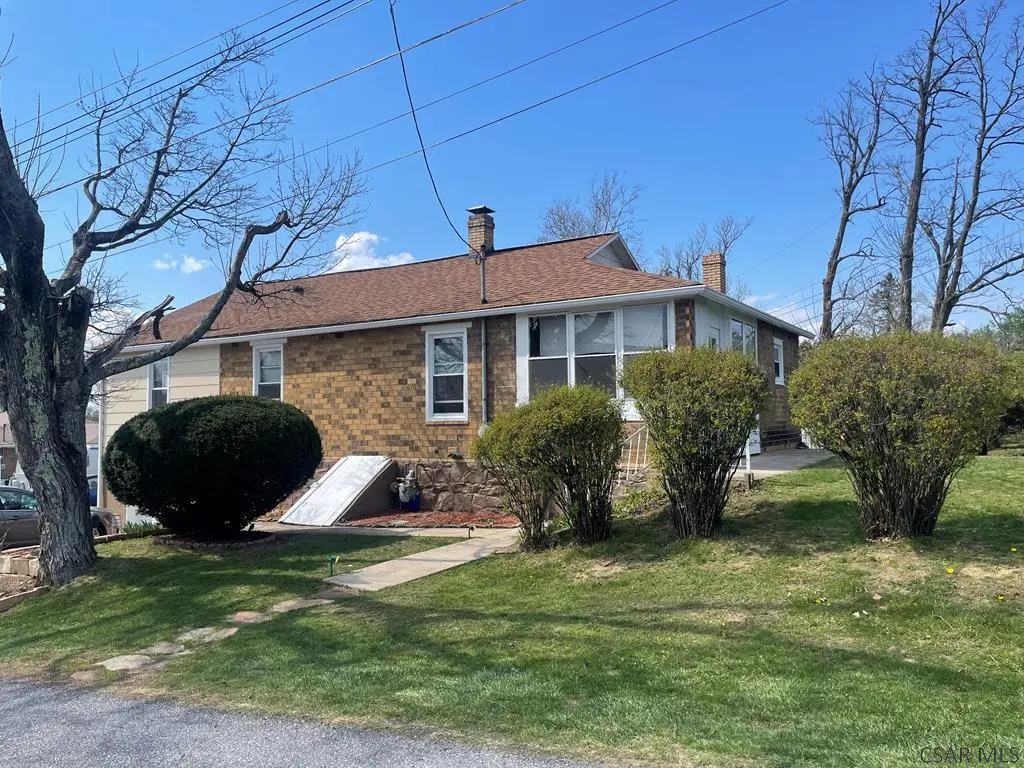
Easy one story living in this well kept two bedroom ranch. Oak floors , kitchen updated, oversize lot, single garage and more!
Key facts
- Integral garage
- Partially fenced
- Oversized lot
Tags
Property features AI
Exterior
- Parking: Detached or attached garage with 1 parking space; Additional parking with crushed rock
- Utilities: Public water; Public sewer (sewer available); Natural gas
- Home design: Single-family residence; One story
- Construction: Brick and frame construction; Shingle roof; Full basement
- Exterior features: Enclosed patio; Corner lot
Interior
- Bedrooms: Master downstairs
- Bathrooms: 1 full bathroom
- Heating & cooling: Hot water heating; Natural gas heating
- Interior features: Master bedroom located on the main level; Full, unfinished basement
- Laundry & utility: Laundry located in the basement
Neighborhood map
What this means for you Summary
Snapshot
- This is a 2-bed/1.0-bath single-family listed at $140k.
Deal economics
- At list price, monthly cash flow is $-12 ($-149/yr) — negative.
- To cash-flow at today's rent, offer at most $138k (1.6% below list).
- To meet the 1% rule (rent ≥ 1% of price), the offer needs to be $110k (21.5% below list).
- Recommended offer: $110k (21.5% below list) — sets the bar for 1% rule.
Location & tenants
- Location reads 77/100 on livability (#332 in PA, #2,915 nationally) — a middle-class / working-renter tenant base. Strengths: crime A+, cost of living A+, housing A+; Watch: amenities F, commute F.
- Richland SD (suburban): math 57% / reading 72% proficiency, ranked #54 of 539 in PA (top 10%) — acceptable for families but not a draw, mixed tenant base, ~2y average lease; only 19% free/reduced lunch — higher-income household profile.
- Market conditions: 50 active listings in the ZIP; 64 units permitted in Cambria County in 2024 (0 in 5+ unit buildings).
Forward outlook
- Local home prices are declining (-3.0%/yr); year-one equity from $967 of loan paydown is wiped out by about $4k of value loss. Plan a longer hold.
- Cambria County population projected at -28% by 2050 — secular population decline; favor cash flow + early exit over multi-decade hold.
Negotiation context
- Only 4 days on market — expect competitive offers; lowballing is unlikely to land.
- 3 sale attempts since 22y ago with the ask held roughly flat each time — persistent listings suggest the price (not the market) is what's stuck; bring a comps-based counter.
- Current owner paid $72k; list at $140k implies a 94% gain — meaningful room to come down on a strong offer.
Risks & watch-outs
- Watch-outs: built in 1938 — expect roof / HVAC / electrical / plumbing capex.
Questions for the listing agent
- What do current leases actually rent for vs. the listed asking? Can we see a recent rent roll and the last 12 months of T-12 income?
- Built in 1938 — when were the roof, HVAC, electrical panel, plumbing, and water heater last replaced?
- Is there a deadline driving the sale (1031 exchange, divorce, estate, relocation)? That informs how much negotiation room exists.
- The area grade is low — what's the realistic commute time and amenity access for the typical tenant pool here? Any planned neighborhood developments (good or bad) we should know about?
- What's the average days-on-market for RENTAL listings here right now (not sales)? A rising rental-DOM trend means longer vacancies and softer asking-rent achievability than the comps imply.
- What's the recent tenant-quality profile in this submarket — average credit score on applications, eviction rate, late-payment / NSF rate, and stable-employment percentage? A property-management company in the area should have these aggregated.
- How much new for-sale + rental construction is in the pipeline within 1–3 miles? Heavy new supply typically softens prices + rents 12–24 months out; constrained supply supports both.
Investment metrics
- 1% rule
- 0.78% ✗
- Cap rate
- 6.19%
- Cash-on-cash
- -0.38%
- DSCR
- 0.98
- GRM
- 10.6
CMA / ARV
No comps found within radius.
Projected returns pro-forma
-3.0% appreciation · 3.0% rent growth · sell at horizon
- IRR
- -17.0%
- Equity multiple
- 0.40×
- Total profit
- $-23,498
- Equity at exit
- $20,860
- IRR
- -8.9%
- Equity multiple
- 0.45×
- Total profit
- $-21,632
- Equity at exit
- $12,096
Cash invested: $39,172 (down + closing). Projections, not guarantees.
Landlord ↔ Tenant lean methodology
- Overall (STATE)
- 62 Landlord-Friendly
- State Pennsylvania
- 62 Landlord-Friendly · EVEN
- County
- — inherits STATE
- City
- — inherits STATE
ZIP-level market 15904
- Active inventory
- 50
- Price-to-rent
- 10.6×
Monthly cashflow live
- Estimated rent
- $1,098 medium interval (Pro) →
- Mortgage (P&I)
- −$734
- Tax from tax record
- −$88 /mo · $1,052/yr
- Insurance
- −$58
- HOA
- −$0
- Vacancy / Maint / Mgmt
- −$231
- Net cashflow
- $-12
Break-even live
UW: 25.0% down · 7.5% · 30yr · 1.5% tax · 5.0% vac · 8.0% maint · 8.0% mgmt
Financing live
Cash to close
- Down payment
- $34,975
- Closing costs
- $4,197
- Reserves months
- —
- Total cash needed
- —
Loan-product check · same deal, 3 products live
Conventional
25% down · 7.5% · 30yr
- Down + closing
- —
- Monthly P&I
- —
- Monthly cashflow
- —
- DSCR
- —
- Eligible?
- —
Personal DTI + credit; lowest rate.
DSCR
20% down · 8.5% · 30yr
- Down + closing
- —
- Monthly P&I
- —
- Monthly cashflow
- —
- DSCR
- —
- Eligible?
- —
No personal income docs; deal must DSCR.
Hard money
10% down · 12.0% · 12mo
- Down + closing
- —
- Monthly P&I
- —
- Monthly cashflow
- —
- DSCR
- —
- Eligible?
- —
Short-term bridge; refi at stabilization.
Listing history 8 events
-
2026-04-13status Pending
-
2026-04-09$139,900 Active
-
2010-06-16soldstatus $72,000 126-char remark
Show marketing remark (126 chars)
Easy one story living in this well kept two bedroom ranch. Oak floors , kitchen updated, oversize lot, single garage and more!
-
2010-06-16soldstatus $72,000
Show marketing remark (126 chars)
Easy one story living in this well kept two bedroom ranch. Oak floors , kitchen updated, oversize lot, single garage and more!
-
2010-04-10$74,900 126-char remark
Show marketing remark (126 chars)
Easy one story living in this well kept two bedroom ranch. Oak floors , kitchen updated, oversize lot, single garage and more!
-
2004-10-14soldstatus $72,000 40-char remark
Show marketing remark (40 chars)
two bedroom brick ranch on 101 x 185 lot
-
2004-10-14soldstatus $72,000
Show marketing remark (40 chars)
two bedroom brick ranch on 101 x 185 lot
-
2004-07-21$74,900 40-char remark
Show marketing remark (40 chars)
two bedroom brick ranch on 101 x 185 lot
ⓘ Source: listings_history table (triggers on properties + properties_extension) + one-shot
backfill from property_details.listing_events for pre-trigger history.
Tax reassessment forecast PA · Partial reset (capped growth)
- Current annual tax
- $1,052 · $88/mo
- Projected year-2 tax
- $1,631 · $136/mo
- Expected delta
- +$579/yr (+$48/mo · 55.1%)
ⓘ Screening estimate from a state-policy table — verify with the county assessor before closing.
Climate risk First Street
- Flood 1/10 Low FEMA zone X (unshaded) · 0% chance over 30 yrs
- Wildfire 1/10 Low
- Heat 2/10 Low 7 d/yr ≥91°F today · 17 d/yr by 30 yrs out
- Wind 2/10 Low
- Air quality 2/10 Low 1 unhealthy d/yr today · 2 by 30 yrs out
Nearby sold comps map
Loading sold comps map…
Walkable amenities ~0.75 mi
Loading nearby amenities…
Taxation est. · year 1
- Rental income
- $13,172
- − Mortgage interest
- −$7,837
- − Property taxes
- −$1,052
- − Insurance
- −$700
- − Repairs & maintenance
- −$1,054
- − Management
- −$1,054
- − Depreciation
- −$4,070
- Taxable loss
- −$2,593
- Est. tax savings @ 24.0%
- +$622
- After-tax cash flow
- $473/yr
For passive investors: Depreciation is non-cash, so a rental often shows a tax loss while cash-flowing — sheltering income. Rental losses are passive: they offset passive income freely, and up to $25,000/yr can offset ordinary (W-2) income if you actively participate and your MAGI is under $100k (phasing out to $0 by $150k); unused losses carry forward. On sale, claimed depreciation is recaptured at up to 25%, and gains may owe capital-gains tax (a 1031 exchange can defer both). Figures are a year-1 estimate at your 24.0% rate — not tax advice; consult a CPA.
Schools (NCES district)
- District
- Richland SD
- NCES district ID
- 4220250
- Math proficiency
- 57% ▼ -4.00%
- Reading proficiency
- 72% ▼ -1.00%
- Median HH income
- $49,705
- Composite
- 54.72/100
- National rank
- #1322
- State rank
- #54 of 539 in PA
Livability — Geistown
- Score
- 77/100
- State rank
- #332
- US rank
- #2915
Category grades
Schools grade is shown separately in the Schools card above.
Census & demographics
- Population (ZIP)
- 16,283
Population outlook (Cambria County) Hauer SSP2
- Today (2025)
- 122,754 people
- By 2030
- 115,827 · -5.6%
- By 2040
- 101,309 · -17.5%
- By 2050
- 88,379 · -28.0%
- By 2075
- 65,237 · -46.9%
- By 2100
- 46,909 · -61.8%
Race, ethnicity, and origin ACS 2023
- Neighborhood character
- Predominantly White (93%)
- Race & ethnicity
- White 93% Two or more races 3% Hispanic / Latino 2% Black 2% Asian 1%
- Common ancestry
- Romanian 10% Slovak 2% Lithuanian 2%
- Foreign-born
- 2% · Canada
- Languages at home
- 97% English-only · Spanish 1% Other Indo-European 1%
Political lean MEDSL · Cambria
- 2024 margin
- Solid R (+39.7) · D 29.8% · R 69.5%
- 2008→2024 swing
- -40.4pp toward R · 2008: 0.7pp · 2024: -39.7pp
- All cycles
- 2024: R+39.7 2020: R+37.3 2016: R+37.8 2012: R+17.8 2008: D+0.7
Not yet ingested
- Civics
- —
Market trends
- HPI YoY
- ▼ -96.96%
- Current HPI
- 151.6715
- Rent YoY
- —
- Metro
- —
- State GDP YoY
- ▲ 1.68%
- F500 in state
- 34
Industry mix (Fortune 500 HQ in PA)
| Industry | F500 HQs | Revenue |
|---|---|---|
| Healthcare | 2 | $309B |
|
||
| Insurance | 2 | $27B |
|
||
| Telecommunications / Media | 1 | $124B |
|
||
| Industrial Distribution | 1 | $22B |
|
||
| Financial Services | 1 | $20B |
|
||
| Chemicals / Materials | 1 | $18B |
|
||
Price history
+86.8% since first listed8 events — show timeline
- 2026-04-13 Pending — CSMLS
- 2026-04-09 Listed $139,900 CSMLS
- 2010-06-16 Sold (Public Records) $72,000 Public Records
- 2010-06-16 Sold (MLS) $72,000 CSMLS
- 2010-04-10 Listed $74,900 CSMLS
- 2004-10-14 Sold (Public Records) $72,000 Public Records
- 2004-10-14 Sold (MLS) $72,000 CSMLS
- 2004-07-21 Listed $74,900 CSMLS
Property tax history
+1.6%/yrLatest (2026): $1,052 · +2.9% YoY. Source: county tax records.
Cash-flow waterfall
monthlySold comps — $/sqft
last 12 mo · ≤1 miLoading sold comps…