661- #73 Nubbin Ridge Rd · Midway, AR
Flood risk 1/10 · Minimal
- FEMA flood zone
- X (unshaded)
- Chance of flooding over 30 yrs
- 0.0%
- Est. flood insurance / yr
- $473 – $860
Fire risk 5/10 · Moderate
- Est. fire insurance / yr
- $1,499 – $2,785
Heat risk 4/10 · Minor
- Hot days now (above 107°F)
- 7 days/yr
- Hot days in 30 yrs
- 20 days/yr
Wind risk 2/10 · Minimal
- Chance of severe wind over 30 yrs
- 0.0%
Air-quality risk 1/10 · Minimal
- Unhealthy air days now
- 0 days/yr
- Unhealthy air days in 30 yrs
- 0 days/yr
Risk factors via First Street. Map © Google.
Why this score? — see what drove the B+ grade
The composite is a weighted blend of 9 inputs, each scored 0–100. Each bar is that input's sub-score; the figure is the points it added to the 100-point composite (weight × sub-score).
- Cash flow +30.0/30.0
- 1% rule +10.0/10.0
- DSCR +10.0/10.0
- Appreciation +10.0/10.0
- ARV discount +7.5/15.0
- Schools +3.7/10.0
- Livability +3.3/5.0
- Rent growth +2.5/5.0
- Condition / age +2.2/5.0
$45,900
🖨 Deal sheet (PDF) 📄 Offer letter ✓ Due diligence
Listing remarks MLS
Retirement community park located in beautiful Lakeview in Bull Shoals Lake area. This 2009 2 bedroom, 2 bathroom home features open concept living with all luxury vinyl flooring throughout, lots of kitchen cabinets, Stainless Steel range, dishwasher and washer and dryer hookups, enjoy update bathrooms with all neutral colors. There are no neighbors located behind you, just lovely wooded views. Enjoy the tasteful color scheme and roomy floorplan.
Key facts
- Open concept living
- Dishwasher
- Listed 105 days
Tags
Neighborhood map
What this means for you Summary
Snapshot
- This is a 3-bed/2.0-bath manufactured listed at $46k. Condition is rated fair.
Deal economics
- At list price, monthly cash flow is $384 ($5k/yr) — positive.
- The deal already cash-flows at list — no discount required.
- Meets the 1% rule at list price ($887 rent vs $46k).
- Recommended offer: $42k (9.0% below list) — sets the bar for market timing.
- Cap rate 16.3% vs local median 2.5% in Midway — top-decile yield for the area; either an underpriced asset or a hidden risk that comps aren't pricing in. Stress-test before assuming the spread holds.
Location & tenants
- Location reads 66/100 on livability (#139 in AR) — a middle-class / working-renter tenant base. Strengths: cost of living A+, housing A+, crime A-; Watch: schools F, amenities F, commute F.
- Mountain Home School District (town): math 45% / reading 45% proficiency, ranked #40 of 238 in AR (top 17%) — families likely to look elsewhere, expect single-tenant / working-renter base with shorter leases.
- Market conditions: 31 active listings in the ZIP; 47 units permitted in Baxter County in 2024 (0 in 5+ unit buildings).
Forward outlook
- In year one you build about $5k of equity ($317 loan paydown + $5k appreciation (10.0% local appreciation)).
- Baxter County population projected to shrink 9% by 2050 — rents likely to lag national; underwrite the cash flow, not the appreciation.
- At projected returns (10.0% appreciation + 3.0% rent growth), your $13k cash investment doubles in ~2 years — after that, you're playing with house money.
- By year 7, paydown + projected appreciation supports a ~$35k cash-out refi (75% LTV) — recoverable capital for the next deal without selling this one.
Negotiation context
- It's been on market 106 days — a 9% lower offer ($42k) is reasonable based on typical stale-listing flexibility.
Risks & watch-outs
- Climate carrying-cost: moderate wildfire risk — expect insurance premiums to compound above CPI over the hold.
Questions for the listing agent
- It's been on market 106 days. Have you received any prior offers? Is the seller open to a 9% concession, seller financing, or rate buy-down credit?
- Have any recent inspections been done? Can we get a copy of the seller's disclosures and any deferred-maintenance estimates?
- Why hasn't it sold? Are there any deal-killer items the seller is aware of (foundation, flood, title, zoning, code violations)?
- Is there a deadline driving the sale (1031 exchange, divorce, estate, relocation)? That informs how much negotiation room exists.
- Schools are F-rated, which usually means shorter tenancies and higher turnover. Who's the typical renter profile here, and what's been the actual vacancy rate?
- What's the average days-on-market for RENTAL listings here right now (not sales)? A rising rental-DOM trend means longer vacancies and softer asking-rent achievability than the comps imply.
- What's the recent tenant-quality profile in this submarket — average credit score on applications, eviction rate, late-payment / NSF rate, and stable-employment percentage? A property-management company in the area should have these aggregated.
- How much new for-sale + rental construction is in the pipeline within 1–3 miles? Heavy new supply typically softens prices + rents 12–24 months out; constrained supply supports both.
Investment metrics
- 1% rule
- 1.93% ✓
- Cap rate
- 16.32%
- Cash-on-cash
- 35.82%
- DSCR
- 2.59
- GRM
- 4.3
CMA / ARV
- ARV (median comp)
- $29,950
- List price
- $45,900
- Delta
- 53.26%
- Verdict
- OVERPRICED
- Comps
- 6 within 1.0 mi
Show comp detail 1 sale within ~0.75 mi
| Address | Dist | Beds/Ba | Sqft | Sold | Price | $/sf | Match |
|---|---|---|---|---|---|---|---|
| 661- #17 Nubbin Ridge Rd | 0.01mi | 2/2.0 (-1) | 1,008 (-12%) | 7mo | $55,000 | $55 | 68 |
Match score weights: distance 35% · size 25% · config 20% · recency 20%. Top-matched comps best support the ARV.
Projected returns pro-forma
10.0% appreciation · 3.0% rent growth · sell at horizon
- IRR
- 51.8%
- Equity multiple
- 4.85×
- Total profit
- $49,449
- Equity at exit
- $41,350
- IRR
- 45.4%
- Equity multiple
- 10.84×
- Total profit
- $126,428
- Equity at exit
- $89,174
Cash invested: $12,852 (down + closing). Projections, not guarantees.
Landlord ↔ Tenant lean methodology
- Overall (STATE)
- 92 Strongly Landlord-Friendly
- State Arkansas
- 92 Strongly Landlord-Friendly · R+14
- County
- — inherits STATE
- City
- — inherits STATE
ZIP-level market 72642
- Home prices YoY
- 6.1%
- Active inventory
- 31
- Price-to-rent
- 4.3×
Monthly cashflow live
- Estimated rent
- $887 medium interval (Pro) →
- Mortgage (P&I)
- −$241
- Tax est. 1.5%
- −$57 /mo · $688/yr
- Insurance
- −$19
- HOA
- −$0
- Vacancy / Maint / Mgmt
- −$186
- Net cashflow
- $384
Break-even live
Sensitivity live
| Price | -10% $415 | -5% $400 | +0% $384 | +5% $368 | +10% $352 |
|---|---|---|---|---|---|
| Rent | -10% $314 | -5% $349 | +0% $384 | +5% $419 | +10% $454 |
| Rate | -1.0pp $407 | -0.5pp $395 | base $384 | +0.5pp $372 | +1.0pp $360 |
UW: 25.0% down · 7.5% · 30yr · 1.5% tax · 5.0% vac · 8.0% maint · 8.0% mgmt
Financing live
Cash to close
- Down payment
- $11,475
- Closing costs
- $1,377
- Reserves months
- —
- Total cash needed
- —
Loan-product check · same deal, 3 products live
Conventional
25% down · 7.5% · 30yr
- Down + closing
- —
- Monthly P&I
- —
- Monthly cashflow
- —
- DSCR
- —
- Eligible?
- —
Personal DTI + credit; lowest rate.
DSCR
20% down · 8.5% · 30yr
- Down + closing
- —
- Monthly P&I
- —
- Monthly cashflow
- —
- DSCR
- —
- Eligible?
- —
No personal income docs; deal must DSCR.
Hard money
10% down · 12.0% · 12mo
- Down + closing
- —
- Monthly P&I
- —
- Monthly cashflow
- —
- DSCR
- —
- Eligible?
- —
Short-term bridge; refi at stabilization.
Listing history 16 events
-
2026-06-19days on market $45,900 Active 106 DOM
-
2026-06-18days on market $45,900 Active 105 DOM
-
2026-06-17days on market $45,900 Active 104 DOM
-
2026-06-16days on market $45,900 Active 103 DOM
-
2026-06-15days on market $45,900 Active 102 DOM
-
2026-06-14days on market $45,900 Active 100 DOM
-
2026-06-12days on market $45,900 Active 99 DOM
-
2026-06-09days on market $45,900 Active 96 DOM
-
2026-06-08days on market $45,900 Active 95 DOM
-
2026-06-07pricedays on market $45,900 Active 94 DOM
-
2026-06-05days on market $49,900 Active 91 DOM
-
2026-06-02days on market $49,900 Active 89 DOM
-
2026-06-01days on market $49,900 Active 88 DOM
-
2026-05-31days on market $49,900 Active 87 DOM
-
2026-05-30days on market $49,900 Active 86 DOM
-
2026-03-03$49,900 Active 451-char remark
Show marketing remark (451 chars)
Retirement community park located in beautiful Lakeview in Bull Shoals Lake area. This 2009 2 bedroom, 2 bathroom home features open concept living with all luxury vinyl flooring throughout, lots of kitchen cabinets, Stainless Steel range, dishwasher and washer and dryer hookups, enjoy update bathrooms with all neutral colors. There are no neighbors located behind you, just lovely wooded views. Enjoy the tasteful color scheme and roomy floorplan.
ⓘ Source: listings_history table (triggers on properties + properties_extension) + one-shot
backfill from property_details.listing_events for pre-trigger history.
Climate risk First Street
- Flood 1/10 Low FEMA zone X (unshaded) · 0% chance over 30 yrs
- Wildfire 5/10 Major
- Heat 4/10 Moderate 7 d/yr ≥107°F today · 20 d/yr by 30 yrs out
- Wind 2/10 Low 0% chance of damaging wind over 30 yrs
- Air quality 1/10 Low 0 unhealthy d/yr today · 0 by 30 yrs out
Nearby sold comps map
Loading sold comps map…
Walkable amenities ~0.75 mi
Loading nearby amenities…
Taxation est. · year 1
- Rental income
- $10,646
- − Mortgage interest
- −$2,571
- − Property taxes
- −$688
- − Insurance
- −$230
- − Repairs & maintenance
- −$852
- − Management
- −$852
- − Depreciation
- −$1,335
- Taxable income
- $4,119
- Est. tax owed @ 24.0%
- −$988
- After-tax cash flow
- $3,616/yr
For passive investors: Depreciation is non-cash, so a rental often shows a tax loss while cash-flowing — sheltering income. Rental losses are passive: they offset passive income freely, and up to $25,000/yr can offset ordinary (W-2) income if you actively participate and your MAGI is under $100k (phasing out to $0 by $150k); unused losses carry forward. On sale, claimed depreciation is recaptured at up to 25%, and gains may owe capital-gains tax (a 1031 exchange can defer both). Figures are a year-1 estimate at your 24.0% rate — not tax advice; consult a CPA.
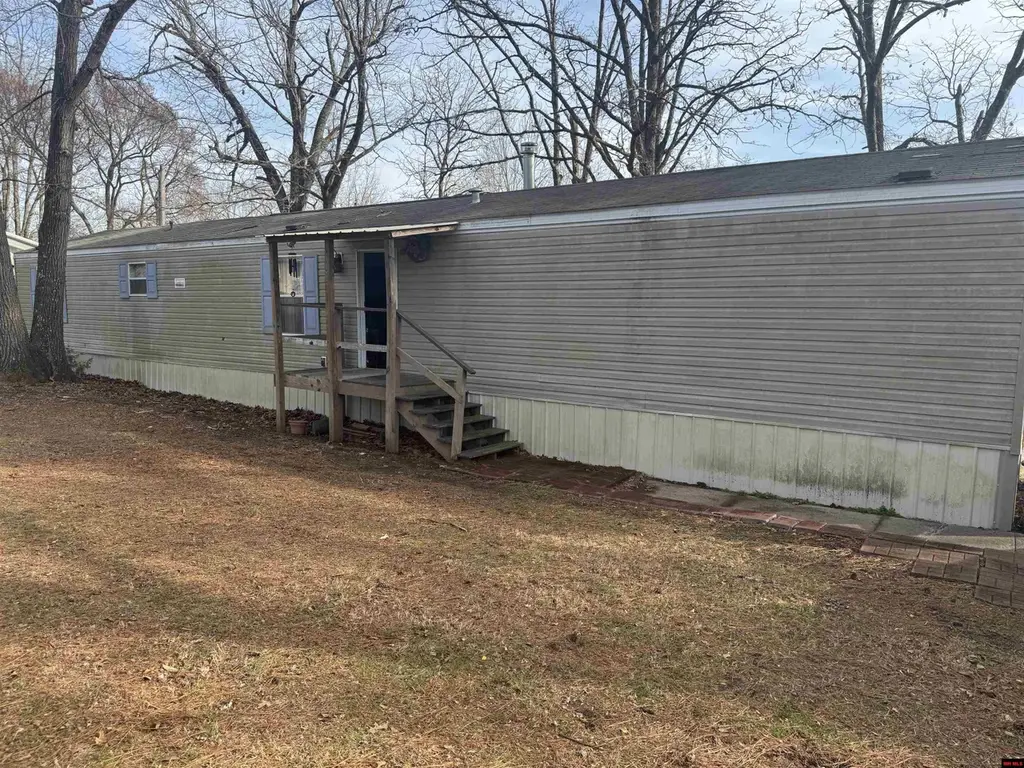
Condition & rehab AI · 13 photos
The home requires moderate repairs and maintenance, particularly to the exterior and landscaping, to improve its overall condition and value.
Repairs flagged
- Moderate Siding — Weathered appearance
- Moderate Exterior paint — Needs touch-up
Value-add opportunities
- Both Paint exterior and landscaping — Enhances curb appeal and resale value
- Both Replace siding — Improves appearance and value
- Both Replace flooring — Freshens up the interior and improves resale value
Renovation cost estimate screening
| Repair item | Severity | Est. cost |
|---|---|---|
| Siding · Weathered appearance | Moderate | $3,000–15,000 |
| Exterior paint · Needs touch-up | Moderate | $3,000–15,000 |
| Total estimated repair cost · 2 items | $6,000–30,000 |
Value-add ROI direction
- Both Paint exterior and landscaping — Enhances curb appeal and resale value ↑
- Both Replace siding — Improves appearance and value ↑
- Both Replace flooring — Freshens up the interior and improves resale value ↑
ⓘ Cost ranges are severity-bucket heuristics (US national rule-of-thumb). Get contractor quotes + a written scope before underwriting a rehab budget.
Schools (NCES district)
- District
- Mountain Home School District
- NCES district ID
- 0500043
- Math proficiency
- 45% ▼ -8.00%
- Reading proficiency
- 45% ▼ -4.00%
- Median HH income
- $36,966
- Composite
- 37.4/100
- National rank
- #4424
- State rank
- #40 of 238 in AR
Livability — Midway
- Score
- 66/100
- State rank
- #139
- US rank
- #12379
Category grades
Schools grade is shown separately in the Schools card above.
Census & demographics
- City population
- 1,422
- Population (ZIP)
- 1,724
Population outlook (Baxter County) Hauer SSP2
- Today (2025)
- 39,886 people
- By 2030
- 39,226 · -1.7%
- By 2040
- 37,810 · -5.2%
- By 2050
- 36,287 · -9.0%
- By 2075
- 32,965 · -17.4%
- By 2100
- 28,002 · -29.8%
Race, ethnicity, and origin ACS 2023
- Neighborhood character
- Predominantly White (94%)
- Race & ethnicity
- White 94% Two or more races 4% Hispanic / Latino 2%
- Common ancestry
- Romanian 5% Serbian 4% Lithuanian 3%
- Foreign-born
- 3% · Canada
- Languages at home
- 98% English-only · Spanish 1%
Political lean MEDSL · Baxter
- 2024 margin
- Solid R (+56.9) · D 20.7% · R 77.6% · Other 1.7%
- 2008→2024 swing
- -25.3pp toward R · 2008: -31.6pp · 2024: -56.9pp
- All cycles
- 2024: R+56.9 2020: R+53.3 2016: R+53.6 2012: R+44.0 2008: R+31.6
Not yet ingested
- Civics
- —
Market trends
- HPI YoY
- ▲ 13.66%
- Current HPI
- 237.0425
- Rent YoY
- —
- Metro
- —
- State GDP YoY
- ▲ 3.80%
- F500 in state
- 10
Industry mix (Fortune 500 HQ in AR)
| Industry | F500 HQs | Revenue |
|---|---|---|
| Retail | 1 | $681B |
|
||
| Food / Agriculture | 1 | $53B |
|
||
| Retail / Energy | 1 | $22B |
|
||
| Transportation / Logistics | 1 | $12B |
|
||
| Energy | 1 | $4B |
|
||
Price history
1 event — show timeline
- 2026-03-03 Listed $49,900 MHMLS
Cash-flow waterfall
monthlySold comps — $/sqft
last 12 mo · ≤1 miLoading sold comps…