5300 NW 87th Ave #706 · Doral, FL
Flood risk 1/10 · Minimal
- FEMA flood zone
- AH
- Chance of flooding over 30 yrs
- 0.0%
- Est. flood insurance / yr
- $1,142 – $2,507
Fire risk 2/10 · Minimal
- Est. fire insurance / yr
- $947 – $1,759
Heat risk 9/10 · Severe
- Hot days now (above 106°F)
- 7 days/yr
- Hot days in 30 yrs
- 28 days/yr
Wind risk 10/10 · Severe
- Chance of severe wind over 30 yrs
- 99.0%
Air-quality risk 2/10 · Minimal
- Unhealthy air days now
- 1 days/yr
- Unhealthy air days in 30 yrs
- 1 days/yr
Risk factors via First Street. Map © Google.
Why this score? — see what drove the C+ grade
The composite is a weighted blend of 9 inputs, each scored 0–100. Each bar is that input's sub-score; the figure is the points it added to the 100-point composite (weight × sub-score).
- Cash flow +18.9/30.0
- 1% rule +10.0/10.0
- ARV discount +7.5/15.0
- DSCR +6.0/10.0
- Appreciation +4.9/10.0
- Schools +4.2/10.0
- Livability +4.0/5.0
- Condition / age +2.5/5.0
- Rent growth +2.2/5.0
$117,800
🖨 Deal sheet 📄 Offer letter ✓ Due diligence
Listing remarks
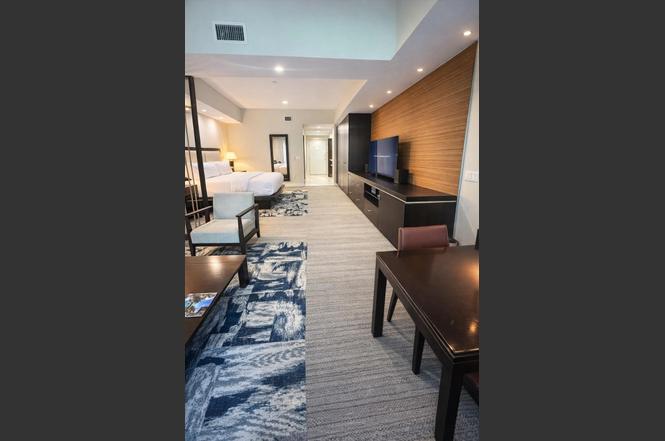
FIRST FLOOR PRIVATE ENTRANCE Fully Furnished Studio with Private Balcony in the heart of Downtown Doral, unit is part of the hotel-resort program, offering an excellent opportunity to generate immediate rental income. Owners & guests enjoy full resort style amenities, including a spa with massage and beauty services, a fully equipped 24-hour fitness center, an on-site restaurant, and a spectacular resort-style pool. Condo Association fees cover all amenities and utilities such as electricity, hot water, cable, Wi-Fi, 24-hour security, insurance, making it a hassle-free investment, Waling Distance to Downtown Doral, Trump National Doral Hotel & Golf Course, City Place Doral, Mia
Key facts
- Private balcony
- Private entrance
- On-site restaurant
Tags
Property features AI
Finance
- Other: Pets allowed with no restrictions
- HOA & community: Monthly HOA fee; Association amenities include clubhouse, fitness center, golf course access, playground, pool, internet included, lobby, security, and maintenance; HOA covers electricity, grounds and structure maintenance, common areas, elevator, HVAC maintenance, and recreation facility
Exterior
- Parking: Guest parking; Open parking
- Security: Security guard; Security fence; Attended lobby; Security patrol
- Utilities: Cable available
- Home design: Condominium/Unit in a 2-story building; Resale property
- Construction: CBS construction
- Exterior features: Fenced; Located on a golf course
Interior
- Kitchen: Dishwasher; Electric range; Microwave; Refrigerator
- Bedrooms: 1 bedroom on main level
- Flooring: Carpet; Ceramic tile
- Bathrooms: 1 full bathroom
- Heating & cooling: Central heating; Central air conditioning
- Interior features: Split bedroom layout; Furnished
Neighborhood map
What this means for you Summary
Snapshot
- This is a 1-bed/1.0-bath condo listed at $118k.
Deal economics
- At list price, monthly cash flow is $-32 ($-378/yr) — negative.
- To cash-flow at today's rent, offer at most $112k (4.7% below list).
- Meets the 1% rule at list price ($3k rent vs $118k).
- Recommended offer: $107k (9.0% below list) — sets the bar for market timing.
- Cap rate 7.5% vs local median 2.8% in Doral — top-decile yield for the area; either an underpriced asset or a hidden risk that comps aren't pricing in. Stress-test before assuming the spread holds.
Location & tenants
- Location reads 80/100 on livability (#122 in FL, #1,868 nationally) — a professional / high-income tenant draw. Strengths: crime A+, commute A+, employment A+; Watch: amenities D, cost of living F.
- Miami-Dade (suburban): math 45% / reading 54% proficiency, ranked #40 of 73 in FL (top 55%) — families likely to look elsewhere, expect single-tenant / working-renter base with shorter leases; 64% free/reduced lunch — lower-income household profile, screen leases tightly.
- Zoned schools: John I. Smith K-8 Center (math 57% / reading 58%, grade C+, #764 of 2,144 statewide, top 36%, 1,001 students, 31% FRL); Ruben Dario Middle School (math 32% / reading 45%, grade F, #384 of 571 statewide, top 68%, 549 students, 62% FRL); Ronald W. Reagan/Doral Senior High School (math 23% / reading 45%, grade F, #394 of 667 statewide, top 60%, 1,591 students, 30% FRL) — zoned schools average 41% FRL vs 64% district-wide (23 pts lower); this property's tenant base skews higher-income than the district average.
- Market conditions: Rents soft (-1.1%/yr); 478 active listings in the ZIP; 36 comparable units currently listed for rent nearby; rentals leasing fast (median 5d on market — plan ~1-2 weeks tenant-placement turnaround); solid renter incomes; 10,051 units permitted in Miami-Dade County in 2024 (7,758 in 5+ unit buildings).
- This rent runs 31% of the median local income ($97k/yr) — at the standard rent-burdened threshold; future hikes will face affordability resistance.
Forward outlook
- In year one you build about $512 of equity ($814 loan paydown + $-302 appreciation (-0.3% local appreciation)).
- Miami-Dade County population projected at +28% by 2050 — long-run rental-demand tailwind backs the buy-and-hold thesis.
Negotiation context
- It's been on market 99 days — a 9% lower offer ($107k) is reasonable based on typical stale-listing flexibility.
- 4 sale attempts since 4y ago; this cycle's ask has dropped $11k (9%) from the opening price — seller is motivated, your offer sets the floor, not the list.
- Current owner paid $90k; 31% above their basis — modest negotiation headroom, anchor on the comps not their cost.
Risks & watch-outs
- Watch-outs: flood insurance adds $152/mo; HOA is 42% of rent.
- Climate carrying-cost: in FEMA flood zone AH (mandatory federal flood insurance); severe wind risk, 99% chance of damaging wind over 30y; extreme-heat days projected 7→28/yr by 2055 (HVAC capex compounding) — expect insurance premiums to compound above CPI over the hold.
Questions for the listing agent
- What do current leases actually rent for vs. the listed asking? Can we see a recent rent roll and the last 12 months of T-12 income?
- It's been on market 99 days. Have you received any prior offers? Is the seller open to a 9% concession, seller financing, or rate buy-down credit?
- What's the actual annual flood-insurance premium (NFIP or private), and is the property in a SFHA with mandatory coverage?
- What does the HOA fee cover, when was the last increase, and are there any pending special assessments or reserve-fund shortfalls?
- Any open or pending special assessments — roof, HVAC, plumbing, elevator, façade? What's the per-unit balance and payoff schedule, and is the seller paying it off at close or rolling it to the buyer?
- Why hasn't it sold? Are there any deal-killer items the seller is aware of (foundation, flood, title, zoning, code violations)?
- Is there a deadline driving the sale (1031 exchange, divorce, estate, relocation)? That informs how much negotiation room exists.
- Schools are A-rated — typically a magnet for longer-tenancy family renters. What's the average tenant stay here, and is there a school-zone premium baked into asking?
- What's the average days-on-market for RENTAL listings here right now (not sales)? A rising rental-DOM trend means longer vacancies and softer asking-rent achievability than the comps imply.
- What's the recent tenant-quality profile in this submarket — average credit score on applications, eviction rate, late-payment / NSF rate, and stable-employment percentage? A property-management company in the area should have these aggregated.
- How much new apartment / multifamily construction is in the pipeline within 1–3 miles? Heavy new supply (>2% of stock underway) typically softens rents 12–24 months out; light construction supports rent growth.
Investment metrics
- 1% rule
- 2.14% ✓
- Cap rate
- 7.52%
- Cash-on-cash
- 4.38%
- DSCR
- 1.20
- GRM
- 3.9
CMA / ARV
No comps found within radius.
Projected returns pro-forma
-0.26% appreciation · 0.0% rent growth · sell at horizon
- IRR
- -9.3%
- Equity multiple
- 0.59×
- Total profit
- $-13,460
- Equity at exit
- $32,702
- IRR
- -9.2%
- Equity multiple
- 0.22×
- Total profit
- $-25,754
- Equity at exit
- $38,129
Cash invested: $32,984 (down + closing). Projections, not guarantees.
Landlord ↔ Tenant lean methodology
- Overall (STATE)
- 87 Strongly Landlord-Friendly
- State Florida
- 87 Strongly Landlord-Friendly · R+3
- County
- — inherits STATE
- City
- — inherits STATE
ZIP-level market 33178
- Home prices YoY
- -0.1%
- Rents YoY
- -1.1%
- Active inventory
- 478
- Price-to-rent
- 3.9×
Monthly cashflow live
- Estimated rent
- $2,515 high interval (Pro) →
- Mortgage (P&I)
- −$618
- Tax from tax record
- −$144 /mo · $1,722/yr
- Insurance
- −$49
- Flood insurance flood zone
- −$152 /mo · $1,824/yr
- HOA
- −$1,056
- Vacancy / Maint / Mgmt
- −$528
- Net cashflow
- $-32
Break-even live
UW: 25.0% down · 7.5% · 30yr · 1.5% tax · 5.0% vac · 8.0% maint · 8.0% mgmt
Financing live
Cash to close
- Down payment
- $29,450
- Closing costs
- $3,534
- Reserves months
- —
- Total cash needed
- —
Loan-product check · same deal, 3 products live
Conventional
25% down · 7.5% · 30yr
- Down + closing
- —
- Monthly P&I
- —
- Monthly cashflow
- —
- DSCR
- —
- Eligible?
- —
Personal DTI + credit; lowest rate.
DSCR
20% down · 8.5% · 30yr
- Down + closing
- —
- Monthly P&I
- —
- Monthly cashflow
- —
- DSCR
- —
- Eligible?
- —
No personal income docs; deal must DSCR.
Hard money
10% down · 12.0% · 12mo
- Down + closing
- —
- Monthly P&I
- —
- Monthly cashflow
- —
- DSCR
- —
- Eligible?
- —
Short-term bridge; refi at stabilization.
Rent comps 36 comps
| Address | Beds | Baths | Sqft | Rent | $/sqft | DOM | Units | Dist |
|---|---|---|---|---|---|---|---|---|
| 5300 Paseo Blvd Unit 1007 Doral, FL | 1.0 | 1.0 | 698 | $2,700 | $3.87 | 3d | 1 | 0.11mi |
| 5300 Paseo Blvd Doral, FL | 1.0–2.0 | 1.0–2.0 | 900 | $2,600 | $2.89 | 2d | 4 | 0.11mi |
| 5300 Paseo Blvd Doral, FL | 1.0–2.0 | 1.0–2.0 | 900 | $2,700 | $3.00 | 8d | 3 | 0.11mi |
| 5252 NW 85th Ave Doral, FL | 1.0–3.0 | 1.0–2.0 | 1008 | $2,650 | $2.63 | 18d | 6 | 0.16mi |
| 5252 NW 85th Ave Doral, FL | 1.0–2.0 | 1.0–2.0 | 870 | $2,700 | $3.10 | 2d | 5 | 0.16mi |
| 5350 NW 84th Ave Doral, FL | 2.0 | 1.0–2.0 | 904 | $3,750 | $4.15 | 2d | 9 | 0.20mi |
| 5350 NW 84th Ave Unit 1022290P Doral, FL | 1.0 | 1.0 | 656 | $3,880 | $5.91 | 14d | 1 | 0.20mi |
| 5250 NW 84th Ave Doral, FL | 1.0–3.0 | 1.0–2.0 | 979 | $2,458 | $2.51 | 2d | 37 | 0.24mi |
| 4760 NW 85th Ave Miami, FL | 2.0 | 1.0–2.0 | 934 | $2,988 | $3.20 | 3d | 17 | 0.31mi |
| 8290 Lake Dr Doral, FL | 1.0–2.0 | 1.0–2.0 | 873 | $1,950 | $2.23 | 2d | 3 | 0.41mi |
| 8290 Lake Dr Doral, FL | 1.0–2.0 | 1.0–2.0 | 873 | $2,000 | $2.29 | 3d | 3 | 0.41mi |
| 4740 NW 84th Ct Unit 43A Doral, FL | — | 1.0 | 600 | $1,690 | $2.82 | 13d | 1 | 0.43mi |
| 4740 NW 84th Ave Miami, FL | — | 1.0 | 600 | $1,690 | $2.82 | 17d | 1 | 0.43mi |
| 8150 NW 53rd St Doral, FL | 1.0–3.0 | 1.0–2.0 | 999 | $2,467 | $2.47 | 2d | 19 | 0.53mi |
| 8160 Geneva Ct Doral, FL | 1.0 | 1.0 | 710 | $1,950 | $2.75 | 8d | 4 | 0.58mi |
| 8100 Geneva Ct Doral, FL | 1.0–2.0 | 1.0–2.0 | 851 | $2,000 | $2.35 | 8d | 1 | 0.65mi |
| 8100 Geneva Ct Doral, FL | 1.0–2.0 | 1.0–2.0 | 851 | $1,875 | $2.20 | 4d | 2 | 0.65mi |
| 8100 Geneva Ct #233 Doral, FL | 1.0 | 1.0 | 710 | $1,950 | $2.75 | 17d | 1 | 0.66mi |
| 8100 Geneva Ct #345 Doral, FL | 1.0 | 1.0 | 710 | $2,000 | $2.82 | 15d | 1 | 0.66mi |
| 8803 NW 41st St Unit 8803 Doral, FL | 1.0 | 1.0 | 738 | $2,259 | $3.06 | 24d | 1 | 0.67mi |
| 8425 NW 41st St Doral, FL | 3.0 | 1.0–2.0 | 945 | $2,868 | $3.03 | 2d | 38 | 0.68mi |
| 8800 NW 36th St #14 Doral, FL | 1.0 | 1.0 | 706 | $3,140 | $4.45 | 21d | 1 | 0.77mi |
| 8902 Doral Blvd Unit 402 Doral, FL | 1.0 | 1.0 | 720 | $2,250 | $3.12 | 8d | 1 | 0.78mi |
| 8800 Doral Blvd Doral, FL | 3.0 | 1.0–2.0 | 977 | $2,703 | $2.77 | 2d | 42 | 0.79mi |
| 4400 NW 79th Ave Doral, FL | 1.0–3.0 | 1.0–2.0 | 900 | $2,081 | $2.31 | 2d | 5 | 0.86mi |
| 3555 NW 83rd Ave Doral, FL | 2.0 | 1.0–2.0 | 848 | $2,620 | $3.09 | 1d | 36 | 0.95mi |
| 8401 NW 34th Ter Doral, FL | 2.0 | 1.0–2.0 | 840 | $2,974 | $3.54 | 2d | 24 | 0.99mi |
| 9400 NW 41st St Doral, FL | 1.0–2.0 | 1.0–2.0 | 916 | $2,474 | $2.70 | 2d | 8 | 1.01mi |
| 3300 NW 87th Ave Unit 309 Doral, FL | — | 1.0 | 520 | $2,150 | $4.13 | 8d | 1 | 1.04mi |
| 3450 NW 85th Ct Doral, FL | 3.0 | 1.0–2.0 | 971 | $2,511 | $2.59 | 1d | 29 | 1.04mi |
| 3940 NW 79th Ave Doral, FL | 3.0 | 1.0–3.0 | 1040 | $2,793 | $2.69 | 4d | 1 | 1.05mi |
| 9480 NW 41st St Unit 3542 Doral, FL | 1.0 | 1.0 | 702 | $2,257 | $3.22 | 3d | 1 | 1.05mi |
| 3368 NW 84th Ave Miami, FL | 1.0 | 1.0 | 700 | $2,319 | $3.31 | 8d | 1 | 1.10mi |
| 8430 NW 33rd Ter Unit 33 Doral, FL | 1.0 | 1.0 | 715 | $2,400 | $3.36 | 8d | 1 | 1.12mi |
| 7902 NW 36th St Unit 705 Miami, FL | — | 1.0 | 525 | $2,150 | $4.10 | 8d | 1 | 1.13mi |
| 10000 NW 45th Ter Doral, FL | 1.0–3.0 | 1.0–3.0 | 1088 | $2,125 | $1.95 | 2d | 22 | 1.40mi |
HOA detail condo
- Monthly dues
- $1,056 · $12,672/yr
- Likely covers
- waterelectricinternetcablepoolgymsecurity
- Assessments
- None detected in remarks — confirm with the listing agent.
Listing history 22 events
-
2026-06-18days on market $117,800 Active 99 DOM
-
2026-06-17days on market $117,800 Active 98 DOM
-
2026-06-16days on market $117,800 Active 97 DOM
-
2026-06-15days on market $117,800 Active 96 DOM
-
2026-06-13days on market $117,800 Active 94 DOM
-
2026-06-09days on market $117,800 Active 90 DOM
-
2026-06-08days on market $117,800 Active 89 DOM
-
2026-06-07days on market $117,800 Active 88 DOM
-
2026-06-04days on market $117,800 Active 85 DOM
-
2026-06-03days on market $117,800 Active 84 DOM
-
2026-06-02pricedays on market $117,800 Active 83 DOM
-
2026-06-01days on market $129,000 Active 82 DOM
-
2026-05-31days on market $129,000 Active 81 DOM
-
2026-02-24$129,000 Active
-
2025-02-01historical
-
2024-03-18price $160,000
-
2024-02-02$175,000 Active
-
2023-07-29historical
-
2022-07-29$199,900
-
2022-02-28soldstatus $90,000 Closed
-
2022-02-11historical Active Under Contract
-
2022-01-20$99,000 Active
ⓘ Source: listings_history table (triggers on properties + properties_extension) + one-shot
backfill from property_details.listing_events for pre-trigger history.
Tax reassessment forecast FL · Resets to sale price
- Current annual tax
- $1,722 · $144/mo
- Projected year-2 tax
- $1,722 · $144/mo
- Expected delta
- $0/yr ($0/mo · 0.0%)
ⓘ Screening estimate from a state-policy table — verify with the county assessor before closing.
Climate risk First Street
- Flood 1/10 Low FEMA zone AH · 0% chance over 30 yrs
- Wildfire 2/10 Low
- Heat 9/10 Extreme 7 d/yr ≥106°F today · 28 d/yr by 30 yrs out
- Wind 10/10 Extreme 99% chance of damaging wind over 30 yrs
- Air quality 2/10 Low 1 unhealthy d/yr today · 1 by 30 yrs out
Nearby sold comps map
Loading sold comps map…
Walkable amenities ~0.75 mi
Loading nearby amenities…
Taxation est. · year 1
- Rental income
- $30,180
- − Mortgage interest
- −$6,599
- − Property taxes
- −$1,722
- − Insurance
- −$2,414
- − Repairs & maintenance
- −$2,414
- − Management
- −$2,414
- − HOA
- −$12,672
- − Depreciation
- −$3,427
- Taxable loss
- −$1,482
- Est. tax savings @ 24.0%
- +$356
- After-tax cash flow
- $-23/yr
For passive investors: Depreciation is non-cash, so a rental often shows a tax loss while cash-flowing — sheltering income. Rental losses are passive: they offset passive income freely, and up to $25,000/yr can offset ordinary (W-2) income if you actively participate and your MAGI is under $100k (phasing out to $0 by $150k); unused losses carry forward. On sale, claimed depreciation is recaptured at up to 25%, and gains may owe capital-gains tax (a 1031 exchange can defer both). Figures are a year-1 estimate at your 24.0% rate — not tax advice; consult a CPA.
Schools (NCES district)
- District
- Miami-Dade
- NCES district ID
- 1200390
- Math proficiency
- 45% ▼ -16.00%
- Reading proficiency
- 54% ▼ -5.00%
- Median HH income
- $43,928
- Composite
- 41.76/100
- National rank
- #3397
- State rank
- #40 of 73 in FL
Livability — Doral
- Score
- 80/100
- State rank
- #122
- US rank
- #1868
Category grades
Schools grade is shown separately in the Schools card above.
Census & demographics
- Census place
- Doral, FL
- County
- Miami-Dade County · 2,697,751 people
- City population
- 67,789
- Metro
- Miami-Fort Lauderdale-Pompano Beach, FL
- Population (ZIP)
- 67,789
- Household income
- $96,653
- Rent vs Own
- Severe rent burden
- 3658.0
Population outlook (Miami-Dade County) Hauer SSP2
- Today (2025)
- 3,126,439 people
- By 2030
- 3,325,765 · +6.4%
- By 2040
- 3,697,561 · +18.3%
- By 2050
- 4,012,134 · +28.3%
- By 2075
- 4,605,612 · +47.3%
- By 2100
- 4,866,598 · +55.7%
Race, ethnicity, and origin ACS 2023
- Neighborhood character
- Predominantly Hispanic (83%)
- Race & ethnicity
- Hispanic / Latino 83% Two or more races 34% White 11% Asian 2% Black 2%
- Hispanic origin (detail)
- Mexican 2% Puerto Rican 3% Cuban 8% Dominican 3% Salvadoran 2%
- Common ancestry
- Estonian 2% Russian 1% Italian 1%
- Foreign-born
- 69% · Canada, Jamaica, Dominican Republic
- Languages at home
- 12% English-only · Spanish 82% Other Indo-European 4% Other Asian/Pacific 1%
Political lean MEDSL · Miami-Dade
- 2024 margin
- R (+11.4) · D 43.9% · R 55.4%
- 2008→2024 swing
- -27.6pp toward R · 2008: 16.1pp · 2024: -11.4pp
- All cycles
- 2024: R+11.4 2020: D+7.3 2016: D+29.6 2012: D+23.7 2008: D+16.1
Not yet ingested
- Civics
- —
Market trends
- HPI YoY
- ▼ -0.26%
- Current HPI
- 310.2015
- Rent YoY
- ▼ -1.09%
- Metro
- Miami-Fort Lauderdale-Pompano Beach, FL
- State GDP YoY
- ▲ 3.28%
- F500 in state
- 36
Industry mix (Fortune 500 HQ in FL)
| Industry | F500 HQs | Revenue |
|---|---|---|
| Industrial Technology | 2 | $29B |
|
||
| Insurance | 2 | $17B |
|
||
| Retail | 1 | $60B |
|
||
| Technology Distribution | 1 | $58B |
|
||
| Homebuilding | 1 | $35B |
|
||
| Technology Manufacturing | 1 | $35B |
|
||
Price history
+30.3% since first listed9 events — show timeline
- 2026-02-24 Listed $129,000 Beaches MLS
- 2025-02-01 Listing Removed — MARMLS
- 2024-03-18 Price Changed $160,000 MARMLS
- 2024-02-02 Listed $175,000 MARMLS
- 2023-07-29 Listing Removed — Beaches MLS
- 2022-07-29 Listed $199,900 Beaches MLS
- 2022-02-28 Sold (MLS) $90,000 MARMLS
- 2022-02-11 Contingent — MARMLS
- 2022-01-20 Listed $99,000 MARMLS
Property tax history
-5.4%/yrLatest (2025): $1,722 · -9.6% YoY. Source: county tax records.
Cash-flow waterfall
monthlySold comps — $/sqft
last 12 mo · ≤1 miLoading sold comps…