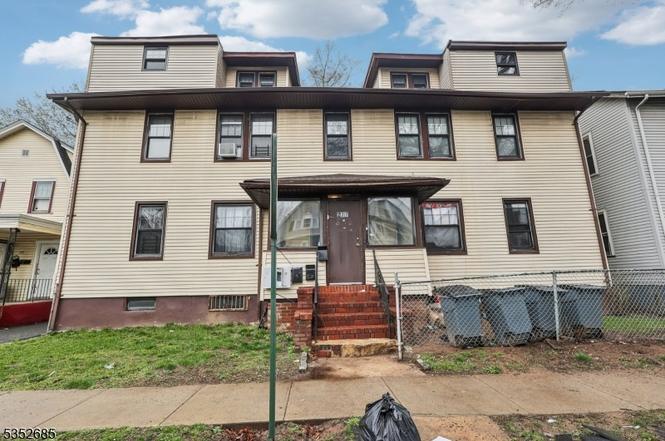
 Fourplex
277 S Clinton St #4 · East Orange, NJ
Flood risk 1/10 · Minimal
- FEMA flood zone
- X (unshaded)
- Chance of flooding over 30 yrs
- 0.0%
- Est. flood insurance / yr
- $507 – $1,088
Fire risk 1/10 · Minimal
- Est. fire insurance / yr
- $526 – $976
Heat risk 7/10 · Major
- Hot days now (above 100°F)
- 7 days/yr
- Hot days in 30 yrs
- 15 days/yr
Wind risk 6/10 · Moderate
- Chance of severe wind over 30 yrs
- 27.0%
Air-quality risk 4/10 · Minor
- Unhealthy air days now
- 3 days/yr
- Unhealthy air days in 30 yrs
- 5 days/yr
Risk factors via First Street. Map © Google.
Why this score? — see what drove the C grade
The composite is a weighted blend of 9 inputs, each scored 0–100. Each bar is that input's sub-score; the figure is the points it added to the 100-point composite (weight × sub-score).
- Cash flow +23.3/30.0
- DSCR +7.5/10.0
- ARV discount +7.5/15.0
- 1% rule +6.1/10.0
- Appreciation +5.0/10.0
- Livability +3.7/5.0
- Rent growth +2.5/5.0
- Condition / age +2.5/5.0
- Schools +1.6/10.0
$900,000
🖨 Deal sheet (PDF) 📄 Offer letter ✓ Due diligence
Multi-family units
County records classify this as Multi-Family (2-4 Unit). Listing-text estimate: 4 units. confirmed
Listing remarks
Investor's dream! Welcome to this well-maintained 4-family property offering strong rental income and loads of potential. Each of the four units features 2 spacious bedrooms and 1 full bathroom, ideal for tenants seeking comfortable, affordable living. Whether you're looking to expand your portfolio or house-hack by living in one unit and renting the rest, this property delivers consistent cash flow and long-term potential. Top floor has 2 additional bonus units making it a perfect addition to your real estate portfolio. With a strong rental history, this property offers a combination of reliable cash flow and great long-term investment potential.
Key facts
- 6,098 sq ft lot
- 5 parking spots
- Listed 53 days
Neighborhood map
What this means for you Summary
Snapshot
- This is a 4 × 2-bed/1.5-bath units multifamily listed at $900k.
Deal economics
- At list price, monthly cash flow is $2k ($20k/yr) — positive. Per door: $413/mo.
- The deal already cash-flows at list — no discount required.
- Meets the 1% rule at list price ($10k rent vs $900k).
- Recommended offer: $873k (3.0% below list) — sets the bar for market timing.
- Cap rate 8.5% vs local median 3.0% in East Orange — top-decile yield for the area; either an underpriced asset or a hidden risk that comps aren't pricing in. Stress-test before assuming the spread holds.
Location & tenants
- Location reads 73/100 on livability (#189 in NJ) — a middle-class / working-renter tenant base. Strengths: commute A+, health & safety A, housing A-; Watch: schools C-, crime D-, amenities F.
- East Orange School District (suburban): math 6% / reading 31% proficiency, ranked #444 of 472 in NJ (top 94%) — low school quality limits family demand, transient renter base, plan for 1-2y turnover; 63% free/reduced lunch — lower-income household profile, screen leases tightly.
- Market conditions: 1 active listings in the ZIP; 3,364 units permitted in Essex County in 2024 (2,551 in 5+ unit buildings).
Forward outlook
- In year one you build about $33k of equity ($6k loan paydown + $27k appreciation (3.0% local appreciation)).
- Essex County population projected at +3% by 2050 — modest demand growth; plan on rents tracking national, not racing it.
- At projected returns (3.0% appreciation + 3.0% rent growth), your $252k cash investment doubles in ~5 years — after that, you're playing with house money.
- By year 2, paydown + projected appreciation supports a ~$54k cash-out refi (75% LTV) — recoverable capital for the next deal without selling this one.
Negotiation context
- It's been on market 53 days — a 3% lower offer ($873k) is reasonable based on typical stale-listing flexibility.
Risks & watch-outs
- Climate carrying-cost: major wind risk, 27% chance of damaging wind over 30y; extreme-heat days projected 7→15/yr by 2055 (HVAC capex compounding) — expect insurance premiums to compound above CPI over the hold.
Questions for the listing agent
- It's been on market 53 days. Have you received any prior offers? Is the seller open to a 3% concession, seller financing, or rate buy-down credit?
- Can we see the unit-by-unit rent roll, current vacancy, and any below-market leases? What's the average tenancy length?
- What capital expenditures (roof, boiler, parking lot, exteriors) have been made in the last 5 years, and what's planned in the next 2?
- Is there a deadline driving the sale (1031 exchange, divorce, estate, relocation)? That informs how much negotiation room exists.
- Crime grade is D in this area — have there been break-ins, vandalism, or insurance claims at this property in the last 3 years? What carrier currently insures it and at what premium?
- What's the average days-on-market for RENTAL listings here right now (not sales)? A rising rental-DOM trend means longer vacancies and softer asking-rent achievability than the comps imply.
- What's the recent tenant-quality profile in this submarket — average credit score on applications, eviction rate, late-payment / NSF rate, and stable-employment percentage? A property-management company in the area should have these aggregated.
- How much new apartment / multifamily construction is in the pipeline within 1–3 miles? Heavy new supply (>2% of stock underway) typically softens rents 12–24 months out; light construction supports rent growth.
Investment metrics
- 1% rule
- 1.11% ✓
- Cap rate
- 8.50%
- Cash-on-cash
- 7.87%
- DSCR
- 1.35
- GRM
- 7.5
CMA / ARV
No comps found within radius.
Projected returns pro-forma
3.0% appreciation · 3.0% rent growth · sell at horizon
- IRR
- 14.9%
- Equity multiple
- 1.85×
- Total profit
- $213,777
- Equity at exit
- $404,679
- IRR
- 16.6%
- Equity multiple
- 3.44×
- Total profit
- $613,926
- Equity at exit
- $623,659
Cash invested: $252,000 (down + closing). Projections, not guarantees.
Landlord ↔ Tenant lean methodology
- Overall (STATE)
- 21 Tenant-Leaning
- State New Jersey
- 21 Tenant-Leaning · D+6
- County
- — inherits STATE
- City
- — inherits STATE
ZIP-level market 07018-2595
- Active inventory
- 1
- Price-to-rent
- 30.1×
Monthly cashflow live
- Estimated rent
- $9,964 high interval (Pro) →
- Mortgage (P&I)
- −$4,720
- Tax est. 1.5%
- −$1,125 /mo · $13,500/yr
- Insurance
- −$375
- HOA
- −$0
- Vacancy / Maint / Mgmt
- −$2,092
- Net cashflow
- $1,652
Break-even live
Sensitivity live
| Price | -10% $2,274 | -5% $1,963 | +0% $1,652 | +5% $1,341 | +10% $1,030 |
|---|---|---|---|---|---|
| Rent | -10% $865 | -5% $1,258 | +0% $1,652 | +5% $2,045 | +10% $2,439 |
| Rate | -1.0pp $2,105 | -0.5pp $1,881 | base $1,652 | +0.5pp $1,419 | +1.0pp $1,181 |
4-unit breakdown (identical units grouped — click to expand)
| Units | Beds | Baths | Est. rent |
|---|---|---|---|
| 4× units | 2 | 1.5 | $9,964 |
| #1 | 2 | 1.5 | $2,491 |
| #2 | 2 | 1.5 | $2,491 |
| #3 | 2 | 1.5 | $2,491 |
| #4 | 2 | 1.5 | $2,491 |
| Total (4 units) | $9,964 | ||
UW: 25.0% down · 7.5% · 30yr · 1.5% tax · 5.0% vac · 8.0% maint · 8.0% mgmt
Financing live
Cash to close
- Down payment
- $225,000
- Closing costs
- $27,000
- Reserves months
- —
- Total cash needed
- —
Loan-product check · same deal, 3 products live
Conventional
25% down · 7.5% · 30yr
- Down + closing
- —
- Monthly P&I
- —
- Monthly cashflow
- —
- DSCR
- —
- Eligible?
- —
Personal DTI + credit; lowest rate.
DSCR
20% down · 8.5% · 30yr
- Down + closing
- —
- Monthly P&I
- —
- Monthly cashflow
- —
- DSCR
- —
- Eligible?
- —
No personal income docs; deal must DSCR.
Hard money
10% down · 12.0% · 12mo
- Down + closing
- —
- Monthly P&I
- —
- Monthly cashflow
- —
- DSCR
- —
- Eligible?
- —
Short-term bridge; refi at stabilization.
Listing history 3 events
-
2025-06-15status Under Contract
-
2025-05-06price $900,000
-
2025-04-23$849,000 Active
ⓘ Source: listings_history table (triggers on properties + properties_extension) + one-shot
backfill from property_details.listing_events for pre-trigger history.
Climate risk First Street
- Flood 1/10 Low FEMA zone X (unshaded) · 0% chance over 30 yrs
- Wildfire 1/10 Low
- Heat 7/10 Severe 7 d/yr ≥100°F today · 15 d/yr by 30 yrs out
- Wind 6/10 Major 27% chance of damaging wind over 30 yrs
- Air quality 4/10 Moderate 3 unhealthy d/yr today · 5 by 30 yrs out
Nearby sold comps map
Loading sold comps map…
Walkable amenities ~0.75 mi
Loading nearby amenities…
Taxation est. · year 1
- Rental income
- $119,568
- − Mortgage interest
- −$50,414
- − Property taxes
- −$13,500
- − Insurance
- −$4,500
- − Repairs & maintenance
- −$9,565
- − Management
- −$9,565
- − Depreciation
- −$26,182
- Taxable income
- $5,841
- Est. tax owed @ 24.0%
- −$1,402
- After-tax cash flow
- $18,420/yr
For passive investors: Depreciation is non-cash, so a rental often shows a tax loss while cash-flowing — sheltering income. Rental losses are passive: they offset passive income freely, and up to $25,000/yr can offset ordinary (W-2) income if you actively participate and your MAGI is under $100k (phasing out to $0 by $150k); unused losses carry forward. On sale, claimed depreciation is recaptured at up to 25%, and gains may owe capital-gains tax (a 1031 exchange can defer both). Figures are a year-1 estimate at your 24.0% rate — not tax advice; consult a CPA.
Schools (NCES district)
- District
- East Orange School District
- NCES district ID
- 3404230
- Math proficiency
- 6% ▼ -11.00%
- Reading proficiency
- 31% ▼ -9.00%
- Median HH income
- $39,490
- Composite
- 15.56/100
- National rank
- #9295
- State rank
- #444 of 472 in NJ
Livability — East Orange
- Score
- 73/100
- State rank
- #189
- US rank
- #5261
Category grades
Schools grade is shown separately in the Schools card above.
Census & demographics
- Census place
- East Orange, NJ
Population outlook (Essex County) Hauer SSP2
- Today (2025)
- 825,042 people
- By 2030
- 834,010 · +1.1%
- By 2040
- 846,221 · +2.6%
- By 2050
- 850,047 · +3.0%
- By 2075
- 837,009 · +1.5%
- By 2100
- 784,345 · -4.9%
Not yet ingested
- Political lean
- —
- Race & ethnicity
- —
- Common origin
- —
- Civics
- —
Market trends
- HPI YoY
- —
- Current HPI
- —
- Rent YoY
- —
- Metro
- —
- State GDP YoY
- ▲ 2.05%
- F500 in state
- 34
Industry mix (Fortune 500 HQ in NJ)
| Industry | F500 HQs | Revenue |
|---|---|---|
| Consumer Goods | 3 | $31B |
|
||
| Pharmaceuticals | 2 | $153B |
|
||
| Technology | 2 | $21B |
|
||
| Insurance | 2 | $20B |
|
||
| Healthcare | 2 | $19B |
|
||
| Financial Services | 1 | $70B |
|
||
Price history
+6.0% since first listed3 events — show timeline
- 2025-06-15 Pending — GSMLS
- 2025-05-06 Price Changed $900,000 GSMLS
- 2025-04-23 Listed $849,000 GSMLS
Cash-flow waterfall
monthlySold comps — $/sqft
last 12 mo · ≤1 miLoading sold comps…