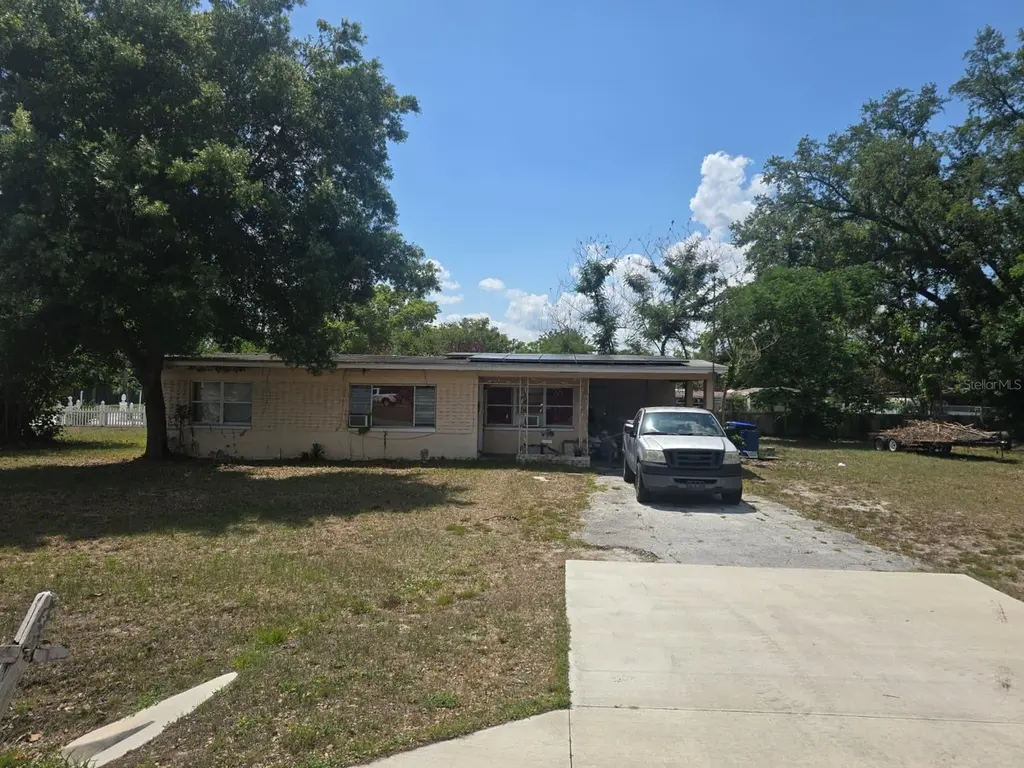
8324 Dawn Dr · Oak Ridge, FL
Flood risk 1/10 · Minimal
- FEMA flood zone
- X (unshaded)
- Chance of flooding over 30 yrs
- 0.0%
- Est. flood insurance / yr
- $507 – $1,088
Fire risk 2/10 · Minimal
- Est. fire insurance / yr
- $947 – $1,759
Heat risk 9/10 · Severe
- Hot days now (above 108°F)
- 7 days/yr
- Hot days in 30 yrs
- 22 days/yr
Wind risk 9/10 · Severe
- Chance of severe wind over 30 yrs
- 99.0%
Air-quality risk 1/10 · Minimal
- Unhealthy air days now
- 0 days/yr
- Unhealthy air days in 30 yrs
- 0 days/yr
Risk factors via First Street. Map © Google.
Why this score? — see what drove the D- grade
The composite is a weighted blend of 9 inputs, each scored 0–100. Each bar is that input's sub-score; the figure is the points it added to the 100-point composite (weight × sub-score).
- Cash flow +12.8/30.0
- Schools +4.1/10.0
- Livability +4.0/5.0
- DSCR +3.8/10.0
- 1% rule +3.4/10.0
- Condition / age +2.5/5.0
- ARV discount +2.4/15.0
- Rent growth +2.2/5.0
- Appreciation +0.0/10.0
$200,000
🖨 Deal sheet 📄 Offer letter ✓ Due diligence
Listing remarks
Excellent investor opportunity in a prime location. This property offers great potential for renovation and value appreciation. Property needs repairs and updating, making it ideal for investors, flippers, or buyers looking to customize and add value. Conveniently located near major roads, shopping, dining, and area attractions. Sold as-is.
Key facts
- 0.34 acre lot
- 2 parking spots
- Built 1956
Property features AI
Finance
- Other: Zoned R-1; Unfurnished; Property listed as residential; Universal property identifier available
- Financial info: Other annual assessment reported
- HOA & community: No HOA/association reported; CDD present
Exterior
- Parking: Carport with 2 spaces
- Utilities: Septic tank; Cable available; Electricity available and connected; Other utilities; Water source not specified; Solar energy generation
- Home design: Single Family Residence; One level; Faces east
- Construction: Block construction; Other roof type; Concrete perimeter foundation; Building area about 1,458 square feet
- Exterior features: Asphalt road surface; Quarter to half-acre lot (approximately 0.34 acres)
Interior
- Kitchen: No appliances included
- Bedrooms: 2 bedrooms
- Flooring: Parquet flooring
- Bathrooms: 1 full bathroom
- Heating & cooling: No heating; Other cooling
- Interior features: Other interior features
- Laundry & utility: No laundry features
Neighborhood map
What this means for you Summary
Snapshot
- This is a 2-bed/1.0-bath single-family listed at $200k.
Deal economics
- At list price, monthly cash flow is $-17 ($-202/yr) — negative.
- To cash-flow at today's rent, offer at most $197k (1.5% below list).
- To meet the 1% rule (rent ≥ 1% of price), the offer needs to be $167k (16.5% below list).
- Recommended offer: $167k (16.5% below list) — sets the bar for 1% rule.
Location & tenants
- Location reads 80/100 on livability (#115 in FL, #1,768 nationally) — a professional / high-income tenant draw. Strengths: commute A+, cost of living A+, housing A+; Watch: crime D+, employment D, amenities F.
- Orange (suburban): math 46% / reading 51% proficiency, ranked #43 of 73 in FL (top 59%) — families likely to look elsewhere, expect single-tenant / working-renter base with shorter leases.
- Zoned schools: Winegard Elementary (math 36% / reading 33%, grade F, #1,709 of 2,144 statewide, top 81%, 658 students, 75% FRL); Cypress Creek High (math 20% / reading 44%, grade F, #415 of 667 statewide, top 63%, 3,467 students, 43% FRL) — zoned schools at 59% FRL track the district average.
- Zoned-school proficiency averages 33% at this address vs 48% district-wide (-15 pts) — the specific schools serving this property underperform the Orange average; the district grade overstates school quality for this exact location.
- Market conditions: Rents soft (-1.1%/yr); 127 active listings in the ZIP; 20 comparable units currently listed for rent nearby; rentals at typical pace (median 22d on market — plan ~3-4 weeks tenant-placement turnaround); 8,053 units permitted in Orange County in 2024 (3,133 in 5+ unit buildings).
- This rent runs 35% of the median local income ($58k/yr) — at the standard rent-burdened threshold; future hikes will face affordability resistance.
Forward outlook
- Local home prices are declining (-3.0%/yr); year-one equity from $1k of loan paydown is wiped out by about $6k of value loss. Plan a longer hold.
- Orange County population projected at +52% by 2050 — long-run rental-demand tailwind backs the buy-and-hold thesis.
Negotiation context
- Only 1 days on market — expect competitive offers; lowballing is unlikely to land.
- Current owner paid $110k; list at $200k implies a 82% gain — meaningful room to come down on a strong offer.
Risks & watch-outs
- Watch-outs: built in 1956 — expect roof / HVAC / electrical / plumbing capex.
- Climate carrying-cost: severe wind risk, 99% chance of damaging wind over 30y; extreme-heat days projected 7→22/yr by 2055 (HVAC capex compounding) — expect insurance premiums to compound above CPI over the hold.
Questions for the listing agent
- What do current leases actually rent for vs. the listed asking? Can we see a recent rent roll and the last 12 months of T-12 income?
- Built in 1956 — when were the roof, HVAC, electrical panel, plumbing, and water heater last replaced?
- Is there a deadline driving the sale (1031 exchange, divorce, estate, relocation)? That informs how much negotiation room exists.
- Schools are B-rated — typically a magnet for longer-tenancy family renters. What's the average tenant stay here, and is there a school-zone premium baked into asking?
- Crime grade is D in this area — have there been break-ins, vandalism, or insurance claims at this property in the last 3 years? What carrier currently insures it and at what premium?
- The area grade is low — what's the realistic commute time and amenity access for the typical tenant pool here? Any planned neighborhood developments (good or bad) we should know about?
- What's the average days-on-market for RENTAL listings here right now (not sales)? A rising rental-DOM trend means longer vacancies and softer asking-rent achievability than the comps imply.
- What's the recent tenant-quality profile in this submarket — average credit score on applications, eviction rate, late-payment / NSF rate, and stable-employment percentage? A property-management company in the area should have these aggregated.
- How much new for-sale + rental construction is in the pipeline within 1–3 miles? Heavy new supply typically softens prices + rents 12–24 months out; constrained supply supports both.
Investment metrics
- 1% rule
- 0.84% ✗
- Cap rate
- 6.19%
- Cash-on-cash
- -0.36%
- DSCR
- 0.98
- GRM
- 10.0
CMA / ARV
- ARV (on-the-fly)
- $179,580
- Comps found
- 1
Show comp detail 1 sale within ~0.75 mi
| Address | Dist | Beds/Ba | Sqft | Sold | Price | $/sf | Match |
|---|---|---|---|---|---|---|---|
| 8324 Dawn Dr | 0.00mi | 2/1.0 | 1,095 (0%) | 0mo | $180,000 | $164 | 100 |
Match score weights: distance 35% · size 25% · config 20% · recency 20%. Top-matched comps best support the ARV.
Projected returns pro-forma
-3.0% appreciation · 0.0% rent growth · sell at horizon
- IRR
- -20.2%
- Equity multiple
- 0.31×
- Total profit
- $-38,379
- Equity at exit
- $29,821
- IRR
- -21.4%
- Equity multiple
- 0.04×
- Total profit
- $-53,734
- Equity at exit
- $17,292
Cash invested: $56,000 (down + closing). Projections, not guarantees.
Landlord ↔ Tenant lean methodology
- Overall (STATE)
- 87 Strongly Landlord-Friendly
- State Florida
- 87 Strongly Landlord-Friendly · R+3
- County
- — inherits STATE
- City
- — inherits STATE
ZIP-level market 32809
- Rents YoY
- -1.1%
- Active inventory
- 127
- Price-to-rent
- 10.0×
Monthly cashflow live
- Estimated rent
- $1,671 high interval (Pro) →
- Mortgage (P&I)
- −$1,049
- Tax from tax record
- −$205 /mo · $2,457/yr
- Insurance
- −$83
- HOA
- −$0
- Vacancy / Maint / Mgmt
- −$351
- Net cashflow
- $-17
Break-even live
UW: 25.0% down · 7.5% · 30yr · 1.5% tax · 5.0% vac · 8.0% maint · 8.0% mgmt
Financing live
Cash to close
- Down payment
- $50,000
- Closing costs
- $6,000
- Reserves months
- —
- Total cash needed
- —
Loan-product check · same deal, 3 products live
Conventional
25% down · 7.5% · 30yr
- Down + closing
- —
- Monthly P&I
- —
- Monthly cashflow
- —
- DSCR
- —
- Eligible?
- —
Personal DTI + credit; lowest rate.
DSCR
20% down · 8.5% · 30yr
- Down + closing
- —
- Monthly P&I
- —
- Monthly cashflow
- —
- DSCR
- —
- Eligible?
- —
No personal income docs; deal must DSCR.
Hard money
10% down · 12.0% · 12mo
- Down + closing
- —
- Monthly P&I
- —
- Monthly cashflow
- —
- DSCR
- —
- Eligible?
- —
Short-term bridge; refi at stabilization.
Rent comps 20 comps
| Address | Beds | Baths | Sqft | Rent | $/sqft | DOM | Units | Dist |
|---|---|---|---|---|---|---|---|---|
| 837 Sky Lake Cir Unit C Orlando, FL | 2.0 | 1.0 | 780 | $1,550 | $1.99 | 10d | 1 | 1.26mi |
| 830 Sky Lake Cir Orlando, FL | 2.0 | 1.0 | 780 | $1,350 | $1.73 | 24d | 1 | 1.26mi |
| 860 Sky Lake Cir Orlando, FL | 3.0 | 2.0 | 893 | $1,850 | $2.07 | 24d | 1 | 1.27mi |
| 860 Sky Lake Cir Unit C412 Orlando, FL | 3.0 | 2.0 | 893 | $1,750 | $1.96 | 3d | 1 | 1.27mi |
| 865 Sky Lake Cir Orlando, FL | 3.0 | 2.0 | 893 | $1,850 | $2.07 | 24d | 1 | 1.27mi |
| 827 Sky Lake Cir Orlando, FL | 2.0 | 1.0 | 793 | $1,400 | $1.77 | 24d | 1 | 1.29mi |
| 820 Isaacville Dr Orlando, FL | 2.0 | 2.0 | 1055 | $1,850 | $1.75 | 3d | 1 | 1.33mi |
| 820 Isaacville Dr Orlando, FL | 2.0 | 2.0 | 1155 | $1,850 | $1.60 | 15d | 1 | 1.33mi |
| 820 Isaacville Dr Orlando, FL | 2.0 | 2.0 | 756 | $1,900 | $2.51 | 20d | 1 | 1.33mi |
| 801 Sky Lake Cir Orlando, FL | 3.0 | 2.0 | 893 | $1,500 | $1.68 | 24d | 1 | 1.36mi |
| 746 McDougall Ct Unit G Orlando, FL | 2.0 | 2.0 | 700 | $1,335 | $1.91 | 24d | 1 | 1.36mi |
| 820 Isaacville Dr Apt 109 Orlando, FL | 1.0 | 1.0 | 756 | $1,600 | $2.12 | 11d | 1 | 1.37mi |
| 820 Isaacville Dr Unit 103 Orlando, FL | 2.0 | 2.0 | 1155 | $1,850 | $1.60 | 24d | 1 | 1.37mi |
| 820 Isaacville Dr Unit 203 Orlando, FL | 2.0 | 2.0 | 1155 | $1,850 | $1.60 | 20d | 1 | 1.37mi |
| 747 Wyman Ct #747 Orlando, FL | 2.0 | 2.0 | 700 | $1,350 | $1.93 | 24d | 1 | 1.39mi |
| 800 Isaacville Dr Unit 213 Orlando, FL | 2.0 | 2.0 | 1055 | $1,800 | $1.71 | 24d | 1 | 1.41mi |
| 800 Isaacville Dr Orlando, FL | 1.0 | 1.0 | 1055 | $1,600 | $1.52 | 22d | 1 | 1.42mi |
| 800 Isaacville Dr Orlando, FL | 1.0 | 1.0 | 756 | $1,600 | $2.12 | 3d | 1 | 1.42mi |
| 800 Isaacville Dr Orlando, FL | 3.0 | 2.0 | 1145 | $1,950 | $1.70 | 20d | 1 | 1.42mi |
| 800 Isaacville Dr Unit 315 Orlando, FL | 3.0 | 2.0 | 1145 | $1,950 | $1.70 | 22d | 1 | 1.44mi |
Listing history 3 events
-
2026-05-21status Pending
-
2026-05-20$200,000 Active
-
2007-02-09soldstatus $110,000
ⓘ Source: listings_history table (triggers on properties + properties_extension) + one-shot
backfill from property_details.listing_events for pre-trigger history.
Tax reassessment forecast FL · Resets to sale price
- Current annual tax
- $2,457 · $205/mo
- Projected year-2 tax
- $2,457 · $205/mo
- Expected delta
- $0/yr ($0/mo · 0.0%)
ⓘ Screening estimate from a state-policy table — verify with the county assessor before closing.
Climate risk First Street
- Flood 1/10 Low FEMA zone X (unshaded) · 0% chance over 30 yrs
- Wildfire 2/10 Low
- Heat 9/10 Extreme 7 d/yr ≥108°F today · 22 d/yr by 30 yrs out
- Wind 9/10 Extreme 99% chance of damaging wind over 30 yrs
- Air quality 1/10 Low 0 unhealthy d/yr today · 0 by 30 yrs out
Nearby sold comps map
Loading sold comps map…
Walkable amenities ~0.75 mi
Loading nearby amenities…
Taxation est. · year 1
- Rental income
- $20,051
- − Mortgage interest
- −$11,203
- − Property taxes
- −$2,457
- − Insurance
- −$1,000
- − Repairs & maintenance
- −$1,604
- − Management
- −$1,604
- − Depreciation
- −$5,818
- Taxable loss
- −$3,635
- Est. tax savings @ 24.0%
- +$872
- After-tax cash flow
- $671/yr
For passive investors: Depreciation is non-cash, so a rental often shows a tax loss while cash-flowing — sheltering income. Rental losses are passive: they offset passive income freely, and up to $25,000/yr can offset ordinary (W-2) income if you actively participate and your MAGI is under $100k (phasing out to $0 by $150k); unused losses carry forward. On sale, claimed depreciation is recaptured at up to 25%, and gains may owe capital-gains tax (a 1031 exchange can defer both). Figures are a year-1 estimate at your 24.0% rate — not tax advice; consult a CPA.
Schools (NCES district)
- District
- Orange
- NCES district ID
- 1201440
- Math proficiency
- 46% ▼ -9.00%
- Reading proficiency
- 51% ▼ -2.00%
- Median HH income
- $49,350
- Composite
- 41.47/100
- National rank
- #3461
- State rank
- #43 of 73 in FL
Livability — Oak Ridge
- Score
- 80/100
- State rank
- #115
- US rank
- #1768
Category grades
Schools grade is shown separately in the Schools card above.
Census & demographics
- County
- Orange County · 1,471,359 people
- Metro
- Orlando-Kissimmee-Sanford, FL
- Population (ZIP)
- 29,237
- Household income
- $57,879
- Rent vs Own
- Severe rent burden
- 1274.0
Population outlook (Orange County) Hauer SSP2
- Today (2025)
- 1,618,226 people
- By 2030
- 1,787,404 · +10.5%
- By 2040
- 2,125,621 · +31.4%
- By 2050
- 2,454,016 · +51.6%
- By 2075
- 3,173,711 · +96.1%
- By 2100
- 3,607,781 · +122.9%
Race, ethnicity, and origin ACS 2023
- Neighborhood character
- Diverse neighborhood (Simpson 0.58)
- Race & ethnicity
- Hispanic / Latino 59% Two or more races 22% White 22% Black 13% Asian 2%
- Hispanic origin (detail)
- Mexican 11% Puerto Rican 20% Cuban 6% Dominican 5%
- Common ancestry
- Hispanic 6% Lithuanian 1%
- Foreign-born
- 35% · Canada, Jamaica, Vietnam
- Languages at home
- 37% English-only · Spanish 53% French/Haitian/Cajun 7% Vietnamese 1%
Political lean MEDSL · Orange
- 2024 margin
- D (+13.6) · D 56.1% · R 42.5% · Other 1.3%
- 2008→2024 swing
- -5.0pp toward R · 2008: 18.6pp · 2024: 13.6pp
- All cycles
- 2024: D+13.6 2020: D+23.1 2016: D+24.6 2012: D+18.2 2008: D+18.6
Not yet ingested
- Civics
- —
Market trends
- HPI YoY
- ▼ -220.78%
- Current HPI
- 376.9662
- Rent YoY
- ▼ -1.06%
- Metro
- Orlando-Kissimmee-Sanford, FL
- State GDP YoY
- ▲ 3.28%
- F500 in state
- 36
Industry mix (Fortune 500 HQ in FL)
| Industry | F500 HQs | Revenue |
|---|---|---|
| Industrial Technology | 2 | $29B |
|
||
| Insurance | 2 | $17B |
|
||
| Retail | 1 | $60B |
|
||
| Technology Distribution | 1 | $58B |
|
||
| Homebuilding | 1 | $35B |
|
||
| Technology Manufacturing | 1 | $35B |
|
||
Price history
+81.8% since first listed3 events — show timeline
- 2026-05-21 Pending — Stellar MLS as Distributed by MLS Grid
- 2026-05-20 Listed $200,000 Stellar MLS as Distributed by MLS Grid
- 2007-02-09 Sold (Public Records) $110,000 Public Records
Property tax history
+7.6%/yrLatest (2025): $2,457 · +16.8% YoY. Source: county tax records.
Cash-flow waterfall
monthlySold comps — $/sqft
last 12 mo · ≤1 miLoading sold comps…