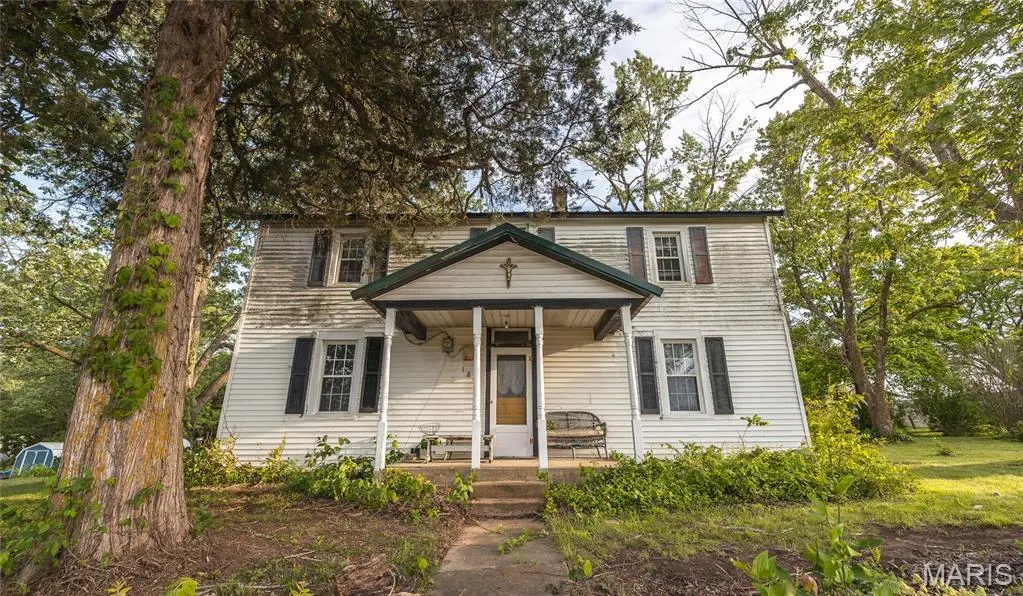
185 Highway 42 W · Vienna, MO
Flood risk 1/10 · Minimal
- FEMA flood zone
- —
- Chance of flooding over 30 yrs
- 0.0%
- Est. flood insurance / yr
- —
Fire risk 3/10 · Minor
- Est. fire insurance / yr
- $1,054 – $1,958
Heat risk 4/10 · Minor
- Hot days now (above 105°F)
- 7 days/yr
- Hot days in 30 yrs
- 19 days/yr
Wind risk 2/10 · Minimal
- Chance of severe wind over 30 yrs
- 0.0%
Air-quality risk 2/10 · Minimal
- Unhealthy air days now
- 0 days/yr
- Unhealthy air days in 30 yrs
- 1 days/yr
Risk factors via First Street. Map © Google.
Why this score? — see what drove the D+ grade
The composite is a weighted blend of 9 inputs, each scored 0–100. Each bar is that input's sub-score; the figure is the points it added to the 100-point composite (weight × sub-score).
- Cash flow +14.6/30.0
- ARV discount +7.5/15.0
- Appreciation +7.1/10.0
- DSCR +4.5/10.0
- 1% rule +3.2/10.0
- Livability +3.1/5.0
- Rent growth +2.5/5.0
- Schools +2.5/10.0
- Condition / age +2.5/5.0
$165,000
🖨 Deal sheet 📄 Offer letter ✓ Due diligence
Listing remarks
Nestled on over 5 acres in Vienna, MO, this 4-bedroom farmhouse-style home offers a fantastic opportunity for those looking to add their personal touch and build equity. Full of character and potential, the home features a cozy living area with a propane fireplace, a charming country kitchen, and a flexible layout to suit a variety of needs. There are four bedrooms, including two non-conforming rooms (no closets) that would also make excellent office space, hobby rooms, or guest areas. A bright sunroom provides additional living space—perfect for relaxing, working from home, or enjoying views of the surrounding property. Outside is where this property truly shines. Approximately 4 acr
Key facts
- 5.07 acre lot
- Garage
- Built 2004
Property features AI
Finance
- Other: Living area reported as 3,000 (per public records); Lot size approximately 5.07 acres
- Financial info: Annual tax information available
Exterior
- Parking: 3 total parking spaces; 1-car garage (attached); 2-car carport
- Utilities: Public water; Public sewer; Electric service (other)
- Home design: Single family residence; Residential property; Two levels
- Construction: Frame construction with vinyl siding; Has basement; Sump pump in basement; Year built (public records)
- Exterior features: Front porch; Fenced yard; Adjoins wooded area; Gently rolling terrain; Many trees; Carport(s) and garage(s)
Interior
- Kitchen: Dishwasher; Microwave; Gas oven; Gas range; Refrigerator; Water heater
- Bedrooms: 4 bedrooms (all on upper level)
- Flooring: Carpet; Laminate; Wood
- Bathrooms: 1 full bathroom
- Heating & cooling: Forced air heating (propane); Ceiling fans; Window air conditioning units
- Interior features: Ceiling fans; Storage
- Laundry & utility: Laundry in basement
Neighborhood map
What this means for you Summary
Snapshot
- This is a 4-bed/1.0-bath other listed at $165k.
Deal economics
- At list price, monthly cash flow is $40 ($480/yr) — positive.
- The deal already cash-flows at list — no discount required.
- To meet the 1% rule (rent ≥ 1% of price), the offer needs to be $136k (17.7% below list).
- Recommended offer: $136k (17.7% below list) — sets the bar for 1% rule.
Location & tenants
- Location reads 61/100 on livability (#459 in MO) — a middle-class / working-renter tenant base. Strengths: cost of living A+, housing A+; Watch: crime F, amenities F, commute F.
- Maries County R-I (rural): math 20% / reading 39% proficiency, ranked #272 of 324 in MO (top 84%) — low school quality limits family demand, transient renter base, plan for 1-2y turnover.
- Zoned schools: Vienna Elem. (math 17% / reading 37%, grade F, #850 of 1,115 statewide, top 78%, 186 students, 39% FRL); Vienna High (math 24% / reading 54%, grade F, #247 of 521 statewide, top 55%, 167 students, 31% FRL).
- Market conditions: 21 active listings in the ZIP.
Forward outlook
- In year one you build about $8k of equity ($1k loan paydown + $7k appreciation (4.3% local appreciation)).
- Maries County population projected at -19% by 2050 — secular population decline; favor cash flow + early exit over multi-decade hold.
- At projected returns (4.3% appreciation + 3.0% rent growth), your $46k cash investment doubles in ~5 years — after that, you're playing with house money.
- By year 5, paydown + projected appreciation supports a ~$36k cash-out refi (75% LTV) — recoverable capital for the next deal without selling this one.
Negotiation context
- It's been on market 49 days — a 3% lower offer ($160k) is reasonable based on typical stale-listing flexibility.
- 2 sale attempts with the ask held roughly flat each time — persistent listings suggest the price (not the market) is what's stuck; bring a comps-based counter.
Questions for the listing agent
- It's been on market 49 days. Have you received any prior offers? Is the seller open to a 18% concession, seller financing, or rate buy-down credit?
- Is there a deadline driving the sale (1031 exchange, divorce, estate, relocation)? That informs how much negotiation room exists.
- Crime grade is F in this area — have there been break-ins, vandalism, or insurance claims at this property in the last 3 years? What carrier currently insures it and at what premium?
- The area grade is low — what's the realistic commute time and amenity access for the typical tenant pool here? Any planned neighborhood developments (good or bad) we should know about?
- What's the average days-on-market for RENTAL listings here right now (not sales)? A rising rental-DOM trend means longer vacancies and softer asking-rent achievability than the comps imply.
- What's the recent tenant-quality profile in this submarket — average credit score on applications, eviction rate, late-payment / NSF rate, and stable-employment percentage? A property-management company in the area should have these aggregated.
- How much new for-sale + rental construction is in the pipeline within 1–3 miles? Heavy new supply typically softens prices + rents 12–24 months out; constrained supply supports both.
Investment metrics
- 1% rule
- 0.82% ✗
- Cap rate
- 6.58%
- Cash-on-cash
- 1.04%
- DSCR
- 1.05
- GRM
- 10.1
CMA / ARV
- ARV (median comp)
- $355,437
- List price
- $165,000
- Delta
- -53.58%
- Verdict
- UNDERPRICED
- Comps
- 2 within 2.0 mi
Projected returns pro-forma
4.3% appreciation · 3.0% rent growth · sell at horizon
- IRR
- 12.0%
- Equity multiple
- 1.74×
- Total profit
- $33,985
- Equity at exit
- $86,536
- IRR
- 13.3%
- Equity multiple
- 3.25×
- Total profit
- $103,836
- Equity at exit
- $143,882
Cash invested: $46,200 (down + closing). Projections, not guarantees.
Landlord ↔ Tenant lean methodology
- Overall (STATE)
- 81 Strongly Landlord-Friendly
- State Missouri
- 81 Strongly Landlord-Friendly · R+10
- County
- — inherits STATE
- City
- — inherits STATE
ZIP-level market 65582
- Home prices YoY
- 3.1%
- Active inventory
- 21
- Price-to-rent
- 10.1×
Monthly cashflow live
- Estimated rent
- $1,358 medium interval (Pro) →
- Mortgage (P&I)
- −$865
- Tax from tax record
- −$99 /mo · $1,185/yr
- Insurance
- −$69
- HOA
- −$0
- Vacancy / Maint / Mgmt
- −$285
- Net cashflow
- $40
Break-even live
UW: 25.0% down · 7.5% · 30yr · 1.5% tax · 5.0% vac · 8.0% maint · 8.0% mgmt
Financing live
Cash to close
- Down payment
- $41,250
- Closing costs
- $4,950
- Reserves months
- —
- Total cash needed
- —
Loan-product check · same deal, 3 products live
Conventional
25% down · 7.5% · 30yr
- Down + closing
- —
- Monthly P&I
- —
- Monthly cashflow
- —
- DSCR
- —
- Eligible?
- —
Personal DTI + credit; lowest rate.
DSCR
20% down · 8.5% · 30yr
- Down + closing
- —
- Monthly P&I
- —
- Monthly cashflow
- —
- DSCR
- —
- Eligible?
- —
No personal income docs; deal must DSCR.
Hard money
10% down · 12.0% · 12mo
- Down + closing
- —
- Monthly P&I
- —
- Monthly cashflow
- —
- DSCR
- —
- Eligible?
- —
Short-term bridge; refi at stabilization.
Listing history 21 events
-
2026-06-19days on market $165,000 Active 49 DOM
-
2026-06-18days on market $165,000 Active 48 DOM
-
2026-06-17days on market $165,000 Active 47 DOM
-
2026-06-16days on market $165,000 Active 46 DOM
-
2026-06-15days on market $165,000 Active 45 DOM
-
2026-06-14days on market $165,000 Active 43 DOM
-
2026-06-12days on market $165,000 Active 42 DOM
-
2026-06-09days on market $165,000 Active 39 DOM
-
2026-06-08days on market $165,000 Active 38 DOM
-
2026-06-07days on market $165,000 Active 37 DOM
-
2026-06-05days on market $165,000 Active 34 DOM
-
2026-06-03days on market $165,000 Active 33 DOM
-
2026-06-02days on market $165,000 Active 32 DOM
-
2026-06-01days on market $165,000 Active 31 DOM
-
2026-05-31days on market $165,000 Active 30 DOM
-
2026-05-30days on market $165,000 Active 29 DOM
-
2026-05-02$165,000 Active 1355-char remark
-
2026-05-01historical $165,000 1355-char remark
-
2026-02-27price $134,900
-
2025-12-31price $149,500
-
2025-12-30$154,900 Active
ⓘ Source: listings_history table (triggers on properties + properties_extension) + one-shot
backfill from property_details.listing_events for pre-trigger history.
Tax reassessment forecast MO · Resets to sale price
- Current annual tax
- $1,185 · $99/mo
- Projected year-2 tax
- $1,600 · $133/mo
- Expected delta
- +$415/yr (+$35/mo · 35.1%)
ⓘ Screening estimate from a state-policy table — verify with the county assessor before closing.
Climate risk First Street
- Flood 1/10 Low 0% chance over 30 yrs
- Wildfire 3/10 Moderate
- Heat 4/10 Moderate 7 d/yr ≥105°F today · 19 d/yr by 30 yrs out
- Wind 2/10 Low 0% chance of damaging wind over 30 yrs
- Air quality 2/10 Low 0 unhealthy d/yr today · 1 by 30 yrs out
Nearby sold comps map
Loading sold comps map…
Walkable amenities ~0.75 mi
Loading nearby amenities…
Taxation est. · year 1
- Rental income
- $16,296
- − Mortgage interest
- −$9,243
- − Property taxes
- −$1,185
- − Insurance
- −$825
- − Repairs & maintenance
- −$1,304
- − Management
- −$1,304
- − Depreciation
- −$4,800
- Taxable loss
- −$2,364
- Est. tax savings @ 24.0%
- +$567
- After-tax cash flow
- $1,048/yr
For passive investors: Depreciation is non-cash, so a rental often shows a tax loss while cash-flowing — sheltering income. Rental losses are passive: they offset passive income freely, and up to $25,000/yr can offset ordinary (W-2) income if you actively participate and your MAGI is under $100k (phasing out to $0 by $150k); unused losses carry forward. On sale, claimed depreciation is recaptured at up to 25%, and gains may owe capital-gains tax (a 1031 exchange can defer both). Figures are a year-1 estimate at your 24.0% rate — not tax advice; consult a CPA.
Schools (NCES district)
- District
- Maries County R-I
- NCES district ID
- 2930870
- Math proficiency
- 20% ▼ -8.00%
- Reading proficiency
- 39% ▼ -7.00%
- Median HH income
- $46,008
- Composite
- 25.33/100
- National rank
- #7481
- State rank
- #272 of 324 in MO
Livability — Vienna
- Score
- 61/100
- State rank
- #459
- US rank
- #18460
Category grades
Schools grade is shown separately in the Schools card above.
Census & demographics
- Census place
- Vienna, MO
- Population (ZIP)
- 2,121
Population outlook (Maries County) Hauer SSP2
- Today (2025)
- 8,458 people
- By 2030
- 8,165 · -3.5%
- By 2040
- 7,523 · -11.1%
- By 2050
- 6,884 · -18.6%
- By 2075
- 5,825 · -31.1%
- By 2100
- 5,245 · -38.0%
Race, ethnicity, and origin ACS 2023
- Neighborhood character
- Predominantly White (91%)
- Race & ethnicity
- White 91% Two or more races 7% Native American 2%
- Common ancestry
- Slovak 2% Italian 2% Lithuanian 1%
- Foreign-born
- 0%
Political lean MEDSL · Maries
- 2024 margin
- Solid R (+67.5) · D 15.8% · R 83.3%
- 2008→2024 swing
- -40.0pp toward R · 2008: -27.6pp · 2024: -67.5pp
- All cycles
- 2024: R+67.5 2020: R+64.5 2016: R+61.5 2012: R+41.1 2008: R+27.6
Not yet ingested
- Civics
- —
Market trends
- HPI YoY
- ▲ 4.30%
- Current HPI
- 143.9953
- Rent YoY
- —
- Metro
- —
- State GDP YoY
- ▲ 1.84%
- F500 in state
- 20
Industry mix (Fortune 500 HQ in MO)
| Industry | F500 HQs | Revenue |
|---|---|---|
| Healthcare | 1 | $163B |
|
||
| Insurance | 1 | $21B |
|
||
| Industrial Technology | 1 | $17B |
|
||
| Retail | 1 | $16B |
|
||
| Industrial Distribution | 1 | $10B |
|
||
| Utilities | 1 | $9B |
|
||
Price history
+6.5% since first listed5 events — show timeline
- 2026-05-02 Listed $165,000 MARIS as Distributed by MLS Grid
- 2026-05-01 Coming Soon $165,000 MARIS as Distributed by MLS Grid
- 2026-02-27 Price Changed $134,900 MARIS as Distributed by MLS Grid
- 2025-12-31 Price Changed $149,500 MARIS as Distributed by MLS Grid
- 2025-12-30 Listed $154,900 MARIS as Distributed by MLS Grid
Property tax history
+1.6%/yrLatest (2025): $1,185 · +11.4% YoY. Source: county tax records.
Cash-flow waterfall
monthlySold comps — $/sqft
last 12 mo · ≤1 miLoading sold comps…