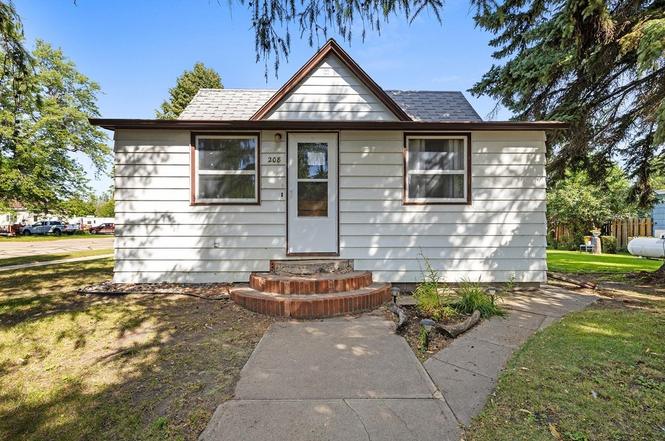
208 3rd Ave SW · Towner, ND
Flood risk 1/10 · Minimal
- FEMA flood zone
- X (unshaded)
- Chance of flooding over 30 yrs
- 0.0%
- Est. flood insurance / yr
- $473 – $860
Fire risk 4/10 · Minor
- Est. fire insurance / yr
- $1,289 – $2,393
Heat risk 1/10 · Minimal
- Hot days now (above 95°F)
- 7 days/yr
- Hot days in 30 yrs
- 12 days/yr
Wind risk 1/10 · Minimal
- Chance of severe wind over 30 yrs
- —
Air-quality risk 5/10 · Moderate
- Unhealthy air days now
- 7 days/yr
- Unhealthy air days in 30 yrs
- 7 days/yr
Risk factors via First Street. Map © Google.
Why this score? — see what drove the A- grade
The composite is a weighted blend of 9 inputs, each scored 0–100. Each bar is that input's sub-score; the figure is the points it added to the 100-point composite (weight × sub-score).
- Cash flow +30.0/30.0
- ARV discount +15.0/15.0
- 1% rule +10.0/10.0
- DSCR +10.0/10.0
- Appreciation +7.2/10.0
- Livability +3.2/5.0
- Schools +2.9/10.0
- Rent growth +2.5/5.0
- Condition / age +2.5/5.0
$54,500
🖨 Deal sheet (PDF) 📄 Offer letter ✓ Due diligence
Key facts
- Corner lot
- 0.23 acre lot
- 2 garage spots
Tags
Property features AI
Exterior
- Parking: 2-car garage; Concrete driveway/parking
- Utilities: Public water; Public sewer
- Home design: Single-family residence; One story
- Construction: Below-grade finished area; Basement present
- Exterior features: Patio; Lot zoned R1
Interior
- Kitchen: Microwave; Range; Oven; Refrigerator
- Heating & cooling: Central air conditioning; Electric heating; Propane heating
- Interior features: Microwave; Range; Oven; Refrigerator; Unfinished basement
Neighborhood map
What this means for you Summary
Snapshot
- This is a 3-bed/1.0-bath single-family listed at $54k.
Deal economics
- At list price, monthly cash flow is $632 ($8k/yr) — positive.
- The deal already cash-flows at list — no discount required.
- Meets the 1% rule at list price ($1k rent vs $54k).
- Recommended offer: $48k (12.0% below list) — sets the bar for market timing.
Location & tenants
- Location reads 65/100 on livability (#190 in ND) — a middle-class / working-renter tenant base. Strengths: cost of living A+, housing A+; Watch: crime C-, schools D, amenities F.
- Tgu 60 (rural): math 25% / reading 35% proficiency, ranked #143 of 169 in ND (top 85%) — families likely to look elsewhere, expect single-tenant / working-renter base with shorter leases.
- Market conditions: 3 active listings in the ZIP; 8 units permitted in McHenry County in 2024 (0 in 5+ unit buildings).
Forward outlook
- In year one you build about $3k of equity ($377 loan paydown + $2k appreciation (4.4% local appreciation)).
- McHenry County population projected at +57% by 2050 — long-run rental-demand tailwind backs the buy-and-hold thesis.
- At projected returns (4.4% appreciation + 3.0% rent growth), your $15k cash investment doubles in ~2 years — after that, you're playing with house money.
Negotiation context
- It's been on market 292 days — a 12% lower offer ($48k) is reasonable based on typical stale-listing flexibility.
- 2 sale attempts; this cycle's ask has dropped $25k (31%) from the opening price — seller is motivated, your offer sets the floor, not the list.
Risks & watch-outs
- Watch-outs: built in 1913 — expect roof / HVAC / electrical / plumbing capex.
Questions for the listing agent
- It's been on market 292 days. Have you received any prior offers? Is the seller open to a 12% concession, seller financing, or rate buy-down credit?
- Built in 1913 — when were the roof, HVAC, electrical panel, plumbing, and water heater last replaced?
- Why hasn't it sold? Are there any deal-killer items the seller is aware of (foundation, flood, title, zoning, code violations)?
- Is there a deadline driving the sale (1031 exchange, divorce, estate, relocation)? That informs how much negotiation room exists.
- Schools are D-rated, which usually means shorter tenancies and higher turnover. Who's the typical renter profile here, and what's been the actual vacancy rate?
- What's the average days-on-market for RENTAL listings here right now (not sales)? A rising rental-DOM trend means longer vacancies and softer asking-rent achievability than the comps imply.
- What's the recent tenant-quality profile in this submarket — average credit score on applications, eviction rate, late-payment / NSF rate, and stable-employment percentage? A property-management company in the area should have these aggregated.
- How much new for-sale + rental construction is in the pipeline within 1–3 miles? Heavy new supply typically softens prices + rents 12–24 months out; constrained supply supports both.
Investment metrics
- 1% rule
- 2.34% ✓
- Cap rate
- 20.21%
- Cash-on-cash
- 49.70%
- DSCR
- 3.21
- GRM
- 3.6
CMA / ARV
- ARV (on-the-fly)
- $77,026
- Comps found
- 3
Show comp detail 3 sales within ~0.75 mi
| Address | Dist | Beds/Ba | Sqft | Sold | Price | $/sf | Match |
|---|---|---|---|---|---|---|---|
| 405 3rd St SW | 0.12mi | 2/2.0 (-1) | 2,008 (-1%) | 14mo | $60,000 | $30 | 72 |
| 104 4th Ave SW | 0.13mi | 2/2.0 (-1) | 1,792 (-12%) | 12mo | $108,000 | $60 | 55 |
| 207 6th Ave SW | 0.25mi | 2/2.0 (-1) | 1,792 (-12%) | 18mo | $68,000 | $38 | 45 |
Match score weights: distance 35% · size 25% · config 20% · recency 20%. Top-matched comps best support the ARV.
Projected returns pro-forma
4.44% appreciation · 3.0% rent growth · sell at horizon
- IRR
- 56.6%
- Equity multiple
- 4.35×
- Total profit
- $51,122
- Equity at exit
- $29,059
- IRR
- 54.9%
- Equity multiple
- 8.91×
- Total profit
- $120,649
- Equity at exit
- $48,703
Cash invested: $15,260 (down + closing). Projections, not guarantees.
Landlord ↔ Tenant lean methodology
- Overall (STATE)
- 82 Strongly Landlord-Friendly
- State North Dakota
- 82 Strongly Landlord-Friendly · R+20
- County
- — inherits STATE
- City
- — inherits STATE
ZIP-level market 58788
- Home prices YoY
- 5.6%
- Active inventory
- 3
- Price-to-rent
- 3.6×
Monthly cashflow live
- Estimated rent
- $1,277 medium interval (Pro) →
- Mortgage (P&I)
- −$286
- Tax est. 1.5%
- −$68 /mo · $818/yr
- Insurance
- −$23
- HOA
- −$0
- Vacancy / Maint / Mgmt
- −$268
- Net cashflow
- $632
Break-even live
Sensitivity live
| Price | -10% $670 | -5% $651 | +0% $632 | +5% $613 | +10% $594 |
|---|---|---|---|---|---|
| Rent | -10% $531 | -5% $582 | +0% $632 | +5% $683 | +10% $733 |
| Rate | -1.0pp $660 | -0.5pp $646 | base $632 | +0.5pp $618 | +1.0pp $604 |
UW: 25.0% down · 7.5% · 30yr · 1.5% tax · 5.0% vac · 8.0% maint · 8.0% mgmt
Financing live
Cash to close
- Down payment
- $13,625
- Closing costs
- $1,635
- Reserves months
- —
- Total cash needed
- —
Loan-product check · same deal, 3 products live
Conventional
25% down · 7.5% · 30yr
- Down + closing
- —
- Monthly P&I
- —
- Monthly cashflow
- —
- DSCR
- —
- Eligible?
- —
Personal DTI + credit; lowest rate.
DSCR
20% down · 8.5% · 30yr
- Down + closing
- —
- Monthly P&I
- —
- Monthly cashflow
- —
- DSCR
- —
- Eligible?
- —
No personal income docs; deal must DSCR.
Hard money
10% down · 12.0% · 12mo
- Down + closing
- —
- Monthly P&I
- —
- Monthly cashflow
- —
- DSCR
- —
- Eligible?
- —
Short-term bridge; refi at stabilization.
Listing history 24 events
-
2026-06-21days on market $54,500 Active 292 DOM
-
2026-06-21days on market $54,500 Active 291 DOM
-
2026-06-18days on market $54,500 Active 289 DOM
-
2026-06-17days on market $54,500 Active 288 DOM
-
2026-06-16days on market $54,500 Active 287 DOM
-
2026-06-15days on market $54,500 Active 286 DOM
-
2026-06-13days on market $54,500 Active 284 DOM
-
2026-06-12days on market $54,500 Active 283 DOM
-
2026-06-09days on market $54,500 Active 280 DOM
-
2026-06-08days on market $54,500 Active 279 DOM
-
2026-06-07days on market $54,500 Active 278 DOM
-
2026-06-05days on market $54,500 Active 276 DOM
-
2026-06-04pricedays on market $54,500 Active 274 DOM
-
2026-06-02days on market $59,500 Active 273 DOM
-
2026-06-01days on market $59,500 Active 272 DOM
-
2026-05-31days on market $59,500 Active 271 DOM
-
2026-05-18price $59,500
-
2026-04-13price $64,500
-
2026-03-27price $69,500
-
2026-03-02price $74,500
-
2025-11-18price $77,000
-
2025-10-14status Active
-
2025-10-06historical Active Under Contract
-
2025-09-02$79,500 Active
ⓘ Source: listings_history table (triggers on properties + properties_extension) + one-shot
backfill from property_details.listing_events for pre-trigger history.
Climate risk First Street
- Flood 1/10 Low FEMA zone X (unshaded) · 0% chance over 30 yrs
- Wildfire 4/10 Moderate
- Heat 1/10 Low 7 d/yr ≥95°F today · 12 d/yr by 30 yrs out
- Wind 1/10 Low
- Air quality 5/10 Major 7 unhealthy d/yr today · 7 by 30 yrs out
Nearby sold comps map
Loading sold comps map…
Walkable amenities ~0.75 mi
Loading nearby amenities…
Taxation est. · year 1
- Rental income
- $15,322
- − Mortgage interest
- −$3,053
- − Property taxes
- −$818
- − Insurance
- −$272
- − Repairs & maintenance
- −$1,226
- − Management
- −$1,226
- − Depreciation
- −$1,585
- Taxable income
- $7,142
- Est. tax owed @ 24.0%
- −$1,714
- After-tax cash flow
- $5,871/yr
For passive investors: Depreciation is non-cash, so a rental often shows a tax loss while cash-flowing — sheltering income. Rental losses are passive: they offset passive income freely, and up to $25,000/yr can offset ordinary (W-2) income if you actively participate and your MAGI is under $100k (phasing out to $0 by $150k); unused losses carry forward. On sale, claimed depreciation is recaptured at up to 25%, and gains may owe capital-gains tax (a 1031 exchange can defer both). Figures are a year-1 estimate at your 24.0% rate — not tax advice; consult a CPA.
Schools (NCES district)
- District
- Tgu 60
- NCES district ID
- 3800047
- Math proficiency
- 25% ▬ 0.00%
- Reading proficiency
- 35% ▼ -5.00%
- Median HH income
- $47,352
- Composite
- 28.76/100
- National rank
- #11996
- State rank
- #143 of 169 in ND
Livability — Towner
- Score
- 65/100
- State rank
- #190
- US rank
- #13390
Category grades
Schools grade is shown separately in the Schools card above.
Census & demographics
- Census place
- Towner, ND
- Population (ZIP)
- 803
Population outlook (McHenry County) Hauer SSP2
- Today (2025)
- 7,220 people
- By 2030
- 7,919 · +9.7%
- By 2040
- 9,489 · +31.4%
- By 2050
- 11,306 · +56.6%
- By 2075
- 16,500 · +128.5%
- By 2100
- 20,768 · +187.6%
Race, ethnicity, and origin ACS 2023
- Neighborhood character
- Predominantly White (90%)
- Race & ethnicity
- White 90% Two or more races 4% Black 4% Hispanic / Latino 3%
- Common ancestry
- Portuguese 36% Scotch-Irish 2% Lithuanian 1%
- Foreign-born
- 1% · Canada
- Languages at home
- 97% English-only · Spanish 2% German/W. Germanic 1%
Political lean MEDSL · McHenry
- 2024 margin
- Solid R (+63.8) · D 17.5% · R 81.3% · Other 1.2%
- 2008→2024 swing
- -47.5pp toward R · 2008: -16.3pp · 2024: -63.8pp
- All cycles
- 2024: R+63.8 2020: R+59.9 2016: R+56.5 2012: R+27.4 2008: R+16.3
Not yet ingested
- Civics
- —
Market trends
- HPI YoY
- ▲ 4.44%
- Current HPI
- 83.1851
- Rent YoY
- —
- Metro
- —
- State GDP YoY
- ▲ 2.09%
- F500 in state
- 2
Industry mix (Fortune 500 HQ in ND)
| Industry | F500 HQs | Revenue |
|---|---|---|
| Utilities / Construction | 1 | $6B |
|
||
Price history
-25.2% since first listed8 events — show timeline
- 2026-05-18 Price Changed $59,500 MMLS
- 2026-04-13 Price Changed $64,500 MMLS
- 2026-03-27 Price Changed $69,500 MMLS
- 2026-03-02 Price Changed $74,500 MMLS
- 2025-11-18 Price Changed $77,000 MMLS
- 2025-10-14 Relisted — MMLS
- 2025-10-06 Contingent — MMLS
- 2025-09-02 Listed $79,500 MMLS
Cash-flow waterfall
monthlySold comps — $/sqft
last 12 mo · ≤1 miLoading sold comps…