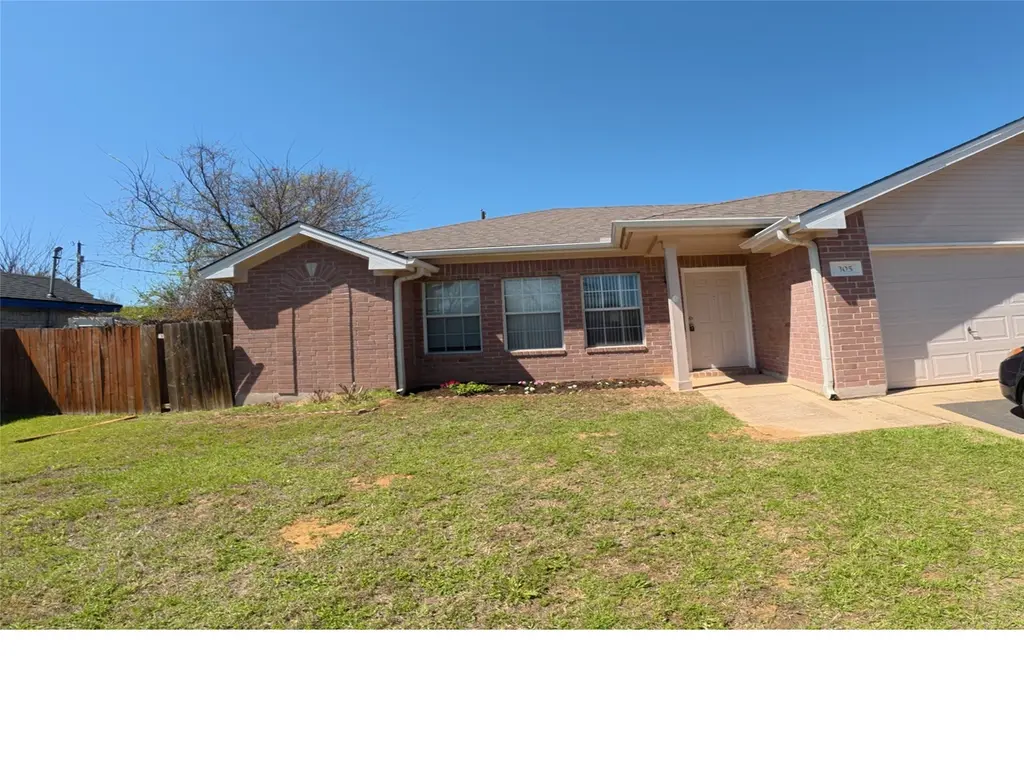
305 China Cv · Elgin, TX
Flood risk 1/10 · Minimal
- FEMA flood zone
- X (unshaded)
- Chance of flooding over 30 yrs
- 0.0%
- Est. flood insurance / yr
- $507 – $1,088
Fire risk 4/10 · Minor
- Est. fire insurance / yr
- $1,222 – $2,270
Heat risk 8/10 · Major
- Hot days now (above 109°F)
- 7 days/yr
- Hot days in 30 yrs
- 23 days/yr
Wind risk 8/10 · Major
- Chance of severe wind over 30 yrs
- 80.0%
Air-quality risk 1/10 · Minimal
- Unhealthy air days now
- 0 days/yr
- Unhealthy air days in 30 yrs
- 0 days/yr
Risk factors via First Street. Map © Google.
Why this score? — see what drove the D grade
The composite is a weighted blend of 9 inputs, each scored 0–100. Each bar is that input's sub-score; the figure is the points it added to the 100-point composite (weight × sub-score).
- ARV discount +11.9/15.0
- Appreciation +10.0/10.0
- Cash flow +5.0/30.0
- Livability +3.7/5.0
- Rent growth +3.3/5.0
- Condition / age +2.5/5.0
- 1% rule +2.3/10.0
- Schools +2.0/10.0
- DSCR +0.0/10.0
$229,900
🖨 Deal sheet (PDF) 📄 Offer letter ✓ Due diligence
Listing remarks MLS
Come out and Visit Elgin Tx. and see this cute 3 bedroom 2 bath home with a fantastic backyard perfect for entertaining, The back covered patio is ready to have your family gatherings and bbq. Home has gas stove and open kitchen/living and dining room. Home had 1 car garage that was converted to a room that is not in square footage No HOA and minutes from downtown Historic Main Street. Come see this home today!! Qualifies for USDA 0% down payment financing!
Key facts
- Covered patio
- Gas stove
- No hoa
Tags
Neighborhood map
What this means for you Summary
Snapshot
- This is a 3-bed/2.0-bath single-family listed at $230k.
Deal economics
- At list price, monthly cash flow is $-540 ($-6k/yr) — negative.
- To cash-flow at today's rent, offer at most $137k (40.3% below list).
- To meet the 1% rule (rent ≥ 1% of price), the offer needs to be $169k (26.6% below list).
- Recommended offer: $137k (40.3% below list) — sets the bar for cash-flow.
- Cap rate 3.5% vs local median 4.4% in Elgin — below-typical yield; the buyer is paying a premium for something (appreciation thesis, condition, location) that the cap rate doesn't capture.
Location & tenants
- Location reads 74/100 on livability (#167 in TX, #4,404 nationally) — a middle-class / working-renter tenant base. Strengths: cost of living A+, housing A+, health & safety A+; Watch: amenities F, commute F.
- Elgin ISD (rural): math 17% / reading 26% proficiency, ranked #741 of 826 in TX (top 90%) — low school quality limits family demand, transient renter base, plan for 1-2y turnover; 67% free/reduced lunch — lower-income household profile, screen leases tightly.
- Zoned schools: Booker T Washington El (math 9% / reading 17%, grade F, #4,152 of 4,322 statewide, top 96%, 750 students, 89% FRL); Elgin Middle (math 22% / reading 24%, grade F, #1,327 of 1,662 statewide, top 81%, 780 students, 82% FRL); Elgin H S (math 12% / reading 37%, grade F, #1,264 of 1,632 statewide, top 82%, 1,672 students, 74% FRL).
- Market conditions: Rents rising (+3.1%/yr); 814 active listings in the ZIP; 7 comparable units currently listed for rent nearby; rentals leasing fast (median 5d on market — plan ~1-2 weeks tenant-placement turnaround); solid renter incomes; 1,841 units permitted in Bastrop County in 2024 (150 in 5+ unit buildings).
Forward outlook
- In year one you build about $25k of equity ($2k loan paydown + $23k appreciation (10.0% local appreciation)).
- Bastrop County population projected at +37% by 2050 — long-run rental-demand tailwind backs the buy-and-hold thesis.
- By year 2, paydown + projected appreciation supports a ~$40k cash-out refi (75% LTV) — recoverable capital for the next deal without selling this one.
Negotiation context
- It's been on market 99 days — a 9% lower offer ($209k) is reasonable based on typical stale-listing flexibility.
- 2 sale attempts since 6y ago; this cycle's ask has dropped $25k (10%) from the opening price — seller is motivated, your offer sets the floor, not the list.
Risks & watch-outs
- Watch-outs: property tax is 3.0% of price.
- Climate carrying-cost: severe wind risk, 80% chance of damaging wind over 30y; extreme-heat days projected 7→23/yr by 2055 (HVAC capex compounding) — expect insurance premiums to compound above CPI over the hold.
Questions for the listing agent
- What do current leases actually rent for vs. the listed asking? Can we see a recent rent roll and the last 12 months of T-12 income?
- It's been on market 99 days. Have you received any prior offers? Is the seller open to a 40% concession, seller financing, or rate buy-down credit?
- Property tax is high relative to price — has the assessment been appealed recently, and will the sale trigger a re-assessment?
- Why hasn't it sold? Are there any deal-killer items the seller is aware of (foundation, flood, title, zoning, code violations)?
- Is there a deadline driving the sale (1031 exchange, divorce, estate, relocation)? That informs how much negotiation room exists.
- Schools are F-rated, which usually means shorter tenancies and higher turnover. Who's the typical renter profile here, and what's been the actual vacancy rate?
- The area grade is low — what's the realistic commute time and amenity access for the typical tenant pool here? Any planned neighborhood developments (good or bad) we should know about?
- What's the average days-on-market for RENTAL listings here right now (not sales)? A rising rental-DOM trend means longer vacancies and softer asking-rent achievability than the comps imply.
- What's the recent tenant-quality profile in this submarket — average credit score on applications, eviction rate, late-payment / NSF rate, and stable-employment percentage? A property-management company in the area should have these aggregated.
- How much new for-sale + rental construction is in the pipeline within 1–3 miles? Heavy new supply typically softens prices + rents 12–24 months out; constrained supply supports both.
Investment metrics
- 1% rule
- 0.73% ✗
- Cap rate
- 3.48%
- Cash-on-cash
- -10.06%
- DSCR
- 0.55
- GRM
- 11.3
CMA / ARV
- ARV (median comp)
- $254,784
- List price
- $229,900
- Delta
- -9.77%
- Verdict
- FAIR
- Comps
- 20 within 1.0 mi
Show comp detail 11 sales within ~0.75 mi
| Address | Dist | Beds/Ba | Sqft | Sold | Price | $/sf | Match |
|---|---|---|---|---|---|---|---|
| 204 E Brenham St | 0.37mi | 2/2.0 (-1) | 1,008 (+3%) | 8mo | $210,000 | $208 | 66 |
| 413 E 7th St | 0.71mi | 3/1.0 | 1,012 (+3%) | 6mo | $185,000 | $183 | 52 |
| 121 Jackson St | 0.63mi | 3/1.0 | 912 (-7%) | 4mo | $189,000 | $207 | 52 |
| 607 N Avenue H | 0.70mi | 2/1.5 (-1) | 960 (-2%) | 11mo | $174,900 | $182 | 48 |
| 517 N Avenue F | 0.57mi | 2/1.0 (-1) | 1,064 (+9%) | 3mo | $242,400 | $228 | 48 |
| 525 N Avenue H | 0.63mi | 3/2.0 | 1,042 (+6%) | 15mo | $220,000 | $211 | 47 |
| 603 N Main St | 0.64mi | 2/1.0 (-1) | 975 (-0%) | 24mo | $335,000 | $344 | 41 |
| 103 E Ila St | 0.66mi | 3/1.5 | 1,026 (+5%) | 24mo | $249,500 | $243 | 39 |
| 401 S Avenue C | 0.56mi | 3/1.0 | 836 (-15%) | 10mo | $199,000 | $238 | 38 |
| 505 N Avenue F | 0.52mi | 2/1.0 (-1) | 1,080 (+10%) | 17mo | $219,000 | $203 | 35 |
| 612 N Avenue Ave E | 0.69mi | 2/1.0 (-1) | 922 (-6%) | 18mo | $199,900 | $217 | 34 |
Match score weights: distance 35% · size 25% · config 20% · recency 20%. Top-matched comps best support the ARV.
Projected returns pro-forma
10.0% appreciation · 3.12% rent growth · sell at horizon
- IRR
- 17.3%
- Equity multiple
- 2.42×
- Total profit
- $91,243
- Equity at exit
- $207,112
- IRR
- 16.4%
- Equity multiple
- 5.61×
- Total profit
- $296,539
- Equity at exit
- $446,645
Cash invested: $64,372 (down + closing). Projections, not guarantees.
Landlord ↔ Tenant lean methodology
- Overall (STATE)
- 87 Strongly Landlord-Friendly
- State Texas
- 87 Strongly Landlord-Friendly · R+5
- County
- — inherits STATE
- City
- — inherits STATE
ZIP-level market 78621
- Home prices YoY
- 7.6%
- Rents YoY
- 3.1%
- Active inventory
- 814
- Price-to-rent
- 11.3×
Monthly cashflow live
- Estimated rent
- $1,689 high interval (Pro) →
- Mortgage (P&I)
- −$1,206
- Tax from tax record
- −$572 /mo · $6,867/yr
- Insurance
- −$96
- HOA
- −$0
- Vacancy / Maint / Mgmt
- −$355
- Net cashflow
- $-540
Break-even live
Sensitivity live
| Price | -10% $-410 | -5% $-475 | +0% $-540 | +5% $-605 | +10% $-670 |
|---|---|---|---|---|---|
| Rent | -10% $-673 | -5% $-606 | +0% $-540 | +5% $-473 | +10% $-406 |
| Rate | -1.0pp $-424 | -0.5pp $-481 | base $-540 | +0.5pp $-599 | +1.0pp $-660 |
UW: 25.0% down · 7.5% · 30yr · 1.5% tax · 5.0% vac · 8.0% maint · 8.0% mgmt
Financing live
Cash to close
- Down payment
- $57,475
- Closing costs
- $6,897
- Reserves months
- —
- Total cash needed
- —
Loan-product check · same deal, 3 products live
Conventional
25% down · 7.5% · 30yr
- Down + closing
- —
- Monthly P&I
- —
- Monthly cashflow
- —
- DSCR
- —
- Eligible?
- —
Personal DTI + credit; lowest rate.
DSCR
20% down · 8.5% · 30yr
- Down + closing
- —
- Monthly P&I
- —
- Monthly cashflow
- —
- DSCR
- —
- Eligible?
- —
No personal income docs; deal must DSCR.
Hard money
10% down · 12.0% · 12mo
- Down + closing
- —
- Monthly P&I
- —
- Monthly cashflow
- —
- DSCR
- —
- Eligible?
- —
Short-term bridge; refi at stabilization.
Rent comps 7 comps
| Address | Beds | Baths | Sqft | Rent | $/sqft | DOM | Units | Dist |
|---|---|---|---|---|---|---|---|---|
| 200 Maple Ln Elgin, TX | 2.0 | 2.0 | 891 | $1,400 | $1.57 | 45d | 1 | 0.19mi |
| 204 Hall St Unit A Elgin, TX | 2.0 | 1.0 | 910 | $1,195 | $1.31 | 0d | 1 | 0.32mi |
| 110 S Main St #206 Elgin, TX | 2.0 | 1.0 | 710 | $1,500 | $2.11 | 14d | 1 | 0.50mi |
| 110 S Main St #104 Elgin, TX | 3.0 | 2.0 | 1061 | $1,700 | $1.60 | 45d | 1 | 0.50mi |
| 805 Lexington Rd Unit B Elgin, TX | 2.0 | 2.0 | 889 | $1,350 | $1.52 | 0d | 1 | 0.80mi |
| 805 Lexington Rd Unit A Elgin, TX | 2.0 | 2.0 | 889 | $1,400 | $1.57 | 4d | 1 | 0.80mi |
| 817 Lloyd Ln Unit A Elgin, TX | 2.0 | 2.0 | 838 | $1,260 | $1.50 | 0d | 1 | 0.81mi |
Listing history 24 events
-
2026-06-21days on market $229,900 Active 99 DOM
-
2026-06-18days on market $229,900 Active 96 DOM
-
2026-06-17days on market $229,900 Active 95 DOM
-
2026-06-16days on market $229,900 Active 94 DOM
-
2026-06-15days on market $229,900 Active 93 DOM
-
2026-06-13remarks 699-char remark
-
2026-06-13pricedays on market $229,900 Active 91 DOM
-
2026-06-09days on market $239,900 Active 87 DOM
-
2026-06-08days on market $239,900 Active 86 DOM
-
2026-06-07days on market $239,900 Active 85 DOM
-
2026-06-04days on market $239,900 Active 82 DOM
-
2026-06-03days on market $239,900 Active 81 DOM
-
2026-06-02days on market $239,900 Active 80 DOM
-
2026-06-01days on market $239,900 Active 79 DOM
-
2026-05-31days on market $239,900 Active 78 DOM
-
2026-04-30price $239,900 467-char remark
Show marketing remark (467 chars)
Come out and Visit Elgin Tx. and see this cute 3 bedroom 2 bath home with a fantastic backyard perfect for entertaining, The back covered patio is ready to have your family gatherings and bbq. Home has gas stove and open kitchen/living and dining room. Home had 1 car garage that was converted to a room that is not in square footage No HOA and minutes from downtown Historic Main Street. Come see this home today!! Qualifies for USDA 0% down payment financing!
-
2026-04-19price $244,900 467-char remark
Show marketing remark (467 chars)
Come out and Visit Elgin Tx. and see this cute 3 bedroom 2 bath home with a fantastic backyard perfect for entertaining, The back covered patio is ready to have your family gatherings and bbq. Home has gas stove and open kitchen/living and dining room. Home had 1 car garage that was converted to a room that is not in square footage No HOA and minutes from downtown Historic Main Street. Come see this home today!! Qualifies for USDA 0% down payment financing!
-
2026-04-02price $249,900 467-char remark
Show marketing remark (467 chars)
Come out and Visit Elgin Tx. and see this cute 3 bedroom 2 bath home with a fantastic backyard perfect for entertaining, The back covered patio is ready to have your family gatherings and bbq. Home has gas stove and open kitchen/living and dining room. Home had 1 car garage that was converted to a room that is not in square footage No HOA and minutes from downtown Historic Main Street. Come see this home today!! Qualifies for USDA 0% down payment financing!
-
2026-03-14$255,000 Active 467-char remark
Show marketing remark (467 chars)
Come out and Visit Elgin Tx. and see this cute 3 bedroom 2 bath home with a fantastic backyard perfect for entertaining, The back covered patio is ready to have your family gatherings and bbq. Home has gas stove and open kitchen/living and dining room. Home had 1 car garage that was converted to a room that is not in square footage No HOA and minutes from downtown Historic Main Street. Come see this home today!! Qualifies for USDA 0% down payment financing!
-
2020-12-28soldstatus
-
2020-12-23soldstatus Closed 166-char remark
Show marketing remark (166 chars)
Cute updated home in Elgin. New roof, new carpet, fresh neutral paint and new high end primary bath. Large covered deck and lots of mature landscaping. Move in ready.
-
2020-11-20historical Active Under Contract 166-char remark
Show marketing remark (166 chars)
Cute updated home in Elgin. New roof, new carpet, fresh neutral paint and new high end primary bath. Large covered deck and lots of mature landscaping. Move in ready.
-
2020-11-17$199,900 Active 166-char remark
Show marketing remark (166 chars)
Cute updated home in Elgin. New roof, new carpet, fresh neutral paint and new high end primary bath. Large covered deck and lots of mature landscaping. Move in ready.
-
2013-08-21soldstatus
ⓘ Source: listings_history table (triggers on properties + properties_extension) + one-shot
backfill from property_details.listing_events for pre-trigger history.
Tax reassessment forecast TX · Resets to sale price
- Current annual tax
- $6,867 · $572/mo
- Projected year-2 tax
- $6,867 · $572/mo
- Expected delta
- $0/yr ($0/mo · 0.0%)
ⓘ Screening estimate from a state-policy table — verify with the county assessor before closing.
Climate risk First Street
- Flood 1/10 Low FEMA zone X (unshaded) · 0% chance over 30 yrs
- Wildfire 4/10 Moderate
- Heat 8/10 Severe 7 d/yr ≥109°F today · 23 d/yr by 30 yrs out
- Wind 8/10 Severe 80% chance of damaging wind over 30 yrs
- Air quality 1/10 Low 0 unhealthy d/yr today · 0 by 30 yrs out
Nearby sold comps map
Loading sold comps map…
Walkable amenities ~0.75 mi
Loading nearby amenities…
Taxation est. · year 1
- Rental income
- $20,263
- − Mortgage interest
- −$12,878
- − Property taxes
- −$6,867
- − Insurance
- −$1,150
- − Repairs & maintenance
- −$1,621
- − Management
- −$1,621
- − Depreciation
- −$6,688
- Taxable loss
- −$10,561
- Est. tax savings @ 24.0%
- +$2,535
- After-tax cash flow
- $-3,941/yr
For passive investors: Depreciation is non-cash, so a rental often shows a tax loss while cash-flowing — sheltering income. Rental losses are passive: they offset passive income freely, and up to $25,000/yr can offset ordinary (W-2) income if you actively participate and your MAGI is under $100k (phasing out to $0 by $150k); unused losses carry forward. On sale, claimed depreciation is recaptured at up to 25%, and gains may owe capital-gains tax (a 1031 exchange can defer both). Figures are a year-1 estimate at your 24.0% rate — not tax advice; consult a CPA.
Schools (NCES district)
- District
- Elgin ISD
- NCES district ID
- 4818360
- Math proficiency
- 17% ▼ -9.00%
- Reading proficiency
- 26% ▼ -5.00%
- Median HH income
- $55,176
- Composite
- 19.62/100
- National rank
- #8749
- State rank
- #741 of 826 in TX
Livability — Elgin
- Score
- 74/100
- State rank
- #167
- US rank
- #4404
Category grades
Schools grade is shown separately in the Schools card above.
Census & demographics
- Census place
- Elgin, TX
- County
- Bastrop County · 68,601 people
- City population
- 27,860
- Metro
- Austin-Round Rock-Georgetown, TX
- Population (ZIP)
- 30,411
- Household income
- $98,534
- Rent vs Own
- Severe rent burden
- 235.0
Population outlook (Bastrop County) Hauer SSP2
- Today (2025)
- 94,260 people
- By 2030
- 101,355 · +7.5%
- By 2040
- 115,578 · +22.6%
- By 2050
- 129,464 · +37.3%
- By 2075
- 168,068 · +78.3%
- By 2100
- 194,857 · +106.7%
Race, ethnicity, and origin ACS 2023
- Neighborhood character
- Diverse neighborhood (Simpson 0.64)
- Race & ethnicity
- Hispanic / Latino 46% White 38% Two or more races 19% Black 11% Native American 1%
- Hispanic origin (detail)
- Mexican 38%
- Common ancestry
- Slovak 2% Italian 2% Romanian 1%
- Foreign-born
- 17% · Canada, Vietnam
- Languages at home
- 63% English-only · Spanish 36%
Political lean MEDSL · Bastrop
- 2024 margin
- R (+18.4) · D 40.2% · R 58.6% · Other 1.2%
- 2008→2024 swing
- -10.2pp toward R · 2008: -8.2pp · 2024: -18.4pp
- All cycles
- 2024: R+18.4 2020: R+13.8 2016: R+20.4 2012: R+17.0 2008: R+8.2
Not yet ingested
- Civics
- —
Market trends
- HPI YoY
- ▲ 29.47%
- Current HPI
- 416.87
- Rent YoY
- ▲ 3.12%
- Metro
- Austin-Round Rock-Georgetown, TX
- State GDP YoY
- ▲ 3.95%
- F500 in state
- 110
Industry mix (Fortune 500 HQ in TX)
| Industry | F500 HQs | Revenue |
|---|---|---|
| Energy | 16 | $1,198B |
|
||
| Technology | 5 | $198B |
|
||
| Engineering / Construction | 4 | $72B |
|
||
| Energy Services | 3 | $60B |
|
||
| Utilities | 3 | $41B |
|
||
| Healthcare | 2 | $330B |
|
||
Price history
+20.0% since first listed9 events — show timeline
- 2026-04-30 Price Changed $239,900 Unlock MLS
- 2026-04-19 Price Changed $244,900 Unlock MLS
- 2026-04-02 Price Changed $249,900 Unlock MLS
- 2026-03-14 Listed $255,000 Unlock MLS
- 2020-12-28 Sold (Public Records) — Public Records
- 2020-12-23 Sold (MLS) — Unlock MLS
- 2020-11-20 Contingent — Unlock MLS
- 2020-11-17 Listed $199,900 Unlock MLS
- 2013-08-21 Sold (Public Records) — Public Records
Property tax history
+9.0%/yrLatest (2025): $6,867 · -3.6% YoY. Source: county tax records.
Cash-flow waterfall
monthlySold comps — $/sqft
last 12 mo · ≤1 miLoading sold comps…