12 Hidden Valley Dr · Scotchtown, NY
Flood risk 1/10 · Minimal
- FEMA flood zone
- X (unshaded)
- Chance of flooding over 30 yrs
- 0.0%
- Est. flood insurance / yr
- $507 – $1,088
Fire risk 3/10 · Minor
- Est. fire insurance / yr
- $691 – $1,283
Heat risk 4/10 · Minor
- Hot days now (above 100°F)
- 7 days/yr
- Hot days in 30 yrs
- 15 days/yr
Wind risk 4/10 · Minor
- Chance of severe wind over 30 yrs
- 10.0%
Air-quality risk 2/10 · Minimal
- Unhealthy air days now
- 1 days/yr
- Unhealthy air days in 30 yrs
- 2 days/yr
Risk factors via First Street. Map © Google.
Why this score? — see what drove the C- grade
The composite is a weighted blend of 9 inputs, each scored 0–100. Each bar is that input's sub-score; the figure is the points it added to the 100-point composite (weight × sub-score).
- Cash flow +15.8/30.0
- 1% rule +10.0/10.0
- ARV discount +7.5/15.0
- DSCR +4.9/10.0
- Schools +4.8/10.0
- Condition / age +4.0/5.0
- Livability +3.4/5.0
- Rent growth +3.3/5.0
- Appreciation +0.0/10.0
$125,000
🖨 Deal sheet 📄 Offer letter ✓ Due diligence
Listing remarks
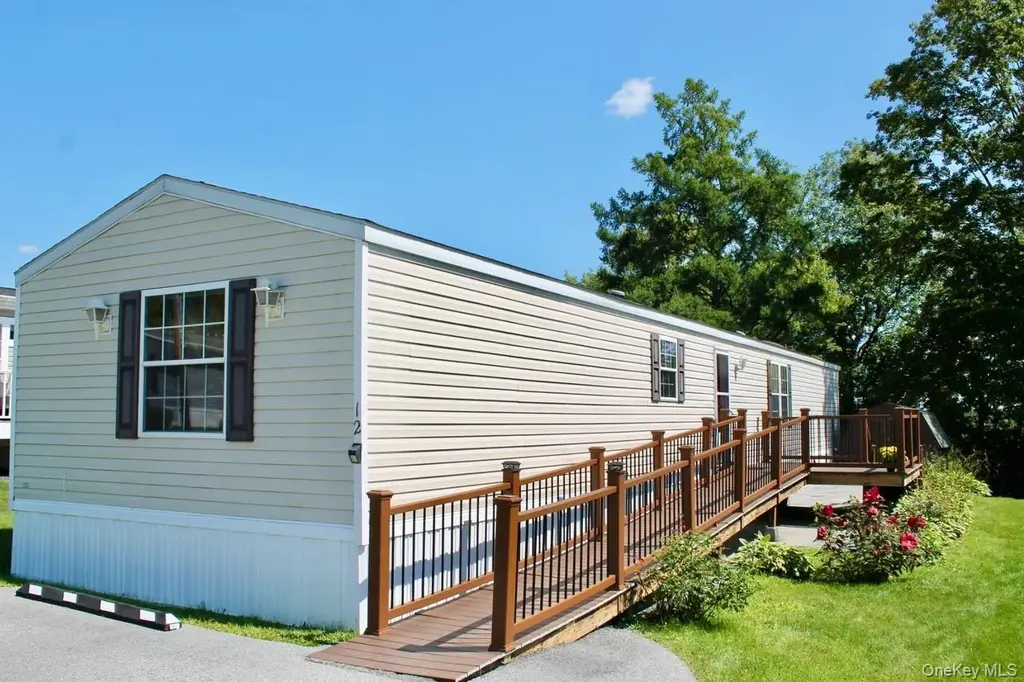
Welcome to 12 Hidden Valley Drive in the desirable Valley View West Mobile Home Park, Scotchtown! This charming 2-bedroom, 2-bath home offers 1,152 sq ft of comfortable living with stunning mountain views right from your private deck. Enjoy the ease of low-maintenance vinyl siding and the convenience of a storage shed for all your extras. Accessibility is a breeze with a wooden ramp leading to your front door. The community’s $928 monthly lot rent covers taxes and garbage, so you can focus on enjoying your home. Nearby, you’ll find convenient shopping at ShopRite, your morning coffee at Dunkin’, and local dining at Scotchtown Craft Kitchen & Bar. Everything you need
Key facts
- Built 1999
- Listed 7 days
Property features AI
Finance
- HOA & community: Community association with monthly fee; Monthly association fee $928; Association fee includes water and sewer
Exterior
- Parking: No carport; No dedicated parking listed
- Utilities: Public sewer; No additional utilities listed
- Home design: Mobile Home; Living area reported from public records
- Construction: Vinyl siding construction
- Exterior features: Vinyl siding; Shed(s); Not waterfront
Interior
- Kitchen: Oven; Refrigerator
- Bedrooms: 5 total rooms (number of bedrooms not specified separately)
- Bathrooms: 2 full bathrooms
- Heating & cooling: Central air conditioning; Forced air heating; Propane heating; Other heating
- Interior features: Deck; Other interior features
- Laundry & utility: No basement
Neighborhood map
What this means for you Summary
Snapshot
- This is a 2-bed/2.0-bath manufactured listed at $125k. Condition is rated good.
Deal economics
- At list price, monthly cash flow is $57 ($685/yr) — positive.
- The deal already cash-flows at list — no discount required.
- Meets the 1% rule at list price ($2k rent vs $125k).
- Cap rate 6.8% vs local median 3.7% in Scotchtown — top-decile yield for the area; either an underpriced asset or a hidden risk that comps aren't pricing in. Stress-test before assuming the spread holds.
Location & tenants
- Location reads 68/100 on livability (#515 in NY) — a middle-class / working-renter tenant base. Strengths: employment A+, housing A+, health & safety A+; Watch: crime C-, cost of living D, amenities F.
- Valley Central School District (Montgomery) (rural): math 54% / reading 53% proficiency, ranked #299 of 590 in NY (top 51%) — acceptable for families but not a draw, mixed tenant base, ~2y average lease.
- Zoned schools: Montgomery Elementary School (math 37% / reading 42%, grade F, #1,444 of 2,108 statewide, top 71%, 548 students, 34% FRL); Valley Central Middle School (math 28% / reading 42%, grade F, #480 of 729 statewide, top 66%, 982 students, 41% FRL); Valley Central High School (math 95% / reading 87%, grade A+, #203 of 1,100 statewide, top 20%, 1,346 students, 39% FRL).
- Market conditions: Rents rising (+3.1%/yr); 57 active listings in the ZIP; solid renter incomes; 1,746 units permitted in Orange County in 2024 (1,265 in 5+ unit buildings).
Forward outlook
- Local home prices are declining (-3.0%/yr); year-one equity from $864 of loan paydown is wiped out by about $4k of value loss. Plan a longer hold.
Negotiation context
- Only 8 days on market — expect competitive offers; lowballing is unlikely to land.
Risks & watch-outs
- Watch-outs: HOA is 40% of rent.
Questions for the listing agent
- What does the HOA fee cover, when was the last increase, and are there any pending special assessments or reserve-fund shortfalls?
- Is there a deadline driving the sale (1031 exchange, divorce, estate, relocation)? That informs how much negotiation room exists.
- Schools are F-rated, which usually means shorter tenancies and higher turnover. Who's the typical renter profile here, and what's been the actual vacancy rate?
- What's the average days-on-market for RENTAL listings here right now (not sales)? A rising rental-DOM trend means longer vacancies and softer asking-rent achievability than the comps imply.
- What's the recent tenant-quality profile in this submarket — average credit score on applications, eviction rate, late-payment / NSF rate, and stable-employment percentage? A property-management company in the area should have these aggregated.
- How much new for-sale + rental construction is in the pipeline within 1–3 miles? Heavy new supply typically softens prices + rents 12–24 months out; constrained supply supports both.
Investment metrics
- 1% rule
- 1.87% ✓
- Cap rate
- 6.84%
- Cash-on-cash
- 1.96%
- DSCR
- 1.09
- GRM
- 4.5
CMA / ARV
No comps found within radius.
Projected returns pro-forma
-3.0% appreciation · 3.15% rent growth · sell at horizon
- IRR
- -12.3%
- Equity multiple
- 0.55×
- Total profit
- $-15,660
- Equity at exit
- $18,638
- IRR
- -2.0%
- Equity multiple
- 0.86×
- Total profit
- $-5,039
- Equity at exit
- $10,808
Cash invested: $35,000 (down + closing). Projections, not guarantees.
Landlord ↔ Tenant lean methodology
- Overall (STATE)
- 15 Strongly Tenant-Friendly
- State New York
- 15 Strongly Tenant-Friendly · D+10
- County
- — inherits STATE
- City
- — inherits STATE
ZIP-level market 10941
- Home prices YoY
- -22.2%
- Rents YoY
- 3.1%
- Active inventory
- 57
- Price-to-rent
- 4.5×
Monthly cashflow live
- Estimated rent
- $2,340 medium interval (Pro) →
- Mortgage (P&I)
- −$656
- Tax est. 1.5%
- −$156 /mo · $1,875/yr
- Insurance
- −$52
- HOA
- −$928
- Vacancy / Maint / Mgmt
- −$491
- Net cashflow
- $57
Break-even live
UW: 25.0% down · 7.5% · 30yr · 1.5% tax · 5.0% vac · 8.0% maint · 8.0% mgmt
Financing live
Cash to close
- Down payment
- $31,250
- Closing costs
- $3,750
- Reserves months
- —
- Total cash needed
- —
Loan-product check · same deal, 3 products live
Conventional
25% down · 7.5% · 30yr
- Down + closing
- —
- Monthly P&I
- —
- Monthly cashflow
- —
- DSCR
- —
- Eligible?
- —
Personal DTI + credit; lowest rate.
DSCR
20% down · 8.5% · 30yr
- Down + closing
- —
- Monthly P&I
- —
- Monthly cashflow
- —
- DSCR
- —
- Eligible?
- —
No personal income docs; deal must DSCR.
Hard money
10% down · 12.0% · 12mo
- Down + closing
- —
- Monthly P&I
- —
- Monthly cashflow
- —
- DSCR
- —
- Eligible?
- —
Short-term bridge; refi at stabilization.
HOA detail
- Monthly dues
- $928 · $11,136/yr
- Likely covers
- trash
Listing history 16 events
-
2026-06-18days on market $125,000 Active 8 DOM
-
2026-06-17days on market $125,000 Active 7 DOM
-
2026-06-16days on market $125,000 Active 6 DOM
-
2026-06-15days on market $125,000 Active 5 DOM
-
2026-06-14statusdays on market $125,000 Active 3 DOM
-
2026-06-10days on market $125,000 Coming Soon 12 DOM
-
2026-06-09days on market $125,000 Coming Soon 11 DOM
-
2026-06-08days on market $125,000 Coming Soon 10 DOM
-
2026-06-07days on market $125,000 Coming Soon 9 DOM
-
2026-06-05days on market $125,000 Coming Soon 6 DOM
-
2026-06-03days on market $125,000 Coming Soon 5 DOM
-
2026-06-02days on market $125,000 Coming Soon 4 DOM
-
2026-06-01days on market $125,000 Coming Soon 3 DOM
-
2026-05-31days on market $125,000 Coming Soon 2 DOM
-
2026-05-30remarks 677-char remark
-
2026-05-30$125,000 Coming Soon 1 DOM
ⓘ Source: listings_history table (triggers on properties + properties_extension) + one-shot
backfill from property_details.listing_events for pre-trigger history.
Climate risk First Street
- Flood 1/10 Low FEMA zone X (unshaded) · 0% chance over 30 yrs
- Wildfire 3/10 Moderate
- Heat 4/10 Moderate 7 d/yr ≥100°F today · 15 d/yr by 30 yrs out
- Wind 4/10 Moderate 10% chance of damaging wind over 30 yrs
- Air quality 2/10 Low 1 unhealthy d/yr today · 2 by 30 yrs out
Nearby sold comps map
Loading sold comps map…
Walkable amenities ~0.75 mi
Loading nearby amenities…
Taxation est. · year 1
- Rental income
- $28,085
- − Mortgage interest
- −$7,002
- − Property taxes
- −$1,875
- − Insurance
- −$625
- − Repairs & maintenance
- −$2,247
- − Management
- −$2,247
- − HOA
- −$11,136
- − Depreciation
- −$3,636
- Taxable loss
- −$683
- Est. tax savings @ 24.0%
- +$164
- After-tax cash flow
- $849/yr
For passive investors: Depreciation is non-cash, so a rental often shows a tax loss while cash-flowing — sheltering income. Rental losses are passive: they offset passive income freely, and up to $25,000/yr can offset ordinary (W-2) income if you actively participate and your MAGI is under $100k (phasing out to $0 by $150k); unused losses carry forward. On sale, claimed depreciation is recaptured at up to 25%, and gains may owe capital-gains tax (a 1031 exchange can defer both). Figures are a year-1 estimate at your 24.0% rate — not tax advice; consult a CPA.
Condition & rehab AI · 1 photo
This well-maintained mobile home in a desirable park offers a good starting point for a cosmetic renovation to enhance its curb appeal and value.
Value-add opportunities
- Both Paint exterior walls — Enhances curb appeal and value
- Both Replace deck and ramp — Improves safety and aesthetics
- Resale Upgrade kitchen appliances — Modernizes the space and attracts buyers
- Both Install smart home features — Enhances convenience and marketability
Renovation cost estimate screening
Value-add ROI direction
- Both Paint exterior walls — Enhances curb appeal and value ↑
- Both Replace deck and ramp — Improves safety and aesthetics ↑
- Resale Upgrade kitchen appliances — Modernizes the space and attracts buyers ↑
- Both Install smart home features — Enhances convenience and marketability ↑
ⓘ Cost ranges are severity-bucket heuristics (US national rule-of-thumb). Get contractor quotes + a written scope before underwriting a rehab budget.
Schools (NCES district)
- District
- Valley Central School District (Montgomery)
- NCES district ID
- 3619680
- Math proficiency
- 54% ▼ -7.00%
- Reading proficiency
- 53% ▲ 1.00%
- Median HH income
- $69,186
- Composite
- 47.53/100
- National rank
- #2271
- State rank
- #299 of 590 in NY
Livability — Scotchtown
- Score
- 68/100
- State rank
- #515
- US rank
- #9142
Category grades
Schools grade is shown separately in the Schools card above.
Census & demographics
- County
- Orange County · 267,004 people
- Metro
- Poughkeepsie-Newburgh-Middletown, NY
- Population (ZIP)
- 14,422
- Household income
- $99,238
- Rent vs Own
- Severe rent burden
- 525.0
Population outlook (Orange County) Hauer SSP2
- Today (2025)
- 379,830 people
- By 2030
- 378,955 · -0.2%
- By 2040
- 375,444 · -1.2%
- By 2050
- 369,311 · -2.8%
- By 2075
- 354,233 · -6.7%
- By 2100
- 318,150 · -16.2%
Race, ethnicity, and origin ACS 2023
- Neighborhood character
- Highly diverse neighborhood (Simpson 0.71)
- Race & ethnicity
- White 44% Hispanic / Latino 23% Black 21% Two or more races 16% Asian 4% Native American 1%
- Hispanic origin (detail)
- Mexican 3% Puerto Rican 9% Cuban 1% Dominican 3%
- Common ancestry
- Romanian 4% Hispanic 3% Italian 1%
- Foreign-born
- 16% · Canada, Jamaica, Dominican Republic
- Languages at home
- 72% English-only · Spanish 14% Other Indo-European 4% French/Haitian/Cajun 3%
Political lean MEDSL · Orange
- 2024 margin
- Lean R (+8.4) · D 45.8% · R 54.2%
- 2008→2024 swing
- -12.5pp toward R · 2008: 4.1pp · 2024: -8.4pp
- All cycles
- 2024: R+8.4 2020: R+0.2 2016: R+6.5 2012: D+5.2 2008: D+4.1
Not yet ingested
- Civics
- —
Market trends
- HPI YoY
- ▼ -93.38%
- Current HPI
- 326.3597
- Rent YoY
- ▲ 3.15%
- Metro
- Poughkeepsie-Newburgh-Middletown, NY
- State GDP YoY
- ▲ 2.60%
- F500 in state
- 92
Industry mix (Fortune 500 HQ in NY)
| Industry | F500 HQs | Revenue |
|---|---|---|
| Financial Services | 10 | $950B |
|
||
| Consumer Goods | 9 | $162B |
|
||
| Insurance | 4 | $225B |
|
||
| Telecommunications | 2 | $144B |
|
||
| Pharmaceuticals | 2 | $112B |
|
||
| Media / Entertainment | 2 | $69B |
|
||
Price history
1 event — show timeline
- 2026-05-29 Coming Soon $125,000 OneKey® MLS as Distributed by MLS Grid
Cash-flow waterfall
monthlySold comps — $/sqft
last 12 mo · ≤1 miLoading sold comps…