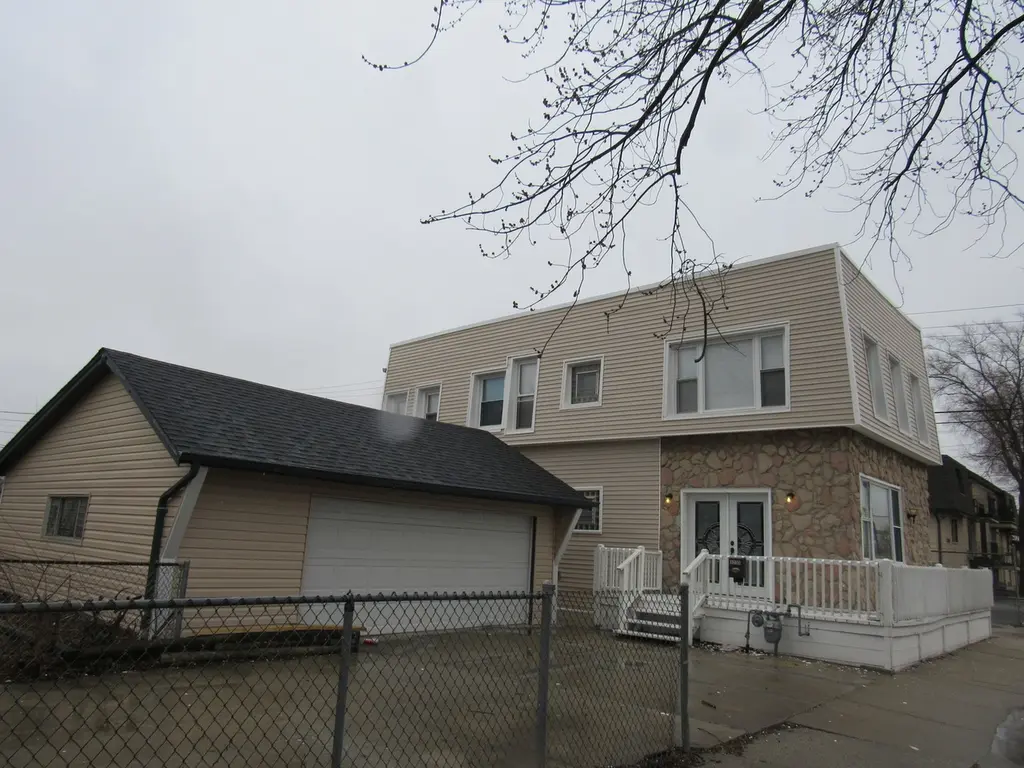
3235 S 50th Ct · Cicero, IL
Flood risk 6/10 · Moderate
- FEMA flood zone
- X (unshaded)
- Chance of flooding over 30 yrs
- 0.74%
- Est. flood insurance / yr
- $473 – $860
Fire risk 1/10 · Minimal
- Est. fire insurance / yr
- $804 – $1,492
Heat risk 3/10 · Minor
- Hot days now (above 99°F)
- 7 days/yr
- Hot days in 30 yrs
- 15 days/yr
Wind risk 2/10 · Minimal
- Chance of severe wind over 30 yrs
- 1.0%
Air-quality risk 4/10 · Minor
- Unhealthy air days now
- 3 days/yr
- Unhealthy air days in 30 yrs
- 5 days/yr
Risk factors via First Street. Map © Google.
Why this score? — see what drove the D- grade
The composite is a weighted blend of 9 inputs, each scored 0–100. Each bar is that input's sub-score; the figure is the points it added to the 100-point composite (weight × sub-score).
- ARV discount +13.0/15.0
- Cash flow +8.2/30.0
- Livability +4.1/5.0
- Rent growth +3.1/5.0
- Condition / age +2.5/5.0
- 1% rule +2.4/10.0
- DSCR +2.2/10.0
- Schools +1.1/10.0
- Appreciation +0.0/10.0
$270,000
🖨 Deal sheet (PDF) 📄 Offer letter ✓ Due diligence
Listing remarks
Spacious 2-story home situated on a rare double lot in Cicero! This well-maintained property offers 3 bedrooms, 2 full bathrooms and 1 half bath, providing a functional layout with generous living space and great natural light throughout. The main level features comfortable living and dining areas ideal for everyday living and entertaining. The oversized double lot offers exceptional outdoor potential - perfect for gatherings, expansion, or future possibilities. Property also includes a 2-car garage plus additional exterior parking. Great opportunity to own a solid home with valuable land in an established neighborhood. Conveniently located just minutes from Walmart Supercenter, Target, pop
Key facts
- Easy access
- Double lot
- Outdoor potential
Tags
Property features AI
Finance
- Other: Living area source: assessor
- HOA & community: No master association fee required
Exterior
- Parking: Detached garage; 2 garage spaces (2 total parking spaces)
- Utilities: Water from Lake Michigan; Public sewer
- Home design: Detached single-family home; 2-story layout; Fee simple ownership; Rehab completed in 2016 (property was rehabbing); Built before 1978
- Construction: Frame and stone construction
- Exterior features: School bus service available; Interstate access nearby; Lot dimensions approximately 47 x 126
Interior
- Kitchen: Kitchen on main level (12 x 11)
- Bedrooms: 3 bedrooms total; Master bedroom on second level (18 x 13); Second bedroom on second level (12 x 8); Third bedroom on second level (10 x 8)
- Bathrooms: 2 full bathrooms; 1 half bathroom
- Heating & cooling: Natural gas forced-air heating; Central air conditioning
- Interior features: 8 total rooms; Office on main level; Bonus room on second level; Family room; Living room on main level (20 x 14); Dining room on main level (13 x 7)
- Laundry & utility: Laundry room
Neighborhood map
What this means for you Summary
Snapshot
- This is a 3-bed/2.5-bath single-family listed at $270k.
Deal economics
- At list price, monthly cash flow is $-254 ($-3k/yr) — negative.
- To cash-flow at today's rent, offer at most $225k (16.6% below list).
- To meet the 1% rule (rent ≥ 1% of price), the offer needs to be $201k (25.5% below list).
- Recommended offer: $201k (25.5% below list) — sets the bar for 1% rule.
Location & tenants
- Location reads 82/100 on livability (#77 in IL, #1,276 nationally) — a professional / high-income tenant draw. Strengths: commute A+, cost of living A+, housing A+; Watch: schools F.
- J S Morton Hsd 201 (suburban): math 9% / reading 14% proficiency, ranked #557 of 620 in IL (top 90%) — low school quality limits family demand, transient renter base, plan for 1-2y turnover.
- Market conditions: Rents rising (+2.4%/yr); 109 active listings in the ZIP; 4 comparable units currently listed for rent nearby; rentals at typical pace (median 22d on market — plan ~3-4 weeks tenant-placement turnaround); 6,272 units permitted in Cook County in 2024 (4,658 in 5+ unit buildings).
- This rent runs 34% of the median local income ($71k/yr) — at the standard rent-burdened threshold; future hikes will face affordability resistance.
Forward outlook
- Local home prices are declining (-3.0%/yr); year-one equity from $2k of loan paydown is wiped out by about $8k of value loss. Plan a longer hold.
Negotiation context
- It's been on market 75 days — a 6% lower offer ($254k) is reasonable based on typical stale-listing flexibility.
- 22 sale attempts since 16y ago with the ask held roughly flat each time — persistent listings suggest the price (not the market) is what's stuck; bring a comps-based counter.
- Current owner paid $195k; 38% above their basis — modest negotiation headroom, anchor on the comps not their cost.
Risks & watch-outs
- Watch-outs: built in 1954 — expect roof / HVAC / electrical / plumbing capex.
- Climate carrying-cost: major flood risk — expect insurance premiums to compound above CPI over the hold.
Questions for the listing agent
- What do current leases actually rent for vs. the listed asking? Can we see a recent rent roll and the last 12 months of T-12 income?
- It's been on market 75 days. Have you received any prior offers? Is the seller open to a 26% concession, seller financing, or rate buy-down credit?
- Built in 1954 — when were the roof, HVAC, electrical panel, plumbing, and water heater last replaced?
- Why hasn't it sold? Are there any deal-killer items the seller is aware of (foundation, flood, title, zoning, code violations)?
- Is there a deadline driving the sale (1031 exchange, divorce, estate, relocation)? That informs how much negotiation room exists.
- Schools are F-rated, which usually means shorter tenancies and higher turnover. Who's the typical renter profile here, and what's been the actual vacancy rate?
- The area grade is low — what's the realistic commute time and amenity access for the typical tenant pool here? Any planned neighborhood developments (good or bad) we should know about?
- What's the average days-on-market for RENTAL listings here right now (not sales)? A rising rental-DOM trend means longer vacancies and softer asking-rent achievability than the comps imply.
- What's the recent tenant-quality profile in this submarket — average credit score on applications, eviction rate, late-payment / NSF rate, and stable-employment percentage? A property-management company in the area should have these aggregated.
- How much new for-sale + rental construction is in the pipeline within 1–3 miles? Heavy new supply typically softens prices + rents 12–24 months out; constrained supply supports both.
Investment metrics
- 1% rule
- 0.74% ✗
- Cap rate
- 5.17%
- Cash-on-cash
- -4.03%
- DSCR
- 0.82
- GRM
- 11.2
CMA / ARV
- ARV (on-the-fly)
- $307,440
- Comps found
- 12
Show comp detail 12 sales within ~0.75 mi
| Address | Dist | Beds/Ba | Sqft | Sold | Price | $/sf | Match |
|---|---|---|---|---|---|---|---|
| 5057 W 32nd Pl | 0.07mi | 3/3.0 | 1,653 (-2%) | 4mo | $255,000 | $154 | 88 |
| 5123 W 31st St | 0.26mi | 3/2.5 | 1,600 (-5%) | 6mo | $350,000 | $219 | 75 |
| 3141 S 54th Ct | 0.50mi | 3/2.0 | 1,614 (-4%) | 4mo | $371,297 | $230 | 65 |
| 3632 S 52nd Ct | 0.56mi | 4/1.5 (+1) | 1,687 (+0%) | 2mo | $150,000 | $89 | 62 |
| 5110 W 30 St | 0.39mi | 3/2.0 | 1,620 (-4%) | 18mo | $257,000 | $159 | 59 |
| 3215 S 54th Ct | 0.49mi | 3/3.0 | 1,782 (+6%) | 8mo | $349,000 | $196 | 59 |
| 5309 W 30th St | 0.48mi | 4/2.0 (+1) | 1,800 (+7%) | 1mo | $330,000 | $183 | 58 |
| 3517 S 52nd Ct | 0.41mi | 4/2.0 (+1) | 1,500 (-11%) | 2mo | $319,900 | $213 | 54 |
| 3137 S 54th Ct | 0.50mi | 4/3.0 (+1) | 1,479 (-12%) | 2mo | $291,500 | $197 | 48 |
| 2936 S 48th Ct | 0.44mi | 3/1.0 | 1,903 (+13%) | 8mo | $240,000 | $126 | 45 |
| 5226 W 30th Pl | 0.39mi | 3/1.0 | 1,500 (-11%) | 21mo | $269,900 | $180 | 40 |
| 3509 S 55 Ct | 0.69mi | 3/2.0 | 1,800 (+7%) | 17mo | $320,000 | $178 | 40 |
Match score weights: distance 35% · size 25% · config 20% · recency 20%. Top-matched comps best support the ARV.
Projected returns pro-forma
-3.0% appreciation · 2.43% rent growth · sell at horizon
- IRR
- -23.7%
- Equity multiple
- 0.19×
- Total profit
- $-61,043
- Equity at exit
- $40,258
- IRR
- -20.2%
- Equity multiple
- -0.04×
- Total profit
- $-78,552
- Equity at exit
- $23,345
Cash invested: $75,600 (down + closing). Projections, not guarantees.
Landlord ↔ Tenant lean methodology
- Overall (STATE)
- 43 Moderately Tenant-Leaning
- State Illinois
- 43 Moderately Tenant-Leaning · D+7
- County
- — inherits STATE
- City
- — inherits STATE
ZIP-level market 60804
- Rents YoY
- 2.4%
- Active inventory
- 109
- Price-to-rent
- 11.2×
Monthly cashflow live
- Estimated rent
- $2,011 medium interval (Pro) →
- Mortgage (P&I)
- −$1,416
- Tax from tax record
- −$314 /mo · $3,772/yr
- Insurance
- −$112
- HOA
- −$0
- Vacancy / Maint / Mgmt
- −$422
- Net cashflow
- $-254
Break-even live
Sensitivity live
| Price | -10% $-101 | -5% $-177 | +0% $-254 | +5% $-330 | +10% $-407 |
|---|---|---|---|---|---|
| Rent | -10% $-413 | -5% $-333 | +0% $-254 | +5% $-174 | +10% $-95 |
| Rate | -1.0pp $-118 | -0.5pp $-185 | base $-254 | +0.5pp $-324 | +1.0pp $-395 |
UW: 25.0% down · 7.5% · 30yr · 1.5% tax · 5.0% vac · 8.0% maint · 8.0% mgmt
Financing live
Cash to close
- Down payment
- $67,500
- Closing costs
- $8,100
- Reserves months
- —
- Total cash needed
- —
Loan-product check · same deal, 3 products live
Conventional
25% down · 7.5% · 30yr
- Down + closing
- —
- Monthly P&I
- —
- Monthly cashflow
- —
- DSCR
- —
- Eligible?
- —
Personal DTI + credit; lowest rate.
DSCR
20% down · 8.5% · 30yr
- Down + closing
- —
- Monthly P&I
- —
- Monthly cashflow
- —
- DSCR
- —
- Eligible?
- —
No personal income docs; deal must DSCR.
Hard money
10% down · 12.0% · 12mo
- Down + closing
- —
- Monthly P&I
- —
- Monthly cashflow
- —
- DSCR
- —
- Eligible?
- —
Short-term bridge; refi at stabilization.
Rent comps 4 comps
| Address | Beds | Baths | Sqft | Rent | $/sqft | DOM | Units | Dist |
|---|---|---|---|---|---|---|---|---|
| 3222 S 52nd Ct Cicero, IL | 3.0 | 2.0 | 1627 | $5,850 | $3.60 | 0d | 1 | 0.27mi |
| 3633 S 57th Ct Cicero, IL | 3.0 | 2.5 | 1708 | $2,500 | $1.46 | 22d | 1 | 0.99mi |
| 2119 S 51st Ave Unit 1 Cicero, IL | 2.0 | 1.0 | 1100 | $1,625 | $1.48 | 3d | 1 | 1.32mi |
| 5529 W 22nd Pl #2 Cicero, IL | 3.0 | 1.0 | 1400 | $1,900 | $1.36 | 25d | 1 | 1.35mi |
Listing history 50 events
-
2026-06-01days on market $270,000 Active 75 DOM
-
2026-05-31days on market $270,000 Active 74 DOM
-
2026-03-18$270,000 Active
-
2026-03-18historical
-
2026-03-01Active
-
2025-11-10historical
-
2025-05-29price
-
2025-04-07status Active
-
2025-04-02historical Contingent - No Showings
-
2025-01-03price
-
2024-11-20price
-
2024-11-19Active
-
2019-07-24soldstatus $195,000
-
2019-07-22soldstatus $195,000 Closed Sale
-
2019-06-07status Pending
-
2019-04-04$209,900 New
-
2018-09-05historical
-
2018-04-28status Reactivated
-
2018-03-21historical Contingent
-
2018-03-01status Reactivated
-
2018-02-05historical Contingent
-
2017-11-09New
-
2017-09-30historical
-
2017-07-12price
-
2017-03-14New
-
2017-01-26soldstatus $95,000
-
2016-10-20soldstatus $95,000 Closed Sale
-
2016-09-21status Pending
-
2016-09-01historical Contingent
-
2016-08-11$105,000 New
-
2016-08-11historical
-
2016-07-26price
-
2016-07-07price
-
2016-06-27New
-
2016-06-25historical
-
2016-06-15status Reactivated
-
2016-05-27historical Contingent
-
2016-05-04New
-
2016-04-27historical
-
2016-04-26status Reactivated
-
2016-04-09status Pending
-
2016-02-18price
-
2016-02-17status Reactivated
-
2015-12-10status Pending
-
2015-11-26price
-
2015-09-26price
-
2015-09-04New
-
2015-08-31historical
-
2015-08-05New
-
2013-01-17soldstatus $38,000
ⓘ Source: listings_history table (triggers on properties + properties_extension) + one-shot
backfill from property_details.listing_events for pre-trigger history.
Tax reassessment forecast IL · Partial reset (capped growth)
- Current annual tax
- $3,772 · $314/mo
- Projected year-2 tax
- $4,950 · $413/mo
- Expected delta
- +$1,179/yr (+$98/mo · 31.2%)
ⓘ Screening estimate from a state-policy table — verify with the county assessor before closing.
Climate risk First Street
- Flood 6/10 Major FEMA zone X (unshaded) · 74% chance over 30 yrs
- Wildfire 1/10 Low
- Heat 3/10 Moderate 7 d/yr ≥99°F today · 15 d/yr by 30 yrs out
- Wind 2/10 Low 100% chance of damaging wind over 30 yrs
- Air quality 4/10 Moderate 3 unhealthy d/yr today · 5 by 30 yrs out
Nearby sold comps map
Loading sold comps map…
Walkable amenities ~0.75 mi
Loading nearby amenities…
Taxation est. · year 1
- Rental income
- $24,137
- − Mortgage interest
- −$15,124
- − Property taxes
- −$3,772
- − Insurance
- −$1,350
- − Repairs & maintenance
- −$1,931
- − Management
- −$1,931
- − Depreciation
- −$7,855
- Taxable loss
- −$7,826
- Est. tax savings @ 24.0%
- +$1,878
- After-tax cash flow
- $-1,167/yr
For passive investors: Depreciation is non-cash, so a rental often shows a tax loss while cash-flowing — sheltering income. Rental losses are passive: they offset passive income freely, and up to $25,000/yr can offset ordinary (W-2) income if you actively participate and your MAGI is under $100k (phasing out to $0 by $150k); unused losses carry forward. On sale, claimed depreciation is recaptured at up to 25%, and gains may owe capital-gains tax (a 1031 exchange can defer both). Figures are a year-1 estimate at your 24.0% rate — not tax advice; consult a CPA.
Schools (NCES district)
- District
- J S Morton Hsd 201
- NCES district ID
- 1726880
- Math proficiency
- 9% ▲ 1.00%
- Reading proficiency
- 14% ▼ -1.00%
- Median HH income
- $48,698
- Composite
- 10.73/100
- National rank
- #9768
- State rank
- #557 of 620 in IL
Livability — Cicero
- Score
- 82/100
- State rank
- #77
- US rank
- #1276
Category grades
Schools grade is shown separately in the Schools card above.
Census & demographics
- Census place
- Cicero, IL
- County
- Cook County · 4,486,803 people
- City population
- 82,797
- Metro
- Chicago-Naperville-Elgin, IL-IN-WI
- Population (ZIP)
- 82,797
- Household income
- $70,842
- Rent vs Own
- Severe rent burden
- 2178.0
Population outlook (Cook County) Hauer SSP2
- Today (2025)
- 5,347,519 people
- By 2030
- 5,357,703 · +0.2%
- By 2040
- 5,324,924 · -0.4%
- By 2050
- 5,230,762 · -2.2%
- By 2075
- 4,785,735 · -10.5%
- By 2100
- 4,188,836 · -21.7%
Race, ethnicity, and origin ACS 2023
- Neighborhood character
- Predominantly Hispanic (89%)
- Race & ethnicity
- Hispanic / Latino 89% Two or more races 17% White 7% Black 3% Native American 2%
- Hispanic origin (detail)
- Mexican 80% Puerto Rican 3%
- Common ancestry
- Romanian 2%
- Foreign-born
- 40% · Canada, Jamaica
- Languages at home
- 18% English-only · Spanish 80%
Political lean MEDSL · Cook
- 2024 margin
- Solid D (+42.0) · D 70.4% · R 28.4% · Other 1.2%
- 2008→2024 swing
- -11.4pp toward R · 2008: 53.4pp · 2024: 42.0pp
- All cycles
- 2024: D+42.0 2020: D+50.3 2016: D+53.0 2012: D+49.4 2008: D+53.4
Not yet ingested
- Civics
- —
Market trends
- HPI YoY
- ▼ -165.38%
- Current HPI
- 262.83
- Rent YoY
- ▲ 2.43%
- Metro
- Chicago-Naperville-Elgin, IL-IN-WI
- State GDP YoY
- ▲ 1.59%
- F500 in state
- 60
Industry mix (Fortune 500 HQ in IL)
| Industry | F500 HQs | Revenue |
|---|---|---|
| Insurance | 4 | $201B |
|
||
| Consumer Goods | 4 | $87B |
|
||
| Industrial Machinery | 3 | $64B |
|
||
| Healthcare | 2 | $55B |
|
||
| Retail / Pharmacy | 1 | $148B |
|
||
| Agriculture / Food | 1 | $86B |
|
||
Price history
+1700.0% since first listed66 events — show timeline
- 2026-03-18 Listing Removed — MRED as Distributed by MLS Grid
- 2026-03-18 Listed $270,000 MRED as Distributed by MLS Grid
- 2026-03-01 Listed — MRED as Distributed by MLS Grid
- 2025-11-10 Listing Removed — MRED as Distributed by MLS Grid
- 2025-05-29 Price Changed — MRED as Distributed by MLS Grid
- 2025-04-07 Relisted — MRED as Distributed by MLS Grid
- 2025-04-02 Contingent — MRED as Distributed by MLS Grid
- 2025-01-03 Price Changed — MRED as Distributed by MLS Grid
- 2024-11-20 Price Changed — MRED as Distributed by MLS Grid
- 2024-11-19 Listed — MRED as Distributed by MLS Grid
- 2019-07-24 Sold (Public Records) $195,000 Public Records
- 2019-07-22 Sold (MLS) $195,000 MRED as Distributed by MLS Grid
- 2019-06-07 Pending — MRED as Distributed by MLS Grid
- 2019-04-04 Listed $209,900 MRED as Distributed by MLS Grid
- 2018-09-05 Listing Removed — MRED as Distributed by MLS Grid
- 2018-04-28 Relisted — MRED as Distributed by MLS Grid
- 2018-03-21 Contingent — MRED as Distributed by MLS Grid
- 2018-03-01 Relisted — MRED as Distributed by MLS Grid
- 2018-02-05 Contingent — MRED as Distributed by MLS Grid
- 2017-11-09 Listed — MRED as Distributed by MLS Grid
- 2017-09-30 Listing Removed — MRED as Distributed by MLS Grid
- 2017-07-12 Price Changed — MRED as Distributed by MLS Grid
- 2017-03-14 Listed — MRED as Distributed by MLS Grid
- 2017-01-26 Sold (Public Records) $95,000 Public Records
- 2016-10-20 Sold (MLS) $95,000 MRED as Distributed by MLS Grid
- 2016-09-21 Pending — MRED as Distributed by MLS Grid
- 2016-09-01 Contingent — MRED as Distributed by MLS Grid
- 2016-08-11 Listed $105,000 MRED as Distributed by MLS Grid
- 2016-08-11 Listing Removed — MRED as Distributed by MLS Grid
- 2016-07-26 Price Changed — MRED as Distributed by MLS Grid
- 2016-07-07 Price Changed — MRED as Distributed by MLS Grid
- 2016-06-27 Listed — MRED as Distributed by MLS Grid
- 2016-06-25 Listing Removed — MRED as Distributed by MLS Grid
- 2016-06-15 Relisted — MRED as Distributed by MLS Grid
- 2016-05-27 Contingent — MRED as Distributed by MLS Grid
- 2016-05-04 Listed — MRED as Distributed by MLS Grid
- 2016-04-27 Listing Removed — MRED as Distributed by MLS Grid
- 2016-04-26 Relisted — MRED as Distributed by MLS Grid
- 2016-04-09 Pending — MRED as Distributed by MLS Grid
- 2016-02-18 Price Changed — MRED as Distributed by MLS Grid
- 2016-02-17 Relisted — MRED as Distributed by MLS Grid
- 2015-12-10 Pending — MRED as Distributed by MLS Grid
- 2015-11-26 Price Changed — MRED as Distributed by MLS Grid
- 2015-09-26 Price Changed — MRED as Distributed by MLS Grid
- 2015-09-04 Listed — MRED as Distributed by MLS Grid
- 2015-08-31 Listing Removed — MRED as Distributed by MLS Grid
- 2015-08-05 Listed — MRED as Distributed by MLS Grid
- 2013-01-17 Sold (Public Records) $38,000 Public Records
- 2013-01-14 Sold (MLS) $38,000 MRED as Distributed by MLS Grid
- 2012-12-17 Pending — MRED as Distributed by MLS Grid
- 2012-11-29 Listed $34,900 MRED as Distributed by MLS Grid
- 2012-11-28 Listing Removed — MRED as Distributed by MLS Grid
- 2012-11-20 Relisted — MRED as Distributed by MLS Grid
- 2012-09-28 Contingent — MRED as Distributed by MLS Grid
- 2012-09-10 Price Changed — MRED as Distributed by MLS Grid
- 2012-09-06 Relisted — MRED as Distributed by MLS Grid
- 2012-07-25 Contingent — MRED as Distributed by MLS Grid
- 2012-07-16 Price Changed — MRED as Distributed by MLS Grid
- 2012-06-12 Price Changed — MRED as Distributed by MLS Grid
- 2012-05-09 Listed — MRED as Distributed by MLS Grid
- 2011-03-21 Listing Removed — MRED as Distributed by MLS Grid
- 2010-12-10 Listed — MRED as Distributed by MLS Grid
- 2003-03-04 Sold (Public Records) $160,000 Public Records
- 1999-04-29 Sold (Public Records) $93,000 Public Records
- 1993-11-19 Sold (Public Records) $21,000 Public Records
- 1981-10-16 Sold (Public Records) $15,000 Public Records
Property tax history
+3.9%/yrLatest (2023): $3,772 · -4.0% YoY. Source: county tax records.
Cash-flow waterfall
monthlySold comps — $/sqft
last 12 mo · ≤1 miLoading sold comps…