 Duplex
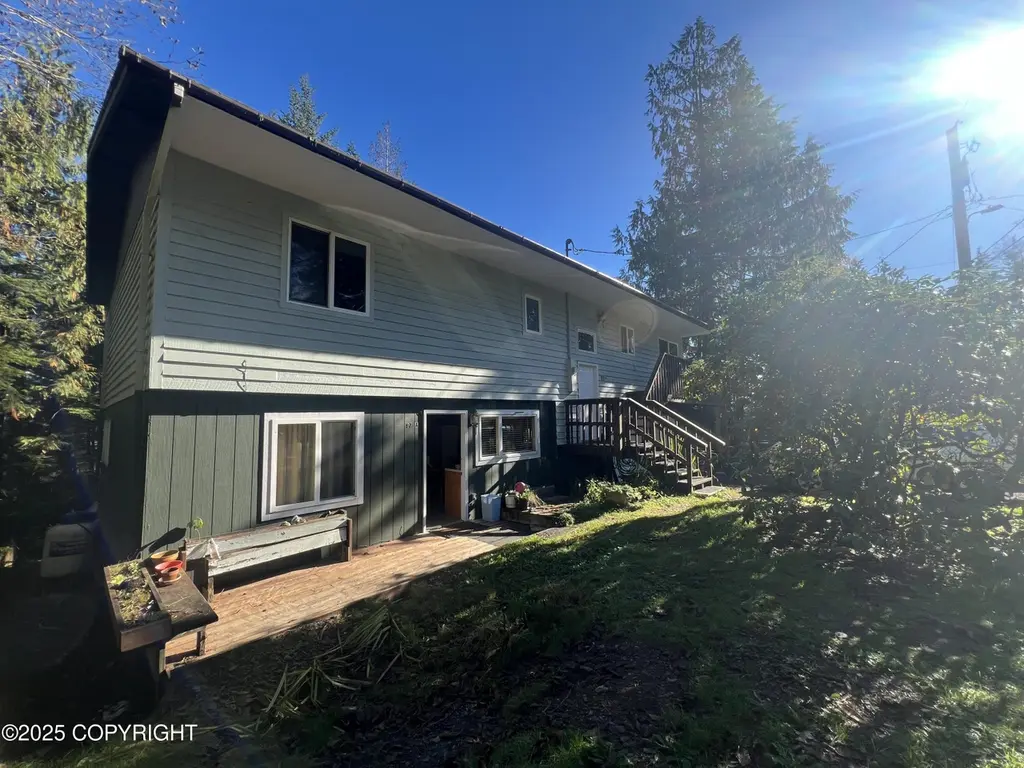
97 Huckleberry Cir · Saxman, AK
Flood risk 1/10 · Minimal
- FEMA flood zone
- —
- Chance of flooding over 30 yrs
- 0.0%
- Est. flood insurance / yr
- —
Fire risk No data
- Est. fire insurance / yr
- —
Heat risk No data
- Hot days now (above threshold)
- —
- Hot days in 30 yrs
- —
Wind risk No data
- Chance of severe wind over 30 yrs
- —
Air-quality risk 1/10 · Minimal
- Unhealthy air days now
- —
- Unhealthy air days in 30 yrs
- —
Risk factors via First Street. Map © Google.
Why this score? — see what drove the D grade
The composite is a weighted blend of 9 inputs, each scored 0–100. Each bar is that input's sub-score; the figure is the points it added to the 100-point composite (weight × sub-score).
- ARV discount +11.8/15.0
- Cash flow +11.5/30.0
- Schools +5.0/10.0
- DSCR +3.4/10.0
- Livability +2.7/5.0
- 1% rule +2.6/10.0
- Rent growth +2.5/5.0
- Condition / age +2.5/5.0
- Appreciation +0.0/10.0
$505,000
🖨 Deal sheet (PDF) 📄 Offer letter ✓ Due diligence
Multi-family units
County records classify this as Multi-Family (2-4 Unit). Listing-text estimate: 2 units. confirmed
Listing remarks MLS
Bright, spacious, and well-maintained duplex in Forest Park. Plenty of natural light, private decks for each unit, and lots of surrounding trees for privacy and peace! Upstairs is 3/2 and downstairs is 1/1. Secure this fantastic opportunity!
Key facts
- Private decks
- Natural light
- Surrounding trees
Tags
Neighborhood map
What this means for you Summary
Snapshot
- This is a 2 × 2-bed/1.5-bath units multifamily listed at $505k.
Deal economics
- At list price, monthly cash flow is $-170 ($-2k/yr) — negative. Per door: $-85/mo.
- To cash-flow at today's rent, offer at most $475k (6.0% below list).
- To meet the 1% rule (rent ≥ 1% of price), the offer needs to be $383k (24.2% below list).
- Recommended offer: $383k (24.2% below list) — sets the bar for 1% rule.
Location & tenants
- Location reads 54/100 on livability (#157 in AK) — a working-class tenant base; expect higher turnover. Strengths: cost of living B+; Watch: health & safety C-, crime F, amenities F.
- Zoned schools: Houghtaling Elementary (math 37% / reading 42%, grade F, #75 of 156 statewide, top 52%, 310 students, 59% FRL); Schoenbar Middle School (math 30% / reading 36%, grade F, #26 of 36 statewide, top 71%, 269 students, 40% FRL); Ketchikan High School (math 42% / reading 42%, grade F, #17 of 61 statewide, top 32%, 498 students, 28% FRL).
- Market conditions: 100 active listings in the ZIP; 73 units permitted in Ketchikan Gateway Borough in 2024 (14 in 5+ unit buildings).
Forward outlook
- Local home prices are declining (-3.0%/yr); year-one equity from $3k of loan paydown is wiped out by about $15k of value loss. Plan a longer hold.
- Ketchikan Gateway County population projected at +4% by 2050 — modest demand growth; plan on rents tracking national, not racing it.
Negotiation context
- It's been on market 251 days — a 12% lower offer ($444k) is reasonable based on typical stale-listing flexibility.
Questions for the listing agent
- What do current leases actually rent for vs. the listed asking? Can we see a recent rent roll and the last 12 months of T-12 income?
- It's been on market 251 days. Have you received any prior offers? Is the seller open to a 24% concession, seller financing, or rate buy-down credit?
- Can we see the unit-by-unit rent roll, current vacancy, and any below-market leases? What's the average tenancy length?
- What capital expenditures (roof, boiler, parking lot, exteriors) have been made in the last 5 years, and what's planned in the next 2?
- Built in 1979 — when were the roof, HVAC, electrical panel, plumbing, and water heater last replaced?
- Why hasn't it sold? Are there any deal-killer items the seller is aware of (foundation, flood, title, zoning, code violations)?
- Is there a deadline driving the sale (1031 exchange, divorce, estate, relocation)? That informs how much negotiation room exists.
- Schools are F-rated, which usually means shorter tenancies and higher turnover. Who's the typical renter profile here, and what's been the actual vacancy rate?
- Crime grade is F in this area — have there been break-ins, vandalism, or insurance claims at this property in the last 3 years? What carrier currently insures it and at what premium?
- The area grade is low — what's the realistic commute time and amenity access for the typical tenant pool here? Any planned neighborhood developments (good or bad) we should know about?
- What's the average days-on-market for RENTAL listings here right now (not sales)? A rising rental-DOM trend means longer vacancies and softer asking-rent achievability than the comps imply.
- What's the recent tenant-quality profile in this submarket — average credit score on applications, eviction rate, late-payment / NSF rate, and stable-employment percentage? A property-management company in the area should have these aggregated.
- How much new apartment / multifamily construction is in the pipeline within 1–3 miles? Heavy new supply (>2% of stock underway) typically softens rents 12–24 months out; light construction supports rent growth.
Investment metrics
- 1% rule
- 0.76% ✗
- Cap rate
- 5.89%
- Cash-on-cash
- -1.45%
- DSCR
- 0.94
- GRM
- 11.0
CMA / ARV
- ARV (median comp)
- $558,473
- List price
- $505,000
- Delta
- -9.57%
- Verdict
- FAIR
- Comps
- 1 within 2.0 mi
Projected returns pro-forma
-3.0% appreciation · 3.0% rent growth · sell at horizon
- IRR
- -18.7%
- Equity multiple
- 0.34×
- Total profit
- $-92,813
- Equity at exit
- $75,297
- IRR
- -11.2%
- Equity multiple
- 0.33×
- Total profit
- $-95,305
- Equity at exit
- $43,663
Cash invested: $141,400 (down + closing). Projections, not guarantees.
Landlord ↔ Tenant lean methodology
- Overall (STATE)
- 80 Strongly Landlord-Friendly
- State Alaska
- 80 Strongly Landlord-Friendly · R+8
- County
- — inherits STATE
- City
- — inherits STATE
ZIP-level market 99901
- Home prices YoY
- -33.4%
- Active inventory
- 100
- Price-to-rent
- 22.0×
Monthly cashflow live
- Estimated rent
- $3,827 medium interval (Pro) →
- Mortgage (P&I)
- −$2,648
- Tax from tax record
- −$335 /mo · $4,021/yr
- Insurance
- −$210
- HOA
- −$0
- Vacancy / Maint / Mgmt
- −$804
- Net cashflow
- $-170
Break-even live
Sensitivity live
| Price | -10% $115 | -5% $-28 | +0% $-170 | +5% $-313 | +10% $-456 |
|---|---|---|---|---|---|
| Rent | -10% $-473 | -5% $-322 | +0% $-170 | +5% $-19 | +10% $132 |
| Rate | -1.0pp $84 | -0.5pp $-42 | base $-170 | +0.5pp $-301 | +1.0pp $-434 |
2-unit breakdown (identical units grouped — click to expand)
| Units | Beds | Baths | Est. rent |
|---|---|---|---|
| 2× units | 2 | 1.5 | $3,826 |
| #1 | 2 | 1.5 | $1,913 |
| #2 | 2 | 1.5 | $1,913 |
| Total (2 units) | $3,827 | ||
UW: 25.0% down · 7.5% · 30yr · 1.5% tax · 5.0% vac · 8.0% maint · 8.0% mgmt
Financing live
Cash to close
- Down payment
- $126,250
- Closing costs
- $15,150
- Reserves months
- —
- Total cash needed
- —
Loan-product check · same deal, 3 products live
Conventional
25% down · 7.5% · 30yr
- Down + closing
- —
- Monthly P&I
- —
- Monthly cashflow
- —
- DSCR
- —
- Eligible?
- —
Personal DTI + credit; lowest rate.
DSCR
20% down · 8.5% · 30yr
- Down + closing
- —
- Monthly P&I
- —
- Monthly cashflow
- —
- DSCR
- —
- Eligible?
- —
No personal income docs; deal must DSCR.
Hard money
10% down · 12.0% · 12mo
- Down + closing
- —
- Monthly P&I
- —
- Monthly cashflow
- —
- DSCR
- —
- Eligible?
- —
Short-term bridge; refi at stabilization.
Listing history 17 events
-
2026-06-21days on market $505,000 Active 251 DOM
-
2026-06-19days on market $505,000 Active 249 DOM
-
2026-06-18days on market $505,000 Active 248 DOM
-
2026-06-17days on market $505,000 Active 247 DOM
-
2026-06-16days on market $505,000 Active 246 DOM
-
2026-06-15days on market $505,000 Active 245 DOM
-
2026-06-14days on market $505,000 Active 243 DOM
-
2026-06-12days on market $505,000 Active 242 DOM
-
2026-06-09days on market $505,000 Active 239 DOM
-
2026-06-08days on market $505,000 Active 238 DOM
-
2026-06-07days on market $505,000 Active 237 DOM
-
2026-06-04days on market $505,000 Active 233 DOM
-
2026-06-02days on market $505,000 Active 232 DOM
-
2026-06-01days on market $505,000 Active 231 DOM
-
2026-05-31days on market $505,000 Active 230 DOM
-
2026-05-31days on market $505,000 Active 229 DOM
-
2025-10-09$530,000 Active 241-char remark
Show marketing remark (241 chars)
Bright, spacious, and well-maintained duplex in Forest Park. Plenty of natural light, private decks for each unit, and lots of surrounding trees for privacy and peace! Upstairs is 3/2 and downstairs is 1/1. Secure this fantastic opportunity!
ⓘ Source: listings_history table (triggers on properties + properties_extension) + one-shot
backfill from property_details.listing_events for pre-trigger history.
Tax reassessment forecast AK · Partial reset (capped growth)
- Current annual tax
- $4,021 · $335/mo
- Projected year-2 tax
- $5,015 · $418/mo
- Expected delta
- +$994/yr (+$83/mo · 24.7%)
ⓘ Screening estimate from a state-policy table — verify with the county assessor before closing.
Climate risk First Street
- Flood 1/10 Low 0% chance over 30 yrs
- Air quality 1/10 Low
Nearby sold comps map
Loading sold comps map…
Walkable amenities ~0.75 mi
Loading nearby amenities…
Taxation est. · year 1
- Rental income
- $45,924
- − Mortgage interest
- −$28,288
- − Property taxes
- −$4,021
- − Insurance
- −$2,525
- − Repairs & maintenance
- −$3,674
- − Management
- −$3,674
- − Depreciation
- −$14,691
- Taxable loss
- −$10,949
- Est. tax savings @ 24.0%
- +$2,628
- After-tax cash flow
- $582/yr
For passive investors: Depreciation is non-cash, so a rental often shows a tax loss while cash-flowing — sheltering income. Rental losses are passive: they offset passive income freely, and up to $25,000/yr can offset ordinary (W-2) income if you actively participate and your MAGI is under $100k (phasing out to $0 by $150k); unused losses carry forward. On sale, claimed depreciation is recaptured at up to 25%, and gains may owe capital-gains tax (a 1031 exchange can defer both). Figures are a year-1 estimate at your 24.0% rate — not tax advice; consult a CPA.
Schools (NCES district)
No district data.
Livability — Saxman
- Score
- 54/100
- State rank
- #157
- US rank
- #23765
Category grades
Schools grade is shown separately in the Schools card above.
Census & demographics
- Population (ZIP)
- 13,875
Population outlook (Ketchikan Gateway County) Hauer SSP2
- Today (2025)
- 14,287 people
- By 2030
- 14,487 · +1.4%
- By 2040
- 14,750 · +3.2%
- By 2050
- 14,908 · +4.3%
- By 2075
- 15,319 · +7.2%
- By 2100
- 15,204 · +6.4%
Race, ethnicity, and origin ACS 2023
- Neighborhood character
- Diverse neighborhood (Simpson 0.61)
- Race & ethnicity
- White 61% Native American 13% Two or more races 13% Asian 9% Hispanic / Latino 5%
- Hispanic origin (detail)
- Mexican 3%
- Common ancestry
- Portuguese 5% Slovak 4% Italian 2%
- Foreign-born
- 9% · Canada
- Languages at home
- 89% English-only · Tagalog/Filipino 7% Spanish 2% Other Indo-European 1%
Political lean MEDSL · Ketchikan Gateway
- 2016 margin
- R (+15.2) · D 37.7% · R 52.9% · Other 9.4%
- All cycles
- 2016: R+15.2
Not yet ingested
- Civics
- —
Market trends
- HPI YoY
- ▼ -95.31%
- Current HPI
- 190.039
- Rent YoY
- —
- Metro
- —
- State GDP YoY
- —
- F500 in state
- 0
Price history
1 event — show timeline
- 2025-10-09 Listed $530,000 AKMLS
Property tax history
+15.1%/yrLatest (2025): $4,021 · +9.4% YoY. Source: county tax records.
Cash-flow waterfall
monthlySold comps — $/sqft
last 12 mo · ≤1 miLoading sold comps…