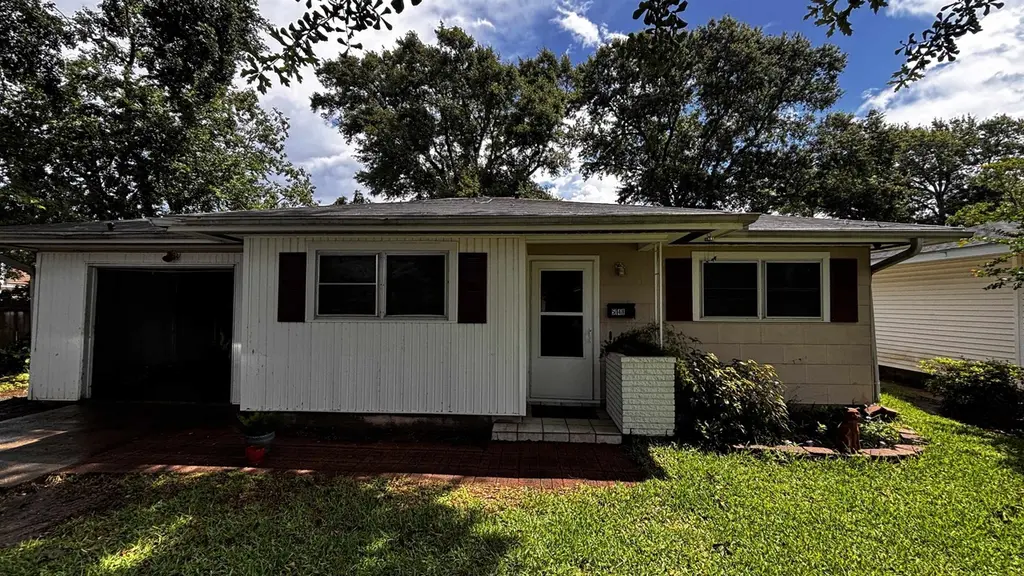
5148 Foster Ave · Groves, TX
Flood risk 8/10 · Major
- FEMA flood zone
- X (shaded)
- Chance of flooding over 30 yrs
- 0.77%
- Est. flood insurance / yr
- $507 – $1,088
Fire risk 1/10 · Minimal
- Est. fire insurance / yr
- $1,222 – $2,270
Heat risk 10/10 · Severe
- Hot days now (above 110°F)
- 7 days/yr
- Hot days in 30 yrs
- 25 days/yr
Wind risk 9/10 · Severe
- Chance of severe wind over 30 yrs
- 99.0%
Air-quality risk 2/10 · Minimal
- Unhealthy air days now
- 1 days/yr
- Unhealthy air days in 30 yrs
- 1 days/yr
Risk factors via First Street. Map © Google.
Why this score? — see what drove the B+ grade
The composite is a weighted blend of 9 inputs, each scored 0–100. Each bar is that input's sub-score; the figure is the points it added to the 100-point composite (weight × sub-score).
- Cash flow +30.0/30.0
- ARV discount +15.0/15.0
- 1% rule +10.0/10.0
- DSCR +10.0/10.0
- Schools +3.9/10.0
- Livability +3.6/5.0
- Rent growth +2.5/5.0
- Condition / age +2.5/5.0
- Appreciation +0.0/10.0
$129,900
🖨 Deal sheet (PDF) 📄 Offer letter ✓ Due diligence
Listing remarks MLS
Welcome to 5148 Foster Ave in Groves, TX! This property offers a great opportunity for buyers looking to add their personal touch or investors seeking their next project. Featuring a spacious layout and situated in an established neighborhood, this home has plenty of potential to be transformed into something special. The property offers generous living areas, sizable bedrooms, and a convenient location close to schools, shopping, dining, and major roadways. Whether you're looking for a primary residence, rental investment, or renovation project, this home presents endless possibilities. Property is being sold AS-IS. Seller will make no repairs. Schedule your showing today and explore the potential this property has to offer!
Key facts
- 7,710 sq ft lot
- Garage
- Built 1968
Property features AI
Exterior
- Parking: Attached garage (1 car)
- Utilities: Public water; Public sewer
- Home design: Residential property; Built in 1968; Slab foundation
- Construction: Asbestos and vinyl siding construction; Composition roof; Slab foundation; Built in 1968
- Exterior features: Composition roof; Asbestos and vinyl siding exterior; Lot is 0.177 acres (7,709 sq ft)
Interior
- Bedrooms: Primary bedroom on the first floor (11 x 12); Bedroom on the first floor (10 x 17); Bedroom on the first floor (10 x 11); Bedroom on the first floor (10 x 11)
- Bathrooms: 1 full bathroom; 1 half bathroom
- Heating & cooling: Central gas heating; Window unit(s) for cooling
- Interior features: 4 total rooms; Located on a cul-de-sac
Neighborhood map
What this means for you Summary
Snapshot
- This is a 4-bed/1.5-bath single-family listed at $130k.
Deal economics
- At list price, monthly cash flow is $459 ($6k/yr) — positive.
- The deal already cash-flows at list — no discount required.
- Meets the 1% rule at list price ($2k rent vs $130k).
- Cap rate 11.2% vs local median 4.0% in Groves — top-decile yield for the area; either an underpriced asset or a hidden risk that comps aren't pricing in. Stress-test before assuming the spread holds.
Location & tenants
- Location reads 71/100 on livability (#315 in TX) — a middle-class / working-renter tenant base. Strengths: cost of living A+, housing A+, health & safety A; Watch: employment C-, amenities F, commute F.
- Port Neches-Groves ISD (suburban): math 42% / reading 47% proficiency, ranked #260 of 826 in TX (top 32%) — families likely to look elsewhere, expect single-tenant / working-renter base with shorter leases.
- Zoned schools: Port Neches El (math 40% / reading 44%, grade F, #1,335 of 4,322 statewide, top 33%, 378 students, 40% FRL); Groves Middle (math 47% / reading 41%, grade D, #512 of 1,662 statewide, top 32%, 608 students, 55% FRL); Port Neches-Groves H S (math 36% / reading 57%, grade D-, #621 of 1,632 statewide, top 38%, 1,627 students, 43% FRL) — zoned schools average 46% FRL vs 27% district-wide (19 pts higher); higher-poverty schools than district average — tighter screening recommended.
- Market conditions: 92 active listings in the ZIP; 2 comparable units currently listed for rent nearby; 343 units permitted in Jefferson County in 2024 (0 in 5+ unit buildings).
- This rent runs 32% of the median local income ($74k/yr) — at the standard rent-burdened threshold; future hikes will face affordability resistance.
Forward outlook
- Local home prices are declining (-3.0%/yr); year-one equity from $898 of loan paydown is wiped out by about $4k of value loss. Plan a longer hold.
- At projected returns (-3.0% appreciation + 3.0% rent growth), your $36k cash investment doubles in ~8 years — after that, you're playing with house money.
Negotiation context
- Only 11 days on market — expect competitive offers; lowballing is unlikely to land.
- 2 sale attempts with the ask held roughly flat each time — persistent listings suggest the price (not the market) is what's stuck; bring a comps-based counter.
Risks & watch-outs
- Watch-outs: property tax is 2.7% of price; flood insurance adds $66/mo.
- Climate carrying-cost: severe flood risk; severe wind risk, 99% chance of damaging wind over 30y; extreme-heat days projected 7→25/yr by 2055 (HVAC capex compounding) — expect insurance premiums to compound above CPI over the hold.
Questions for the listing agent
- Built in 1968 — when were the roof, HVAC, electrical panel, plumbing, and water heater last replaced?
- Property tax is high relative to price — has the assessment been appealed recently, and will the sale trigger a re-assessment?
- What's the actual annual flood-insurance premium (NFIP or private), and is the property in a SFHA with mandatory coverage?
- Is there a deadline driving the sale (1031 exchange, divorce, estate, relocation)? That informs how much negotiation room exists.
- What's the average days-on-market for RENTAL listings here right now (not sales)? A rising rental-DOM trend means longer vacancies and softer asking-rent achievability than the comps imply.
- What's the recent tenant-quality profile in this submarket — average credit score on applications, eviction rate, late-payment / NSF rate, and stable-employment percentage? A property-management company in the area should have these aggregated.
- How much new for-sale + rental construction is in the pipeline within 1–3 miles? Heavy new supply typically softens prices + rents 12–24 months out; constrained supply supports both.
Investment metrics
- 1% rule
- 1.51% ✓
- Cap rate
- 11.15%
- Cash-on-cash
- 17.35%
- DSCR
- 1.77
- GRM
- 5.5
CMA / ARV
- ARV (on-the-fly)
- $229,775
- Comps found
- 2
Show comp detail 2 sales within ~0.75 mi
| Address | Dist | Beds/Ba | Sqft | Sold | Price | $/sf | Match |
|---|---|---|---|---|---|---|---|
| 4821 Foster Ave | 0.21mi | 3/1.5 (-1) | 1,482 (+13%) | 14mo | $161,499 | $109 | 52 |
| 5308 W Groves Cir | 0.65mi | 4/2.0 | 1,437 (+9%) | 7mo | $252,000 | $175 | 46 |
Match score weights: distance 35% · size 25% · config 20% · recency 20%. Top-matched comps best support the ARV.
Projected returns pro-forma
-3.0% appreciation · 3.0% rent growth · sell at horizon
- IRR
- 5.9%
- Equity multiple
- 1.23×
- Total profit
- $8,359
- Equity at exit
- $19,369
- IRR
- 15.4%
- Equity multiple
- 2.25×
- Total profit
- $45,557
- Equity at exit
- $11,231
Cash invested: $36,372 (down + closing). Projections, not guarantees.
Landlord ↔ Tenant lean methodology
- Overall (STATE)
- 87 Strongly Landlord-Friendly
- State Texas
- 87 Strongly Landlord-Friendly · R+5
- County
- — inherits STATE
- City
- — inherits STATE
ZIP-level market 77619
- Active inventory
- 92
- Price-to-rent
- 5.5×
Monthly cashflow live
- Estimated rent
- $1,961 medium interval (Pro) →
- Mortgage (P&I)
- −$681
- Tax from tax record
- −$288 /mo · $3,457/yr
- Insurance
- −$54
- Flood insurance flood zone
- −$66 /mo · $798/yr
- HOA
- −$0
- Vacancy / Maint / Mgmt
- −$412
- Net cashflow
- $459
Break-even live
Sensitivity live
| Price | -10% $533 | -5% $496 | +0% $459 | +5% $423 | +10% $386 |
|---|---|---|---|---|---|
| Rent | -10% $304 | -5% $382 | +0% $459 | +5% $537 | +10% $614 |
| Rate | -1.0pp $525 | -0.5pp $492 | base $459 | +0.5pp $426 | +1.0pp $392 |
UW: 25.0% down · 7.5% · 30yr · 1.5% tax · 5.0% vac · 8.0% maint · 8.0% mgmt
Financing live
Cash to close
- Down payment
- $32,475
- Closing costs
- $3,897
- Reserves months
- —
- Total cash needed
- —
Loan-product check · same deal, 3 products live
Conventional
25% down · 7.5% · 30yr
- Down + closing
- —
- Monthly P&I
- —
- Monthly cashflow
- —
- DSCR
- —
- Eligible?
- —
Personal DTI + credit; lowest rate.
DSCR
20% down · 8.5% · 30yr
- Down + closing
- —
- Monthly P&I
- —
- Monthly cashflow
- —
- DSCR
- —
- Eligible?
- —
No personal income docs; deal must DSCR.
Hard money
10% down · 12.0% · 12mo
- Down + closing
- —
- Monthly P&I
- —
- Monthly cashflow
- —
- DSCR
- —
- Eligible?
- —
Short-term bridge; refi at stabilization.
Rent comps 2 comps
| Address | Beds | Baths | Sqft | Rent | $/sqft | DOM | Units | Dist |
|---|---|---|---|---|---|---|---|---|
| 5048 Kent Ave Groves, TX | 3.0 | 1.5 | 1351 | $1,650 | $1.22 | 16d | 1 | 0.10mi |
| 5431 Marion Ave Groves, TX | 3.0 | 1.0 | 1100 | $1,500 | $1.36 | 46d | 1 | 1.25mi |
Listing history 8 events
-
2026-06-14statusdays on market $129,900 Pending 11 DOM
-
2026-06-10days on market $129,900 Active 9 DOM
-
2026-06-09days on market $129,900 Active 8 DOM
-
2026-06-08days on market $129,900 Active 7 DOM
-
2026-06-07days on market $129,900 Active 6 DOM
-
2026-06-03days on market $129,900 Active 2 DOM
-
2026-06-02remarks 699-char remark
-
2026-06-02$129,900 Active 1 DOM
ⓘ Source: listings_history table (triggers on properties + properties_extension) + one-shot
backfill from property_details.listing_events for pre-trigger history.
Tax reassessment forecast TX · Resets to sale price
- Current annual tax
- $3,457 · $288/mo
- Projected year-2 tax
- $3,457 · $288/mo
- Expected delta
- $0/yr ($0/mo · 0.0%)
ⓘ Screening estimate from a state-policy table — verify with the county assessor before closing.
Climate risk First Street
- Flood 8/10 Severe FEMA zone X (shaded) · 77% chance over 30 yrs
- Wildfire 1/10 Low
- Heat 10/10 Extreme 7 d/yr ≥110°F today · 25 d/yr by 30 yrs out
- Wind 9/10 Extreme 99% chance of damaging wind over 30 yrs
- Air quality 2/10 Low 1 unhealthy d/yr today · 1 by 30 yrs out
Nearby sold comps map
Loading sold comps map…
Walkable amenities ~0.75 mi
Loading nearby amenities…
Taxation est. · year 1
- Rental income
- $23,533
- − Mortgage interest
- −$7,276
- − Property taxes
- −$3,457
- − Insurance
- −$1,447
- − Repairs & maintenance
- −$1,883
- − Management
- −$1,883
- − Depreciation
- −$3,779
- Taxable income
- $3,809
- Est. tax owed @ 24.0%
- −$914
- After-tax cash flow
- $4,599/yr
For passive investors: Depreciation is non-cash, so a rental often shows a tax loss while cash-flowing — sheltering income. Rental losses are passive: they offset passive income freely, and up to $25,000/yr can offset ordinary (W-2) income if you actively participate and your MAGI is under $100k (phasing out to $0 by $150k); unused losses carry forward. On sale, claimed depreciation is recaptured at up to 25%, and gains may owe capital-gains tax (a 1031 exchange can defer both). Figures are a year-1 estimate at your 24.0% rate — not tax advice; consult a CPA.
Schools (NCES district)
- District
- Port Neches-Groves ISD
- NCES district ID
- 4835430
- Math proficiency
- 42% ▼ -13.00%
- Reading proficiency
- 47% ▼ -5.00%
- Median HH income
- $54,661
- Composite
- 38.65/100
- National rank
- #4152
- State rank
- #260 of 826 in TX
Livability — Groves
- Score
- 71/100
- State rank
- #315
- US rank
- #7031
Category grades
Schools grade is shown separately in the Schools card above.
Census & demographics
- Census place
- Groves, TX
- County
- Jefferson County · 203,592 people
- City population
- 16,976
- Metro
- Beaumont-Port Arthur, TX
- Population (ZIP)
- 16,976
- Household income
- $73,710
- Rent vs Own
- Severe rent burden
- 131.0
Population outlook (Jefferson County) Hauer SSP2
- Today (2025)
- 259,015 people
- By 2030
- 260,685 · +0.6%
- By 2040
- 263,309 · +1.7%
- By 2050
- 265,237 · +2.4%
- By 2075
- 270,193 · +4.3%
- By 2100
- 255,628 · -1.3%
Race, ethnicity, and origin ACS 2023
- Neighborhood character
- Diverse neighborhood (Simpson 0.62)
- Race & ethnicity
- White 53% Hispanic / Latino 30% Two or more races 18% Black 9% Asian 6%
- Hispanic origin (detail)
- Mexican 24% Dominican 2%
- Common ancestry
- Lithuanian 10% Serbian 1% Slovak 1%
- Foreign-born
- 16% · Canada, Vietnam, Jamaica
- Languages at home
- 72% English-only · Spanish 20% Vietnamese 5% Other Asian/Pacific 2%
Political lean MEDSL · Jefferson
- 2024 margin
- Lean R (+8.9) · D 45.1% · R 54.0%
- 2008→2024 swing
- -11.1pp toward R · 2008: 2.2pp · 2024: -8.9pp
- All cycles
- 2024: R+8.9 2020: R+1.6 2016: R+0.5 2012: D+1.6 2008: D+2.2
Not yet ingested
- Civics
- —
Market trends
- HPI YoY
- ▼ -235.42%
- Current HPI
- 183.1358
- Rent YoY
- —
- Metro
- Beaumont-Port Arthur, TX
- State GDP YoY
- ▲ 3.95%
- F500 in state
- 110
Industry mix (Fortune 500 HQ in TX)
| Industry | F500 HQs | Revenue |
|---|---|---|
| Energy | 16 | $1,198B |
|
||
| Technology | 5 | $198B |
|
||
| Engineering / Construction | 4 | $72B |
|
||
| Energy Services | 3 | $60B |
|
||
| Utilities | 3 | $41B |
|
||
| Healthcare | 2 | $330B |
|
||
Price history
+0.0% since first listed2 events — show timeline
- 2026-06-01 Listed $129,900 BBOR
- 2026-06-01 Listed $129,900 HARMLS
Property tax history
+3.3%/yrLatest (2025): $3,457 · -13.0% YoY. Source: county tax records.
Cash-flow waterfall
monthlySold comps — $/sqft
last 12 mo · ≤1 miLoading sold comps…