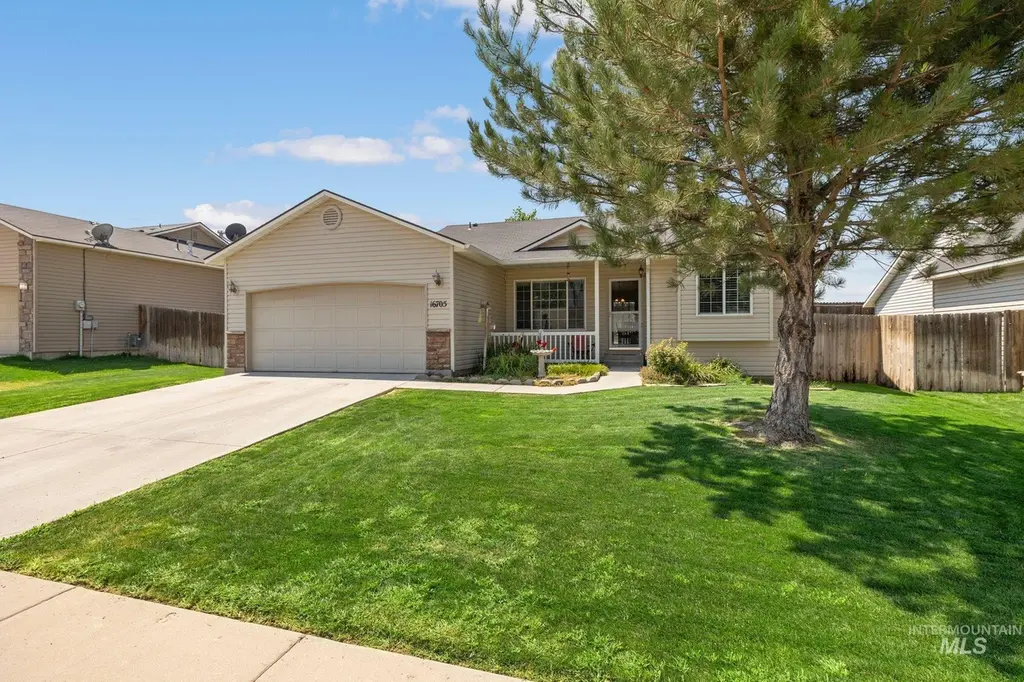
16705 Naito Ave · Caldwell, ID
Flood risk 1/10 · Minimal
- FEMA flood zone
- X (unshaded)
- Chance of flooding over 30 yrs
- 0.0%
- Est. flood insurance / yr
- $507 – $1,088
Fire risk 1/10 · Minimal
- Est. fire insurance / yr
- $584 – $1,086
Heat risk 4/10 · Minor
- Hot days now (above 98°F)
- 7 days/yr
- Hot days in 30 yrs
- 18 days/yr
Wind risk 1/10 · Minimal
- Chance of severe wind over 30 yrs
- —
Air-quality risk 7/10 · Major
- Unhealthy air days now
- 9 days/yr
- Unhealthy air days in 30 yrs
- 16 days/yr
Risk factors via First Street. Map © Google.
Why this score? — see what drove the D grade
The composite is a weighted blend of 9 inputs, each scored 0–100. Each bar is that input's sub-score; the figure is the points it added to the 100-point composite (weight × sub-score).
- Cash flow +12.7/30.0
- ARV discount +7.5/15.0
- DSCR +3.8/10.0
- Schools +3.8/10.0
- 1% rule +3.6/10.0
- Rent growth +3.6/5.0
- Livability +3.4/5.0
- Condition / age +2.5/5.0
- Appreciation +0.0/10.0
$369,900
🖨 Deal sheet (PDF) 📄 Offer letter ✓ Due diligence
Listing remarks
Won't last long! Perfect location! Move-in condition! Rare single level 4 bedroom home with a possible 5th bedroom ( no closet). Newer furnace, A/C, water heater, and newer carpet. New roof. Excellent location close to schools and churches. Spacious garden area in the backyard. Spacious great room with vaulted ceilings. Nice front porch.
Key facts
- Single level
- Newer furnace
- Garden area
Tags
Property features AI
Finance
- Other: Zoning: R1; Current use: Single family; Road frontage: Public paved road; Subdivision: Whispering Pines (Caldwell)
- HOA & community: HOA with an annual fee of $110
Exterior
- Parking: Attached 2-car garage; Finished driveway; 2 covered parking spaces
- Utilities: City water service; Cable connected; Broadband internet
- Home design: Single family residence; Built in 2004; Frame construction with metal and vinyl siding
- Construction: Frame construction; Metal siding; Vinyl siding
- Exterior features: Full wood fencing; Garden; Sidewalks; Automatic sprinkler system (pressurized irrigation)
Interior
- Kitchen: Dishwasher; Disposal; Freestanding oven/range; Breakfast bar; Pantry
- Bedrooms: 4 bedrooms (all on the main level)
- Flooring: Carpet; Vinyl sheet
- Bathrooms: 2 bathrooms
- Heating & cooling: Forced air heating (natural gas); Central air conditioning
- Interior features: Bath in master bedroom; Split bedroom layout; Den/office; Great room; Rec/bonus room; Double vanity; Walk-in closet(s); Breakfast bar; Pantry
- Laundry & utility: Gas water heater
Neighborhood map
What this means for you Summary
Snapshot
- This is a 4-bed/2.0-bath other listed at $370k.
Deal economics
- At list price, monthly cash flow is $-44 ($-526/yr) — negative.
- To cash-flow at today's rent, offer at most $364k (1.7% below list).
- To meet the 1% rule (rent ≥ 1% of price), the offer needs to be $319k (13.7% below list).
- Recommended offer: $319k (13.7% below list) — sets the bar for 1% rule.
- Cap rate 6.2% vs local median 3.0% in Caldwell — top-decile yield for the area; either an underpriced asset or a hidden risk that comps aren't pricing in. Stress-test before assuming the spread holds.
Location & tenants
- Location reads 67/100 on livability (#88 in ID) — a middle-class / working-renter tenant base. Strengths: cost of living A+, housing A+; Watch: crime C-, employment D+, amenities F.
- Vallivue School District (rural): math 34% / reading 56% proficiency, ranked #48 of 92 in ID (top 52%) — families likely to look elsewhere, expect single-tenant / working-renter base with shorter leases.
- Zoned schools: Central Canyon Elementary School (math 36% / reading 55%, grade D-, #194 of 357 statewide, top 55%, 636 students, 50% FRL); Vallivue Middle School (math 32% / reading 60%, grade D+, #47 of 109 statewide, top 44%, 677 students, 41% FRL); Vallivue Academy (math 24% / reading 75%, grade D+, #40 of 169 statewide, top 26%, 122 students, 77% FRL) — zoned schools at 56% FRL track the district average.
- Market conditions: Rents rising fast (+4.5%/yr); 581 active listings in the ZIP; 10 comparable units currently listed for rent nearby; rentals leasing fast (median 13d on market — plan ~1-2 weeks tenant-placement turnaround); solid renter incomes; 3,620 units permitted in Canyon County in 2024 (196 in 5+ unit buildings).
- This rent runs 45% of the median local income ($85k/yr) — at the standard rent-burdened threshold; future hikes will face affordability resistance.
Forward outlook
- Local home prices are declining (-3.0%/yr); year-one equity from $3k of loan paydown is wiped out by about $11k of value loss. Plan a longer hold.
- Canyon County population projected at +41% by 2050 — long-run rental-demand tailwind backs the buy-and-hold thesis.
Negotiation context
- It's been on market 37 days — a 3% lower offer ($359k) is reasonable based on typical stale-listing flexibility.
- 4 sale attempts since 23y ago with the ask held roughly flat each time — persistent listings suggest the price (not the market) is what's stuck; bring a comps-based counter.
Questions for the listing agent
- What do current leases actually rent for vs. the listed asking? Can we see a recent rent roll and the last 12 months of T-12 income?
- It's been on market 37 days. Have you received any prior offers? Is the seller open to a 14% concession, seller financing, or rate buy-down credit?
- What does the HOA fee cover, when was the last increase, and are there any pending special assessments or reserve-fund shortfalls?
- Is there a deadline driving the sale (1031 exchange, divorce, estate, relocation)? That informs how much negotiation room exists.
- Schools are D-rated, which usually means shorter tenancies and higher turnover. Who's the typical renter profile here, and what's been the actual vacancy rate?
- The area grade is low — what's the realistic commute time and amenity access for the typical tenant pool here? Any planned neighborhood developments (good or bad) we should know about?
- What's the average days-on-market for RENTAL listings here right now (not sales)? A rising rental-DOM trend means longer vacancies and softer asking-rent achievability than the comps imply.
- What's the recent tenant-quality profile in this submarket — average credit score on applications, eviction rate, late-payment / NSF rate, and stable-employment percentage? A property-management company in the area should have these aggregated.
- How much new for-sale + rental construction is in the pipeline within 1–3 miles? Heavy new supply typically softens prices + rents 12–24 months out; constrained supply supports both.
Investment metrics
- 1% rule
- 0.86% ✗
- Cap rate
- 6.15%
- Cash-on-cash
- -0.51%
- DSCR
- 0.98
- GRM
- 9.7
CMA / ARV
No comps found within radius.
Projected returns pro-forma
-3.0% appreciation · 4.45% rent growth · sell at horizon
- IRR
- -15.5%
- Equity multiple
- 0.44×
- Total profit
- $-57,952
- Equity at exit
- $55,153
- IRR
- -4.7%
- Equity multiple
- 0.67×
- Total profit
- $-33,872
- Equity at exit
- $31,982
Cash invested: $103,572 (down + closing). Projections, not guarantees.
Landlord ↔ Tenant lean methodology
- Overall (STATE)
- 91 Strongly Landlord-Friendly
- State Idaho
- 91 Strongly Landlord-Friendly · R+18
- County
- — inherits STATE
- City
- — inherits STATE
ZIP-level market 83607
- Home prices YoY
- -32.8%
- Rents YoY
- 4.5%
- Active inventory
- 581
- Price-to-rent
- 9.7×
Monthly cashflow live
- Estimated rent
- $3,192 high interval (Pro) →
- Mortgage (P&I)
- −$1,940
- Tax est. 1.5%
- −$462 /mo · $5,548/yr
- Insurance
- −$154
- HOA
- −$9
- Vacancy / Maint / Mgmt
- −$670
- Net cashflow
- $-44
Break-even live
Sensitivity live
| Price | -10% $212 | -5% $84 | +0% $-44 | +5% $-172 | +10% $-299 |
|---|---|---|---|---|---|
| Rent | -10% $-296 | -5% $-170 | +0% $-44 | +5% $82 | +10% $208 |
| Rate | -1.0pp $142 | -0.5pp $50 | base $-44 | +0.5pp $-140 | +1.0pp $-237 |
UW: 25.0% down · 7.5% · 30yr · 1.5% tax · 5.0% vac · 8.0% maint · 8.0% mgmt
Financing live
Cash to close
- Down payment
- $92,475
- Closing costs
- $11,097
- Reserves months
- —
- Total cash needed
- —
Loan-product check · same deal, 3 products live
Conventional
25% down · 7.5% · 30yr
- Down + closing
- —
- Monthly P&I
- —
- Monthly cashflow
- —
- DSCR
- —
- Eligible?
- —
Personal DTI + credit; lowest rate.
DSCR
20% down · 8.5% · 30yr
- Down + closing
- —
- Monthly P&I
- —
- Monthly cashflow
- —
- DSCR
- —
- Eligible?
- —
No personal income docs; deal must DSCR.
Hard money
10% down · 12.0% · 12mo
- Down + closing
- —
- Monthly P&I
- —
- Monthly cashflow
- —
- DSCR
- —
- Eligible?
- —
Short-term bridge; refi at stabilization.
Rent comps 10 comps
| Address | Beds | Baths | Sqft | Rent | $/sqft | DOM | Units | Dist |
|---|---|---|---|---|---|---|---|---|
| 14549 Tesswater St Unit 1460939P Caldwell, ID | 3.0 | 2.0 | 1399 | $4,160 | $2.97 | 13d | 1 | 0.06mi |
| 2012 Cambridge St Caldwell, ID | 3.0 | 2.0 | 996 | $2,050 | $2.06 | 5d | 1 | 0.65mi |
| 4808 Columbia Falls Ave Caldwell, ID | 3.0 | 2.0 | 1574 | $2,095 | $1.33 | 23d | 1 | 0.82mi |
| 4800 Great Falls Ave Caldwell, ID | 3.0 | 2.0 | 1572 | $2,045 | $1.30 | 13d | 1 | 0.86mi |
| 4719 Settlers Ave Caldwell, ID | 3.0 | 2.0 | 1200 | $1,895 | $1.58 | 12d | 1 | 0.91mi |
| 13521 Palm Beach Dr Caldwell, ID | 3.0 | 2.5 | 1491 | $1,825 | $1.22 | 5d | 1 | 1.08mi |
| 13449 Cedar Hollow Ln Caldwell, ID | 2.0–3.0 | 2.5 | 1238 | $2,075 | $1.68 | 4d | 9 | 1.38mi |
| 3919 Thatcher Ln Caldwell, ID | 1.0–3.0 | 1.0–2.0 | 1074 | $1,895 | $1.76 | 4d | 41 | 1.41mi |
| 15290 Nimbus Way Caldwell, ID | 4.0 | 2.5 | 1874 | $2,350 | $1.25 | 4d | 1 | 1.45mi |
| 15307 Cloud Crest Ave Caldwell, ID | 4.0 | 2.0 | 1819 | $2,400 | $1.32 | 13d | 1 | 1.47mi |
HOA detail
- Monthly dues
- $9 · $108/yr
- Likely covers
- water
Listing history 8 events
-
2026-05-08status Pending
-
2026-04-01$369,900 Active
-
2021-08-10historical
-
2021-08-04price $379,990
-
2021-07-31$379,900 Active
-
2019-06-24soldstatus
-
2019-05-23$210,000
-
2003-10-20$99,390
ⓘ Source: listings_history table (triggers on properties + properties_extension) + one-shot
backfill from property_details.listing_events for pre-trigger history.
Climate risk First Street
- Flood 1/10 Low FEMA zone X (unshaded) · 0% chance over 30 yrs
- Wildfire 1/10 Low
- Heat 4/10 Moderate 7 d/yr ≥98°F today · 18 d/yr by 30 yrs out
- Wind 1/10 Low
- Air quality 7/10 Severe 9 unhealthy d/yr today · 16 by 30 yrs out
Nearby sold comps map
Loading sold comps map…
Walkable amenities ~0.75 mi
Loading nearby amenities…
Taxation est. · year 1
- Rental income
- $38,301
- − Mortgage interest
- −$20,720
- − Property taxes
- −$5,548
- − Insurance
- −$1,850
- − Repairs & maintenance
- −$3,064
- − Management
- −$3,064
- − HOA
- −$108
- − Depreciation
- −$10,761
- Taxable loss
- −$6,814
- Est. tax savings @ 24.0%
- +$1,635
- After-tax cash flow
- $1,110/yr
For passive investors: Depreciation is non-cash, so a rental often shows a tax loss while cash-flowing — sheltering income. Rental losses are passive: they offset passive income freely, and up to $25,000/yr can offset ordinary (W-2) income if you actively participate and your MAGI is under $100k (phasing out to $0 by $150k); unused losses carry forward. On sale, claimed depreciation is recaptured at up to 25%, and gains may owe capital-gains tax (a 1031 exchange can defer both). Figures are a year-1 estimate at your 24.0% rate — not tax advice; consult a CPA.
Schools (NCES district)
- District
- Vallivue School District
- NCES district ID
- 1600600
- Math proficiency
- 34% ▼ -9.00%
- Reading proficiency
- 56% ▼ -1.00%
- Median HH income
- $47,377
- Composite
- 38.3/100
- National rank
- #4229
- State rank
- #48 of 92 in ID
Livability — Caldwell
- Score
- 67/100
- State rank
- #88
- US rank
- #10145
Category grades
Schools grade is shown separately in the Schools card above.
Census & demographics
- Census place
- Caldwell, ID
- County
- Canyon County · 235,358 people
- City population
- 76,816
- Metro
- Boise City, ID
- Population (ZIP)
- 35,491
- Household income
- $85,399
- Rent vs Own
- Severe rent burden
- 446.0
Population outlook (Canyon County) Hauer SSP2
- Today (2025)
- 248,853 people
- By 2030
- 269,596 · +8.3%
- By 2040
- 311,081 · +25.0%
- By 2050
- 350,809 · +41.0%
- By 2075
- 441,884 · +77.6%
- By 2100
- 505,641 · +103.2%
Race, ethnicity, and origin ACS 2023
- Neighborhood character
- Predominantly White (69%)
- Race & ethnicity
- White 69% Hispanic / Latino 25% Two or more races 13% Asian 2%
- Hispanic origin (detail)
- Mexican 21%
- Common ancestry
- Slovak 3% Italian 3% Lithuanian 3%
- Foreign-born
- 8% · Canada
- Languages at home
- 82% English-only · Spanish 16% Other Asian/Pacific 1%
Political lean MEDSL · Canyon
- 2024 margin
- Solid R (+46.6) · D 25.4% · R 72.0% · Other 2.5%
- 2008→2024 swing
- -11.4pp toward R · 2008: -35.2pp · 2024: -46.6pp
- All cycles
- 2024: R+46.6 2020: R+39.7 2016: R+41.8 2012: R+37.1 2008: R+35.2
Not yet ingested
- Civics
- —
Market trends
- HPI YoY
- ▼ -151.23%
- Current HPI
- 310.4118
- Rent YoY
- ▲ 4.45%
- Metro
- Boise City, ID
- State GDP YoY
- ▲ 4.51%
- F500 in state
- 6
Industry mix (Fortune 500 HQ in ID)
| Industry | F500 HQs | Revenue |
|---|---|---|
| Retail | 1 | $79B |
|
||
| Technology | 1 | $25B |
|
||
| Food / Agriculture | 1 | $6B |
|
||
Price history
+272.2% since first listed8 events — show timeline
- 2026-05-08 Pending — IMLS
- 2026-04-01 Listed $369,900 IMLS
- 2021-08-10 Listing Removed — IMLS
- 2021-08-04 Price Changed $379,990 IMLS
- 2021-07-31 Listed $379,900 IMLS
- 2019-06-24 Sold (Public Records) — Public Records
- 2019-05-23 Listed $210,000 IMLS
- 2003-10-20 Listed $99,390 IMLS
Property tax history
-6.9%/yrLatest (2025): $542 · +4.9% YoY. Source: county tax records.
Cash-flow waterfall
monthlySold comps — $/sqft
last 12 mo · ≤1 miLoading sold comps…