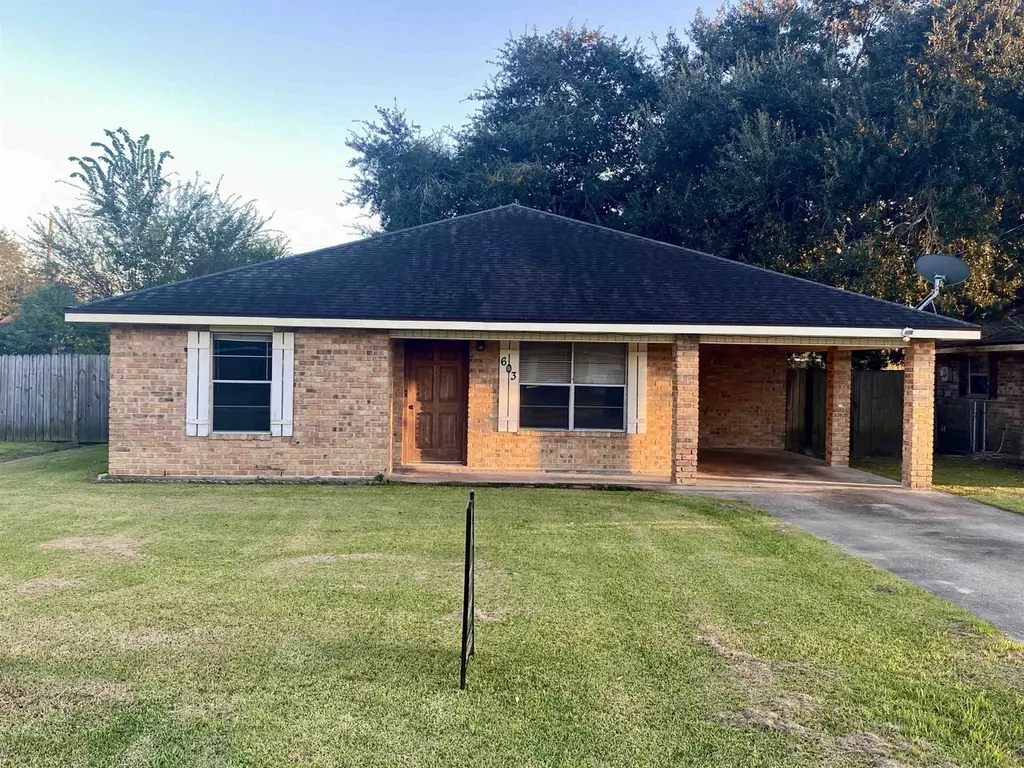
603 David St · Patterson, LA
Flood risk 8/10 · Major
- FEMA flood zone
- X (shaded)
- Chance of flooding over 30 yrs
- 0.6%
- Est. flood insurance / yr
- $507 – $1,088
Fire risk 1/10 · Minimal
- Est. fire insurance / yr
- $1,269 – $2,357
Heat risk 9/10 · Severe
- Hot days now (above 105°F)
- 7 days/yr
- Hot days in 30 yrs
- 24 days/yr
Wind risk 9/10 · Severe
- Chance of severe wind over 30 yrs
- 99.0%
Air-quality risk 1/10 · Minimal
- Unhealthy air days now
- 0 days/yr
- Unhealthy air days in 30 yrs
- 0 days/yr
Risk factors via First Street. Map © Google.
Why this score? — see what drove the C+ grade
The composite is a weighted blend of 9 inputs, each scored 0–100. Each bar is that input's sub-score; the figure is the points it added to the 100-point composite (weight × sub-score).
- Cash flow +22.9/30.0
- ARV discount +14.4/15.0
- DSCR +7.3/10.0
- 1% rule +5.4/10.0
- Livability +3.4/5.0
- Schools +2.8/10.0
- Rent growth +2.5/5.0
- Condition / age +2.5/5.0
- Appreciation +0.0/10.0
$135,000
🖨 Deal sheet (PDF) 📄 Offer letter ✓ Due diligence
Listing remarks MLS
Step into comfort and character with this well-maintained 3-bedroom, 2-bath brick home built in 1997. Featuring brand-new wood floors in the living room and bedrooms, this home blends timeless style with modern updates. The spacious indoor laundry room adds everyday convenience, while the large fenced-in backyard offers privacy and room to roam. Enjoy outdoor living under the covered patio, shaded by a majestic live oak tree--perfect for weekend gatherings or quiet mornings with coffee. Whether you're hosting friends or relaxing solo, this backyard is a true sanctuary.
Key facts
- Wood floors
- Covered patio
- Live oak tree
Tags
Property features AI
Finance
- Other: Located in the Pietro Estates subdivision
Exterior
- Parking: Garage
- Utilities: Public water; Public sewer
- Home design: Detached single-family residence; Residential property
- Construction: Brick construction; Slab foundation; Built space approximately 1,794
- Exterior features: Fenced yard (full, wood); Shingle roof
Interior
- Bathrooms: 2 full bathrooms
- Heating & cooling: Central heating; Central air conditioning
- Interior features: Walk-in closet(s)
Neighborhood map
What this means for you Summary
Snapshot
- This is a 3-bed/2.0-bath single-family listed at $135k.
Deal economics
- At list price, monthly cash flow is $170 ($2k/yr) — positive.
- The deal already cash-flows at list — no discount required.
- Meets the 1% rule at list price ($1k rent vs $135k).
- Recommended offer: $133k (1.5% below list) — sets the bar for market timing.
Location & tenants
- Location reads 68/100 on livability (#101 in LA) — a middle-class / working-renter tenant base. Strengths: cost of living A+, housing A, crime B+; Watch: amenities F, commute F, employment D-.
- St. Mary Parish (town): math 28% / reading 39% proficiency, ranked #37 of 98 in LA (top 38%) — families likely to look elsewhere, expect single-tenant / working-renter base with shorter leases; 68% free/reduced lunch — lower-income household profile, screen leases tightly.
- Zoned schools: Hattie A. Watts Elementary School (math 47% / reading 55%, grade C-, #120 of 646 statewide, top 19%, 609 students, 76% FRL); Patterson Junior High School (math 17% / reading 34%, grade F, #139 of 218 statewide, top 64%, 412 students, 70% FRL); Patterson High School (math 32% / reading 42%, grade F, #98 of 265 statewide, top 38%, 452 students, 72% FRL) — zoned schools at 73% FRL track the district average.
- Market conditions: 30 active listings in the ZIP; 1 comparable units currently listed for rent nearby; 37 units permitted in St. Mary Parish in 2024 (20 in 5+ unit buildings).
Forward outlook
- Local home prices are declining (-3.0%/yr); year-one equity from $933 of loan paydown is wiped out by about $4k of value loss. Plan a longer hold.
- St. Mary County population projected at -18% by 2050 — secular population decline; favor cash flow + early exit over multi-decade hold.
Negotiation context
- It's been on market 18 days — a 2% lower offer ($133k) is reasonable based on typical stale-listing flexibility.
- 6 sale attempts with the ask held roughly flat each time — persistent listings suggest the price (not the market) is what's stuck; bring a comps-based counter.
- Current owner paid $60k; list at $135k implies a 125% gain — meaningful room to come down on a strong offer.
Risks & watch-outs
- Watch-outs: flood insurance adds $66/mo.
- Climate carrying-cost: severe flood risk; severe wind risk, 99% chance of damaging wind over 30y; extreme-heat days projected 7→24/yr by 2055 (HVAC capex compounding) — expect insurance premiums to compound above CPI over the hold.
Questions for the listing agent
- What's the actual annual flood-insurance premium (NFIP or private), and is the property in a SFHA with mandatory coverage?
- Is there a deadline driving the sale (1031 exchange, divorce, estate, relocation)? That informs how much negotiation room exists.
- Schools are B-rated — typically a magnet for longer-tenancy family renters. What's the average tenant stay here, and is there a school-zone premium baked into asking?
- What's the average days-on-market for RENTAL listings here right now (not sales)? A rising rental-DOM trend means longer vacancies and softer asking-rent achievability than the comps imply.
- What's the recent tenant-quality profile in this submarket — average credit score on applications, eviction rate, late-payment / NSF rate, and stable-employment percentage? A property-management company in the area should have these aggregated.
- How much new for-sale + rental construction is in the pipeline within 1–3 miles? Heavy new supply typically softens prices + rents 12–24 months out; constrained supply supports both.
Investment metrics
- 1% rule
- 1.04% ✓
- Cap rate
- 8.39%
- Cash-on-cash
- 7.50%
- DSCR
- 1.33
- GRM
- 8.0
CMA / ARV
- ARV (median comp)
- $159,579
- List price
- $135,000
- Delta
- -12.58%
- Verdict
- UNDERPRICED
- Comps
- 20 within 1.0 mi
Show comp detail 11 sales within ~0.75 mi
| Address | Dist | Beds/Ba | Sqft | Sold | Price | $/sf | Match |
|---|---|---|---|---|---|---|---|
| 602 Kem St | 0.02mi | 3/2.0 | 1,370 (+2%) | 18mo | $155,000 | $113 | 81 |
| 606 David St | 0.04mi | 3/2.0 | 1,433 (+6%) | 12mo | $206,000 | $144 | 78 |
| 617 Kem St | 0.09mi | 3/1.0 | 1,248 (-8%) | 8mo | $150,000 | $120 | 72 |
| 432 Tiffany Rd | 0.49mi | 3/2.0 | 1,296 (-4%) | 5mo | $135,000 | $104 | 66 |
| 119 Domino St | 0.57mi | 3/2.0 | 1,308 (-3%) | 10mo | $90,000 | $69 | 60 |
| 722 Kelli St | 0.25mi | 3/2.0 | 1,546 (+15%) | 7mo | $205,000 | $133 | 58 |
| 506 Mike Dr | 0.39mi | 3/1.5 | 1,236 (-8%) | 13mo | $160,000 | $129 | 55 |
| 303 Camille Dr | 0.59mi | 3/2.0 | 1,391 (+3%) | 15mo | $187,000 | $134 | 55 |
| 1001 Michael St | 0.59mi | 3/2.0 | 1,212 (-10%) | 1mo | $160,000 | $132 | 55 |
| 606 Leo Dr | 0.48mi | 3/2.0 | 1,526 (+13%) | 4mo | $172,000 | $113 | 52 |
| 613 Park St | 0.65mi | 3/2.0 | 1,149 (-15%) | 6mo | $58,000 | $50 | 40 |
Match score weights: distance 35% · size 25% · config 20% · recency 20%. Top-matched comps best support the ARV.
Projected returns pro-forma
-3.0% appreciation · 3.0% rent growth · sell at horizon
- IRR
- -7.9%
- Equity multiple
- 0.71×
- Total profit
- $-11,039
- Equity at exit
- $20,129
- IRR
- 1.6%
- Equity multiple
- 1.12×
- Total profit
- $4,405
- Equity at exit
- $11,672
Cash invested: $37,800 (down + closing). Projections, not guarantees.
Landlord ↔ Tenant lean methodology
- Overall (STATE)
- 90 Strongly Landlord-Friendly
- State Louisiana
- 90 Strongly Landlord-Friendly · R+12
- County
- — inherits STATE
- City
- — inherits STATE
ZIP-level market 70392
- Home prices YoY
- -30.3%
- Active inventory
- 30
- Price-to-rent
- 8.0×
Monthly cashflow live
- Estimated rent
- $1,400 medium interval (Pro) →
- Mortgage (P&I)
- −$708
- Tax from tax record
- −$106 /mo · $1,267/yr
- Insurance
- −$56
- Flood insurance flood zone
- −$66 /mo · $798/yr
- HOA
- −$0
- Vacancy / Maint / Mgmt
- −$294
- Net cashflow
- $170
Break-even live
Sensitivity live
| Price | -10% $246 | -5% $208 | +0% $170 | +5% $132 | +10% $93 |
|---|---|---|---|---|---|
| Rent | -10% $59 | -5% $114 | +0% $170 | +5% $225 | +10% $280 |
| Rate | -1.0pp $238 | -0.5pp $204 | base $170 | +0.5pp $135 | +1.0pp $99 |
UW: 25.0% down · 7.5% · 30yr · 1.5% tax · 5.0% vac · 8.0% maint · 8.0% mgmt
Financing live
Cash to close
- Down payment
- $33,750
- Closing costs
- $4,050
- Reserves months
- —
- Total cash needed
- —
Loan-product check · same deal, 3 products live
Conventional
25% down · 7.5% · 30yr
- Down + closing
- —
- Monthly P&I
- —
- Monthly cashflow
- —
- DSCR
- —
- Eligible?
- —
Personal DTI + credit; lowest rate.
DSCR
20% down · 8.5% · 30yr
- Down + closing
- —
- Monthly P&I
- —
- Monthly cashflow
- —
- DSCR
- —
- Eligible?
- —
No personal income docs; deal must DSCR.
Hard money
10% down · 12.0% · 12mo
- Down + closing
- —
- Monthly P&I
- —
- Monthly cashflow
- —
- DSCR
- —
- Eligible?
- —
Short-term bridge; refi at stabilization.
Rent comps 1 comps
| Address | Beds | Baths | Sqft | Rent | $/sqft | DOM | Units | Dist |
|---|---|---|---|---|---|---|---|---|
| 731 Kem St Patterson, LA | 3.0 | 2.0 | 1428 | $1,400 | $0.98 | 15d | 1 | 0.31mi |
Listing history 20 events
-
2026-06-21days on market $135,000 Active 18 DOM
-
2026-06-21days on market $135,000 Active 17 DOM
-
2026-06-18days on market $135,000 Active 15 DOM
-
2026-06-17days on market $135,000 Active 14 DOM
-
2026-06-16days on market $135,000 Active 13 DOM
-
2026-06-15days on market $135,000 Active 12 DOM
-
2026-06-13days on market $135,000 Active 10 DOM
-
2026-06-12days on market $135,000 Active 9 DOM
-
2026-06-09days on market $135,000 Active 6 DOM
-
2026-06-08days on market $135,000 Active 5 DOM
-
2026-06-07days on market $135,000 Active 4 DOM
-
2026-06-07days on market $135,000 Active 3 DOM
-
2026-06-04pricedays on market $135,000 Active 1 DOM
-
2026-03-26status Active 575-char remark
-
2026-03-26status Active 580-char remark
-
2026-03-06status Pending 575-char remark
-
2026-03-06status Pending 580-char remark
-
2025-11-17$139,500 Active 580-char remark
-
2025-11-17$139,500 Active 575-char remark
-
1997-12-02soldstatus $60,000
ⓘ Source: listings_history table (triggers on properties + properties_extension) + one-shot
backfill from property_details.listing_events for pre-trigger history.
Tax reassessment forecast LA · Resets to sale price
- Current annual tax
- $1,267 · $106/mo
- Projected year-2 tax
- $1,267 · $106/mo
- Expected delta
- $0/yr ($0/mo · 0.0%)
ⓘ Screening estimate from a state-policy table — verify with the county assessor before closing.
Climate risk First Street
- Flood 8/10 Severe FEMA zone X (shaded) · 60% chance over 30 yrs
- Wildfire 1/10 Low
- Heat 9/10 Extreme 7 d/yr ≥105°F today · 24 d/yr by 30 yrs out
- Wind 9/10 Extreme 99% chance of damaging wind over 30 yrs
- Air quality 1/10 Low 0 unhealthy d/yr today · 0 by 30 yrs out
Nearby sold comps map
Loading sold comps map…
Walkable amenities ~0.75 mi
Loading nearby amenities…
Taxation est. · year 1
- Rental income
- $16,800
- − Mortgage interest
- −$7,562
- − Property taxes
- −$1,267
- − Insurance
- −$1,472
- − Repairs & maintenance
- −$1,344
- − Management
- −$1,344
- − Depreciation
- −$3,927
- Taxable loss
- −$117
- Est. tax savings @ 24.0%
- +$28
- After-tax cash flow
- $2,065/yr
For passive investors: Depreciation is non-cash, so a rental often shows a tax loss while cash-flowing — sheltering income. Rental losses are passive: they offset passive income freely, and up to $25,000/yr can offset ordinary (W-2) income if you actively participate and your MAGI is under $100k (phasing out to $0 by $150k); unused losses carry forward. On sale, claimed depreciation is recaptured at up to 25%, and gains may owe capital-gains tax (a 1031 exchange can defer both). Figures are a year-1 estimate at your 24.0% rate — not tax advice; consult a CPA.
Schools (NCES district)
- District
- St. Mary Parish
- NCES district ID
- 2201620
- Math proficiency
- 28% ▼ -40.00%
- Reading proficiency
- 39% ▼ -33.00%
- Median HH income
- $39,843
- Composite
- 28.1/100
- National rank
- #6828
- State rank
- #37 of 98 in LA
Livability — Patterson
- Score
- 68/100
- State rank
- #101
- US rank
- #10077
Category grades
Schools grade is shown separately in the Schools card above.
Census & demographics
- Census place
- Patterson, LA
- City population
- 8,158
- Population (ZIP)
- 8,158
Population outlook (St. Mary County) Hauer SSP2
- Today (2025)
- 49,510 people
- By 2030
- 47,570 · -3.9%
- By 2040
- 43,880 · -11.4%
- By 2050
- 40,655 · -17.9%
- By 2075
- 37,190 · -24.9%
- By 2100
- 38,101 · -23.0%
Race, ethnicity, and origin ACS 2023
- Neighborhood character
- Diverse neighborhood (Simpson 0.57)
- Race & ethnicity
- White 53% Black 39% Two or more races 6% Hispanic / Latino 2%
- Common ancestry
- Lithuanian 8%
- Foreign-born
- 1% · Canada
- Languages at home
- 96% English-only · French/Haitian/Cajun 2% Spanish 1%
Political lean MEDSL · St. Mary
- 2024 margin
- Solid R (+31.9) · D 33.5% · R 65.4% · Other 1.0%
- 2008→2024 swing
- -15.1pp toward R · 2008: -16.8pp · 2024: -31.9pp
- All cycles
- 2024: R+31.9 2020: R+29.1 2016: R+27.6 2012: R+18.8 2008: R+16.8
Not yet ingested
- Civics
- —
Market trends
- HPI YoY
- ▼ -50.27%
- Current HPI
- 115.661
- Rent YoY
- —
- Metro
- —
- State GDP YoY
- ▲ 3.29%
- F500 in state
- 10
Industry mix (Fortune 500 HQ in LA)
| Industry | F500 HQs | Revenue |
|---|---|---|
| Telecommunications | 2 | $23B |
|
||
| Utilities | 1 | $12B |
|
||
| Wholesale / Distribution | 1 | $5B |
|
||
| Advertising | 1 | $2B |
|
||
Price history
+125.0% since first listed9 events — show timeline
- 2026-06-03 Listed $135,000 GBRMLS
- 2026-06-03 Listed $135,000 AcadianaMLS
- 2026-03-26 Relisted — AcadianaMLS
- 2026-03-26 Relisted — GBRMLS
- 2026-03-06 Pending — AcadianaMLS
- 2026-03-06 Pending — GBRMLS
- 2025-11-17 Listed $139,500 GBRMLS
- 2025-11-17 Listed $139,500 AcadianaMLS
- 1997-12-02 Sold (Public Records) $60,000 Public Records
Property tax history
+5.0%/yrLatest (2025): $1,267 · +6.6% YoY. Source: county tax records.
Cash-flow waterfall
monthlySold comps — $/sqft
last 12 mo · ≤1 miLoading sold comps…