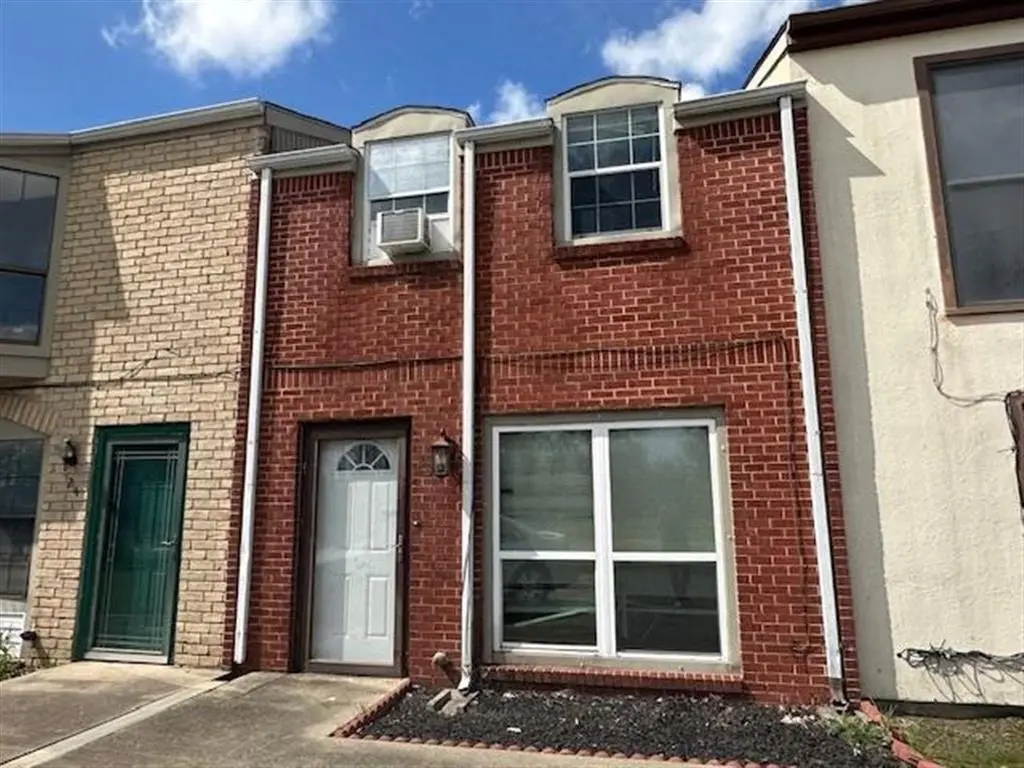
475 N Perkins Ferry Rd N #23 · Moss Bluff, LA
Flood risk 1/10 · Minimal
- FEMA flood zone
- X (unshaded)
- Chance of flooding over 30 yrs
- 0.0%
- Est. flood insurance / yr
- $507 – $1,088
Fire risk 3/10 · Minor
- Est. fire insurance / yr
- $1,269 – $2,357
Heat risk 9/10 · Severe
- Hot days now (above 110°F)
- 7 days/yr
- Hot days in 30 yrs
- 23 days/yr
Wind risk 9/10 · Severe
- Chance of severe wind over 30 yrs
- 99.0%
Air-quality risk 2/10 · Minimal
- Unhealthy air days now
- 1 days/yr
- Unhealthy air days in 30 yrs
- 1 days/yr
Risk factors via First Street. Map © Google.
Why this score? — see what drove the B- grade
The composite is a weighted blend of 9 inputs, each scored 0–100. Each bar is that input's sub-score; the figure is the points it added to the 100-point composite (weight × sub-score).
- Cash flow +30.0/30.0
- 1% rule +10.0/10.0
- DSCR +10.0/10.0
- ARV discount +7.5/15.0
- Livability +3.6/5.0
- Schools +3.1/10.0
- Rent growth +2.5/5.0
- Condition / age +2.2/5.0
- Appreciation +0.0/10.0
$52,900
🖨 Deal sheet 📄 Offer letter ✓ Due diligence
Listing remarks MLS
A rare find! Welcome to this 2-bedroom, 2-bath 2-Story Townhome. Light-filled living area. Kitchen has white cabinets and a breakfast bar. Fenced backyard with patio. Don't miss this opportunity—schedule your showing today!
Key facts
- Fenced backyard
- Breakfast bar
- $62 HOA
Tags
Neighborhood map
What this means for you Summary
Snapshot
- This is a 2-bed/2.0-bath townhouse listed at $53k. Condition is rated fair.
Deal economics
- At list price, monthly cash flow is $417 ($5k/yr) — positive.
- The deal already cash-flows at list — no discount required.
- Meets the 1% rule at list price ($1k rent vs $53k).
- Recommended offer: $50k (6.0% below list) — sets the bar for market timing.
- Cap rate 15.7% vs local median 3.5% in Moss Bluff — top-decile yield for the area; either an underpriced asset or a hidden risk that comps aren't pricing in. Stress-test before assuming the spread holds.
Location & tenants
- Location reads 72/100 on livability (#39 in LA) — a middle-class / working-renter tenant base. Strengths: cost of living A+, housing A+, employment A; Watch: schools D+, amenities F, commute F.
- Calcasieu Parish (other): math 30% / reading 44% proficiency, ranked #29 of 98 in LA (top 30%) — families likely to look elsewhere, expect single-tenant / working-renter base with shorter leases.
- Market conditions: 322 active listings in the ZIP; solid renter incomes; 1,298 units permitted in Calcasieu Parish in 2024 (526 in 5+ unit buildings).
- This rent is only 13% of the median local income ($102k/yr) — well below the 30% rent-burden line; pricing power to push rent on renewal without tenant pushback.
Forward outlook
- Local home prices are declining (-3.0%/yr); year-one equity from $366 of loan paydown is wiped out by about $2k of value loss. Plan a longer hold.
- Calcasieu County population projected at +11% by 2050 — modest demand growth; plan on rents tracking national, not racing it.
- At projected returns (-3.0% appreciation + 3.0% rent growth), your $15k cash investment doubles in ~4 years — after that, you're playing with house money.
Negotiation context
- It's been on market 80 days — a 6% lower offer ($50k) is reasonable based on typical stale-listing flexibility.
- 3 sale attempts since 6y ago; this cycle's ask has dropped $22k (29%) from the opening price — seller is motivated, your offer sets the floor, not the list.
Risks & watch-outs
- Climate carrying-cost: severe wind risk, 99% chance of damaging wind over 30y; extreme-heat days projected 7→23/yr by 2055 (HVAC capex compounding) — expect insurance premiums to compound above CPI over the hold.
Questions for the listing agent
- It's been on market 80 days. Have you received any prior offers? Is the seller open to a 6% concession, seller financing, or rate buy-down credit?
- Have any recent inspections been done? Can we get a copy of the seller's disclosures and any deferred-maintenance estimates?
- Built in 1975 — when were the roof, HVAC, electrical panel, plumbing, and water heater last replaced?
- What does the HOA fee cover, when was the last increase, and are there any pending special assessments or reserve-fund shortfalls?
- Why hasn't it sold? Are there any deal-killer items the seller is aware of (foundation, flood, title, zoning, code violations)?
- Is there a deadline driving the sale (1031 exchange, divorce, estate, relocation)? That informs how much negotiation room exists.
- Schools are D-rated, which usually means shorter tenancies and higher turnover. Who's the typical renter profile here, and what's been the actual vacancy rate?
- What's the average days-on-market for RENTAL listings here right now (not sales)? A rising rental-DOM trend means longer vacancies and softer asking-rent achievability than the comps imply.
- What's the recent tenant-quality profile in this submarket — average credit score on applications, eviction rate, late-payment / NSF rate, and stable-employment percentage? A property-management company in the area should have these aggregated.
- How much new for-sale + rental construction is in the pipeline within 1–3 miles? Heavy new supply typically softens prices + rents 12–24 months out; constrained supply supports both.
Investment metrics
- 1% rule
- 2.02% ✓
- Cap rate
- 15.75%
- Cash-on-cash
- 33.77%
- DSCR
- 2.50
- GRM
- 4.1
CMA / ARV
No comps found within radius.
Projected returns pro-forma
-3.0% appreciation · 3.0% rent growth · sell at horizon
- IRR
- 29.1%
- Equity multiple
- 2.22×
- Total profit
- $18,028
- Equity at exit
- $7,888
- IRR
- 36.5%
- Equity multiple
- 4.38×
- Total profit
- $50,101
- Equity at exit
- $4,574
Cash invested: $14,812 (down + closing). Projections, not guarantees.
Landlord ↔ Tenant lean methodology
- Overall (STATE)
- 90 Strongly Landlord-Friendly
- State Louisiana
- 90 Strongly Landlord-Friendly · R+12
- County
- — inherits STATE
- City
- — inherits STATE
ZIP-level market 70611
- Active inventory
- 322
- Price-to-rent
- 4.1×
Monthly cashflow live
- Estimated rent
- $1,069 medium interval (Pro) →
- Mortgage (P&I)
- −$277
- Tax est. 1.5%
- −$66 /mo · $794/yr
- Insurance
- −$22
- HOA
- −$62
- Vacancy / Maint / Mgmt
- −$224
- Net cashflow
- $417
Break-even live
UW: 25.0% down · 7.5% · 30yr · 1.5% tax · 5.0% vac · 8.0% maint · 8.0% mgmt
Financing live
Cash to close
- Down payment
- $13,225
- Closing costs
- $1,587
- Reserves months
- —
- Total cash needed
- —
Loan-product check · same deal, 3 products live
Conventional
25% down · 7.5% · 30yr
- Down + closing
- —
- Monthly P&I
- —
- Monthly cashflow
- —
- DSCR
- —
- Eligible?
- —
Personal DTI + credit; lowest rate.
DSCR
20% down · 8.5% · 30yr
- Down + closing
- —
- Monthly P&I
- —
- Monthly cashflow
- —
- DSCR
- —
- Eligible?
- —
No personal income docs; deal must DSCR.
Hard money
10% down · 12.0% · 12mo
- Down + closing
- —
- Monthly P&I
- —
- Monthly cashflow
- —
- DSCR
- —
- Eligible?
- —
Short-term bridge; refi at stabilization.
HOA detail
- Monthly dues
- $62 · $744/yr
Listing history 22 events
-
2026-06-19days on market $52,900 Active 80 DOM
-
2026-06-18days on market $52,900 Active 79 DOM
-
2026-06-17days on market $52,900 Active 78 DOM
-
2026-06-16days on market $52,900 Active 77 DOM
-
2026-06-15days on market $52,900 Active 76 DOM
-
2026-06-14days on market $52,900 Active 74 DOM
-
2026-06-13days on market $52,900 Active 73 DOM
-
2026-06-10days on market $52,900 Active 71 DOM
-
2026-06-09days on market $52,900 Active 70 DOM
-
2026-06-08days on market $52,900 Active 69 DOM
-
2026-06-07days on market $52,900 Active 68 DOM
-
2026-06-05pricedays on market $52,900 Active 65 DOM
-
2026-06-02days on market $64,900 Active 63 DOM
-
2026-06-01days on market $64,900 Active 62 DOM
-
2026-05-31days on market $64,900 Active 61 DOM
-
2026-05-30days on market $64,900 Active 60 DOM
-
2026-05-04price $64,900 229-char remark
Show marketing remark (229 chars)
A rare find! Welcome to this 2-bedroom, 2-bath 2-Story Townhome. Light-filled living area. Kitchen has white cabinets and a breakfast bar. Fenced backyard with patio. Don't miss this opportunity—schedule your showing today!
-
2026-03-31$74,900 Active 229-char remark
Show marketing remark (229 chars)
A rare find! Welcome to this 2-bedroom, 2-bath 2-Story Townhome. Light-filled living area. Kitchen has white cabinets and a breakfast bar. Fenced backyard with patio. Don't miss this opportunity—schedule your showing today!
-
2021-07-22soldstatus
-
2021-07-22$98,500
-
2020-07-21soldstatus
-
2020-04-02$88,000
ⓘ Source: listings_history table (triggers on properties + properties_extension) + one-shot
backfill from property_details.listing_events for pre-trigger history.
Climate risk First Street
- Flood 1/10 Low FEMA zone X (unshaded) · 0% chance over 30 yrs
- Wildfire 3/10 Moderate
- Heat 9/10 Extreme 7 d/yr ≥110°F today · 23 d/yr by 30 yrs out
- Wind 9/10 Extreme 99% chance of damaging wind over 30 yrs
- Air quality 2/10 Low 1 unhealthy d/yr today · 1 by 30 yrs out
Nearby sold comps map
Loading sold comps map…
Walkable amenities ~0.75 mi
Loading nearby amenities…
Taxation est. · year 1
- Rental income
- $12,826
- − Mortgage interest
- −$2,963
- − Property taxes
- −$794
- − Insurance
- −$264
- − Repairs & maintenance
- −$1,026
- − Management
- −$1,026
- − HOA
- −$744
- − Depreciation
- −$1,539
- Taxable income
- $4,470
- Est. tax owed @ 24.0%
- −$1,073
- After-tax cash flow
- $3,929/yr
For passive investors: Depreciation is non-cash, so a rental often shows a tax loss while cash-flowing — sheltering income. Rental losses are passive: they offset passive income freely, and up to $25,000/yr can offset ordinary (W-2) income if you actively participate and your MAGI is under $100k (phasing out to $0 by $150k); unused losses carry forward. On sale, claimed depreciation is recaptured at up to 25%, and gains may owe capital-gains tax (a 1031 exchange can defer both). Figures are a year-1 estimate at your 24.0% rate — not tax advice; consult a CPA.
Condition & rehab AI · 8 photos
This 2-bedroom, 2-bath townhome requires moderate renovations to improve its condition and increase its value.
Repairs flagged
- Minor ceiling — spackling visible
- Minor kitchen cabinets — slight wear
- Minor bathroom fixtures — standard condition
Value-add opportunities
- Both paint interior walls — enhances curb appeal and interior aesthetics
- Both replace kitchen cabinets — modernizes kitchen and adds value
- Both install new bathroom fixtures — updates bathroom and improves functionality
Renovation cost estimate screening
| Repair item | Severity | Est. cost |
|---|---|---|
| ceiling · spackling visible | Minor | $500–3,000 |
| kitchen cabinets · slight wear | Minor | $500–3,000 |
| bathroom fixtures · standard condition | Minor | $500–3,000 |
| Total estimated repair cost · 3 items | $1,500–9,000 |
Value-add ROI direction
- Both paint interior walls — enhances curb appeal and interior aesthetics ↑
- Both replace kitchen cabinets — modernizes kitchen and adds value ↑
- Both install new bathroom fixtures — updates bathroom and improves functionality ↑
ⓘ Cost ranges are severity-bucket heuristics (US national rule-of-thumb). Get contractor quotes + a written scope before underwriting a rehab budget.
Schools (NCES district)
- District
- Calcasieu Parish
- NCES district ID
- 2200330
- Math proficiency
- 30% ▼ -39.00%
- Reading proficiency
- 44% ▼ -33.00%
- Median HH income
- $44,700
- Composite
- 31.45/100
- National rank
- #5979
- State rank
- #29 of 98 in LA
Livability — Moss Bluff
- Score
- 72/100
- State rank
- #39
- US rank
- #6117
Category grades
Schools grade is shown separately in the Schools card above.
Census & demographics
- Census place
- Moss Bluff, LA
- County
- Calcasieu Parish · 170,889 people
- Metro
- Lake Charles, LA
- Population (ZIP)
- 22,124
- Household income
- $101,844
- Rent vs Own
- Severe rent burden
- 183.0
Population outlook (Calcasieu County) Hauer SSP2
- Today (2025)
- 212,179 people
- By 2030
- 218,199 · +2.8%
- By 2040
- 228,486 · +7.7%
- By 2050
- 236,208 · +11.3%
- By 2075
- 251,696 · +18.6%
- By 2100
- 247,848 · +16.8%
Race, ethnicity, and origin ACS 2023
- Neighborhood character
- Predominantly White (84%)
- Race & ethnicity
- White 84% Black 11% Two or more races 3% Hispanic / Latino 2%
- Common ancestry
- Lithuanian 10% Slovak 2% Italian 1%
- Foreign-born
- 1% · Canada
- Languages at home
- 97% English-only · French/Haitian/Cajun 1% Spanish 1%
Political lean MEDSL · Calcasieu
- 2024 margin
- Solid R (+39.6) · D 29.5% · R 69.0% · Other 1.5%
- 2008→2024 swing
- -15.0pp toward R · 2008: -24.6pp · 2024: -39.6pp
- All cycles
- 2024: R+39.6 2020: R+35.2 2016: R+33.3 2012: R+28.7 2008: R+24.6
Not yet ingested
- Civics
- —
Market trends
- HPI YoY
- ▼ -84.82%
- Current HPI
- 115.0052
- Rent YoY
- —
- Metro
- Lake Charles, LA
- State GDP YoY
- ▲ 3.29%
- F500 in state
- 10
Industry mix (Fortune 500 HQ in LA)
| Industry | F500 HQs | Revenue |
|---|---|---|
| Telecommunications | 2 | $23B |
|
||
| Utilities | 1 | $12B |
|
||
| Wholesale / Distribution | 1 | $5B |
|
||
| Advertising | 1 | $2B |
|
||
Price history
-26.2% since first listed6 events — show timeline
- 2026-05-04 Price Changed $64,900 SWLAR
- 2026-03-31 Listed $74,900 SWLAR
- 2021-07-22 Listed $98,500 SWLAR
- 2021-07-22 Sold (MLS) — SWLAR
- 2020-07-21 Sold (MLS) — SWLAR
- 2020-04-02 Listed $88,000 SWLAR
Cash-flow waterfall
monthlySold comps — $/sqft
last 12 mo · ≤1 miLoading sold comps…