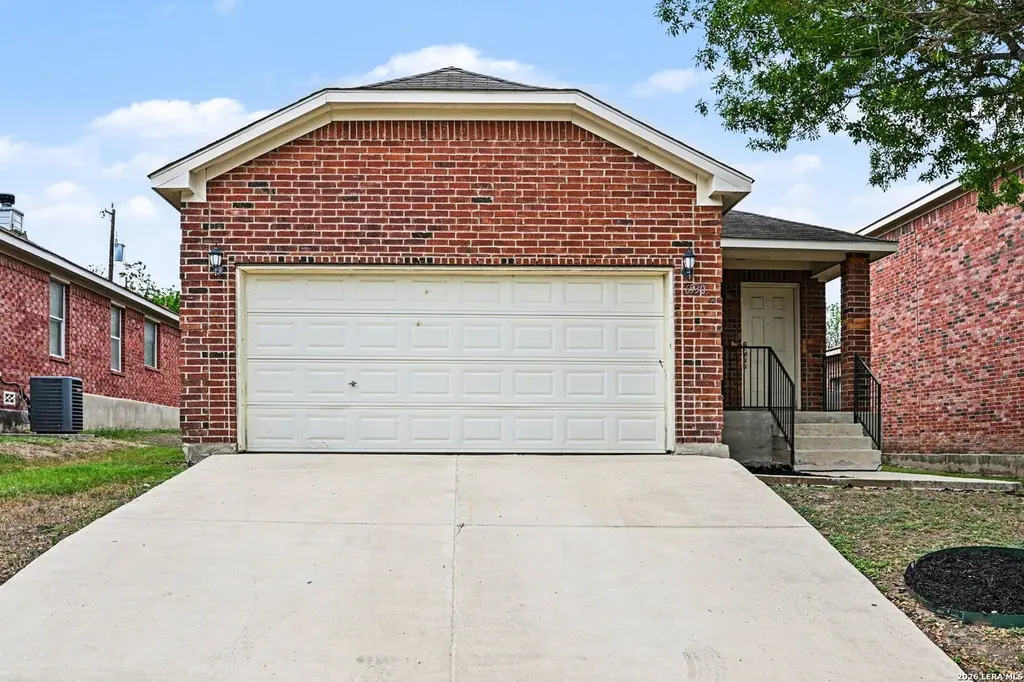
6530 Ithaca Fls · San Antonio, TX
Flood risk 1/10 · Minimal
- FEMA flood zone
- X (unshaded)
- Chance of flooding over 30 yrs
- 0.0%
- Est. flood insurance / yr
- $507 – $1,088
Fire risk 2/10 · Minimal
- Est. fire insurance / yr
- $1,222 – $2,270
Heat risk 8/10 · Major
- Hot days now (above 107°F)
- 6 days/yr
- Hot days in 30 yrs
- 18 days/yr
Wind risk 8/10 · Major
- Chance of severe wind over 30 yrs
- 80.0%
Air-quality risk 2/10 · Minimal
- Unhealthy air days now
- 0 days/yr
- Unhealthy air days in 30 yrs
- 1 days/yr
Risk factors via First Street. Map © Google.
Why this score? — see what drove the D grade
The composite is a weighted blend of 9 inputs, each scored 0–100. Each bar is that input's sub-score; the figure is the points it added to the 100-point composite (weight × sub-score).
- ARV discount +15.0/15.0
- Cash flow +8.0/30.0
- Livability +4.0/5.0
- 1% rule +3.8/10.0
- Schools +3.8/10.0
- Condition / age +2.5/5.0
- Rent growth +2.2/5.0
- DSCR +2.1/10.0
- Appreciation +0.0/10.0
$194,900
🖨 Deal sheet (PDF) 📄 Offer letter ✓ Due diligence
Listing remarks MLS
Move-in ready three-bedroom, two-bathroom home featuring a spacious and inviting open floor plan. The living room serves as the heart of the home, centered around a cozy fireplace that adds warmth and character to the space. The primary suite is a true retreat, offering an attached ensuite bathroom complete with a relaxing garden tub, a separate standing shower, and dual sinks for added convenience. You are just minutes away from local shopping, a variety of dining options, and area parks. Schedule your showing today!
Key facts
- 4,965 sq ft lot
- 2 garage spots
- Built 2006
Neighborhood map
What this means for you Summary
Snapshot
- This is a 3-bed/2.0-bath single-family listed at $195k.
Deal economics
- At list price, monthly cash flow is $-197 ($-2k/yr) — negative.
- To cash-flow at today's rent, offer at most $160k (17.9% below list).
- To meet the 1% rule (rent ≥ 1% of price), the offer needs to be $171k (12.3% below list).
- Recommended offer: $160k (17.9% below list) — sets the bar for cash-flow.
- Cap rate 5.1% vs local median 3.8% in San Antonio — top-decile yield for the area; either an underpriced asset or a hidden risk that comps aren't pricing in. Stress-test before assuming the spread holds.
Location & tenants
- Location reads 80/100 on livability (#31 in TX, #1,616 nationally) — a professional / high-income tenant draw. Strengths: amenities A+, commute A+, cost of living A+; Watch: crime F.
- North East ISD (urban): math 38% / reading 49% proficiency, ranked #276 of 826 in TX (top 33%) — families likely to look elsewhere, expect single-tenant / working-renter base with shorter leases.
- Zoned schools: Royal Ridge El (math 26% / reading 35%, grade F, #2,464 of 4,322 statewide, top 58%, 468 students, 74% FRL); White Middle (math 28% / reading 40%, grade F, #892 of 1,662 statewide, top 55%, 944 students, 68% FRL); Roosevelt H S (math 20% / reading 40%, grade F, #1,096 of 1,632 statewide, top 68%, 2,599 students, 72% FRL) — zoned schools average 71% FRL vs 41% district-wide (30 pts higher); higher-poverty schools than district average — tighter screening recommended.
- Zoned-school proficiency averages 32% at this address vs 44% district-wide (-12 pts) — the specific schools serving this property underperform the North East ISD average; the district grade overstates school quality for this exact location.
- Market conditions: Rents soft (-1.1%/yr); 211 active listings in the ZIP; 40 comparable units currently listed for rent nearby; rentals leasing fast (median 13d on market — plan ~1-2 weeks tenant-placement turnaround); 8,308 units permitted in Bexar County in 2024 (2,506 in 5+ unit buildings).
Forward outlook
- Local home prices are declining (-3.0%/yr); year-one equity from $1k of loan paydown is wiped out by about $6k of value loss. Plan a longer hold.
- Bexar County population projected at +50% by 2050 — long-run rental-demand tailwind backs the buy-and-hold thesis.
Negotiation context
- It's been on market 73 days — a 6% lower offer ($183k) is reasonable based on typical stale-listing flexibility.
Risks & watch-outs
- Watch-outs: property tax is 2.7% of price.
- Climate carrying-cost: severe wind risk, 80% chance of damaging wind over 30y; extreme-heat days projected 6→18/yr by 2055 (HVAC capex compounding) — expect insurance premiums to compound above CPI over the hold.
Questions for the listing agent
- What do current leases actually rent for vs. the listed asking? Can we see a recent rent roll and the last 12 months of T-12 income?
- It's been on market 73 days. Have you received any prior offers? Is the seller open to a 18% concession, seller financing, or rate buy-down credit?
- Property tax is high relative to price — has the assessment been appealed recently, and will the sale trigger a re-assessment?
- What does the HOA fee cover, when was the last increase, and are there any pending special assessments or reserve-fund shortfalls?
- Why hasn't it sold? Are there any deal-killer items the seller is aware of (foundation, flood, title, zoning, code violations)?
- Is there a deadline driving the sale (1031 exchange, divorce, estate, relocation)? That informs how much negotiation room exists.
- Crime grade is F in this area — have there been break-ins, vandalism, or insurance claims at this property in the last 3 years? What carrier currently insures it and at what premium?
- The area grade is low — what's the realistic commute time and amenity access for the typical tenant pool here? Any planned neighborhood developments (good or bad) we should know about?
- What's the average days-on-market for RENTAL listings here right now (not sales)? A rising rental-DOM trend means longer vacancies and softer asking-rent achievability than the comps imply.
- What's the recent tenant-quality profile in this submarket — average credit score on applications, eviction rate, late-payment / NSF rate, and stable-employment percentage? A property-management company in the area should have these aggregated.
- How much new for-sale + rental construction is in the pipeline within 1–3 miles? Heavy new supply typically softens prices + rents 12–24 months out; constrained supply supports both.
Investment metrics
- 1% rule
- 0.88% ✗
- Cap rate
- 5.08%
- Cash-on-cash
- -4.34%
- DSCR
- 0.81
- GRM
- 9.5
CMA / ARV
- ARV (median comp)
- $244,046
- List price
- $194,900
- Delta
- -20.14%
- Verdict
- UNDERPRICED
- Comps
- 20 within 1.0 mi
Show comp detail 12 sales within ~0.75 mi
| Address | Dist | Beds/Ba | Sqft | Sold | Price | $/sf | Match |
|---|---|---|---|---|---|---|---|
| 6422 Ithaca Fls | 0.10mi | 3/2.0 | 1,630 (0%) | 4mo | $214,900 | $132 | 92 |
| 6415 Ithaca | 0.14mi | 3/2.0 | 1,630 (0%) | 2mo | $221,000 | $136 | 91 |
| 6430 Ithaca Fls | 0.09mi | 3/2.0 | 1,520 (-7%) | 1mo | $170,000 | $112 | 84 |
| 10274 King Robert | 0.16mi | 3/2.0 | 1,522 (-7%) | 3mo | $345,125 | $227 | 79 |
| 6611 Wood Bench | 0.37mi | 3/2.0 | 1,586 (-3%) | 2mo | $242,000 | $153 | 76 |
| 6455 Wind Cyn | 0.68mi | 3/2.0 | 1,642 (+1%) | 2mo | $266,000 | $162 | 65 |
| 6035 Royal Breeze | 0.36mi | 3/2.0 | 1,846 (+13%) | 2mo | $290,000 | $157 | 59 |
| 5835 Royal Clb | 0.74mi | 3/2.0 | 1,561 (-4%) | 1mo | $227,000 | $145 | 57 |
| 9834 Dull Knife | 0.71mi | 3/2.0 | 1,496 (-8%) | 3mo | $199,000 | $133 | 50 |
| 7105 Walkers Loop | 0.60mi | 3/2.0 | 1,835 (+13%) | 4mo | $380,000 | $207 | 48 |
| 7122 Walkers Loop | 0.66mi | 3/2.0 | 1,837 (+13%) | 2mo | $390,990 | $213 | 46 |
| 6747 Sunlit Pass | 0.64mi | 3/2.0 | 1,386 (-15%) | 3mo | $209,000 | $151 | 42 |
Match score weights: distance 35% · size 25% · config 20% · recency 20%. Top-matched comps best support the ARV.
Projected returns pro-forma
-3.0% appreciation · 0.0% rent growth · sell at horizon
- IRR
- -27.5%
- Equity multiple
- 0.10×
- Total profit
- $-49,010
- Equity at exit
- $29,060
- IRR
- -45.8%
- Equity multiple
- -0.42×
- Total profit
- $-77,607
- Equity at exit
- $16,851
Cash invested: $54,572 (down + closing). Projections, not guarantees.
Landlord ↔ Tenant lean methodology
- Overall (STATE)
- 87 Strongly Landlord-Friendly
- State Texas
- 87 Strongly Landlord-Friendly · R+5
- County
- — inherits STATE
- City
- — inherits STATE
ZIP-level market 78239
- Home prices YoY
- -5.9%
- Rents YoY
- -1.1%
- Active inventory
- 211
- Price-to-rent
- 9.5×
Monthly cashflow live
- Estimated rent
- $1,708 high interval (Pro) →
- Mortgage (P&I)
- −$1,022
- Tax from tax record
- −$433 /mo · $5,193/yr
- Insurance
- −$81
- HOA
- −$11
- Vacancy / Maint / Mgmt
- −$359
- Net cashflow
- $-197
Break-even live
Sensitivity live
| Price | -10% $-87 | -5% $-142 | +0% $-197 | +5% $-253 | +10% $-308 |
|---|---|---|---|---|---|
| Rent | -10% $-332 | -5% $-265 | +0% $-197 | +5% $-130 | +10% $-62 |
| Rate | -1.0pp $-99 | -0.5pp $-148 | base $-197 | +0.5pp $-248 | +1.0pp $-299 |
UW: 25.0% down · 7.5% · 30yr · 1.5% tax · 5.0% vac · 8.0% maint · 8.0% mgmt
Financing live
Cash to close
- Down payment
- $48,725
- Closing costs
- $5,847
- Reserves months
- —
- Total cash needed
- —
Loan-product check · same deal, 3 products live
Conventional
25% down · 7.5% · 30yr
- Down + closing
- —
- Monthly P&I
- —
- Monthly cashflow
- —
- DSCR
- —
- Eligible?
- —
Personal DTI + credit; lowest rate.
DSCR
20% down · 8.5% · 30yr
- Down + closing
- —
- Monthly P&I
- —
- Monthly cashflow
- —
- DSCR
- —
- Eligible?
- —
No personal income docs; deal must DSCR.
Hard money
10% down · 12.0% · 12mo
- Down + closing
- —
- Monthly P&I
- —
- Monthly cashflow
- —
- DSCR
- —
- Eligible?
- —
Short-term bridge; refi at stabilization.
Rent comps 40 comps
| Address | Beds | Baths | Sqft | Rent | $/sqft | DOM | Units | Dist |
|---|---|---|---|---|---|---|---|---|
| 6527 Ithaca Fls San Antonio, TX | 3.0 | 2.5 | 1528 | $1,850 | $1.21 | 0d | 1 | 0.03mi |
| 6527 Ithaca Fls San Antonio, TX | 3.0 | 2.5 | 1528 | $1,850 | $1.21 | 6d | 1 | 0.03mi |
| 6427 Ithaca Fls San Antonio, TX | 3.0 | 2.0 | 1314 | $1,595 | $1.21 | 25d | 1 | 0.08mi |
| 6427 Ithaca Fls San Antonio, TX | 3.0 | 2.0 | 1315 | $1,595 | $1.21 | 9d | 1 | 0.08mi |
| 6503 Ithaca Frst San Antonio, TX | 3.0 | 2.0 | 1630 | $1,695 | $1.04 | 45d | 1 | 0.09mi |
| 6406 Ithaca Fls San Antonio, TX | 3.0 | 2.5 | 1508 | $1,500 | $0.99 | 12d | 1 | 0.11mi |
| 10527 Sonora Sunset San Antonio, TX | 3.0 | 2.5 | 1582 | $1,599 | $1.01 | 9d | 1 | 0.16mi |
| 10527 Sonora Sunset San Antonio, TX | 3.0 | 2.5 | 1582 | $1,599 | $1.01 | 22d | 1 | 0.16mi |
| 10958 Crown Park San Antonio, TX | 3.0 | 2.5 | 1750 | $1,500 | $0.86 | 12d | 1 | 0.40mi |
| 6607 Shadden Oaks San Antonio, TX | 3.0 | 2.0 | 1525 | $1,800 | $1.18 | 25d | 1 | 0.49mi |
| 6722 Badger Pass Dr San Antonio, TX | 4.0 | 2.0 | 2180 | $1,795 | $0.82 | 6d | 1 | 0.52mi |
| 7350 Walkers Loop Unit 1 Live Oak, TX | 4.0 | 3.0 | 1938 | $2,400 | $1.24 | 19d | 1 | 0.54mi |
| 9711 Arcade Rdg San Antonio, TX | 3.0 | 2.0 | 1210 | $1,299 | $1.07 | 45d | 1 | 0.59mi |
| 9426 Apple Ridge Ln Unit 603 San Antonio, TX | 3.0 | 2.5 | 1225 | $1,450 | $1.18 | 9d | 1 | 0.60mi |
| 5868 Royal Rdg San Antonio, TX | 3.0 | 2.5 | 2084 | $1,750 | $0.84 | 0d | 1 | 0.68mi |
| 9839 Logans Ridge Dr Converse, TX | 4.0 | 2.5 | 1988 | $1,695 | $0.85 | 6d | 1 | 0.70mi |
| 9410 Fulwood Trl San Antonio, TX | 3.0 | 2.0 | 1210 | $1,425 | $1.18 | 23d | 1 | 0.70mi |
| 6635 Barton Rock Rd San Antonio, TX | 3.0 | 2.0 | 1386 | $1,600 | $1.15 | 0d | 1 | 0.73mi |
| 9806 Pebble Ridge Dr Converse, TX | 3.0 | 3.0 | 2131 | $1,850 | $0.87 | 45d | 1 | 0.75mi |
| 5838 Royal Bnd San Antonio, TX | 3.0 | 2.5 | 1908 | $1,850 | $0.97 | 12d | 1 | 0.77mi |
| 9318 Bending Crst San Antonio, TX | 4.0 | 2.5 | 1879 | $1,700 | $0.90 | 12d | 1 | 0.81mi |
| 10306 Pinehurst Run San Antonio, TX | 3.0 | 2.0 | 1271 | $1,750 | $1.38 | 0d | 1 | 0.85mi |
| 7733 Forest Strm Live Oak, TX | 3.0 | 2.0 | 2041 | $1,975 | $0.97 | 16d | 1 | 0.85mi |
| 6811 Evercrest Ln San Antonio, TX | 3.0 | 2.5 | 1582 | $2,100 | $1.33 | 25d | 1 | 0.92mi |
| 10503 Ludlow Ct San Antonio, TX | 4.0 | 2.0 | 1690 | $1,100 | $0.65 | 6d | 1 | 0.94mi |
| 7110 Ridge Port Dr Converse, TX | 3.0 | 2.0 | 1589 | $1,600 | $1.01 | 14d | 1 | 0.97mi |
| 12010 Sailing Away St San Antonio, TX | 3.0 | 2.0 | 1906 | $1,875 | $0.98 | 4d | 1 | 0.98mi |
| 8818 Bridington San Antonio, TX | 3.0 | 2.0 | 1814 | $2,100 | $1.16 | 16d | 1 | 0.99mi |
| 9526 Millers Rdg San Antonio, TX | 4.0 | 2.0 | 2173 | $1,699 | $0.78 | 25d | 1 | 1.02mi |
| 7106 Comanche Rdg Converse, TX | 3.0 | 2.0 | 1592 | $1,750 | $1.10 | 25d | 1 | 1.02mi |
| 9535 Apple Ridge Ln San Antonio, TX | 3.0 | 2.0 | 1602 | $1,638 | $1.02 | 5d | 1 | 1.04mi |
| 9527 Apple Ridge Ln San Antonio, TX | 3.0 | 2.0 | 1602 | $1,575 | $0.98 | 0d | 1 | 1.06mi |
| 6918 Crestway Rd Unit 2 San Antonio, TX | 3.0 | 2.5 | 1225 | $1,395 | $1.14 | 0d | 1 | 1.08mi |
| 6918 Crestway Rd Unit 4 San Antonio, TX | 3.0 | 2.5 | 1261 | $1,420 | $1.13 | 0d | 1 | 1.08mi |
| 6926 Crestway Rd San Antonio, TX | 3.0 | 2.5 | 1325 | $1,345 | $1.02 | 45d | 1 | 1.11mi |
| 9426 Apple Ridge Ln San Antonio, TX | 3.0 | 2.5 | 1225 | $1,350 | $1.10 | 45d | 1 | 1.13mi |
| 9426 Apple Ridge Ln San Antonio, TX | 3.0 | 2.5 | 1225 | $1,495 | $1.22 | 12d | 1 | 1.13mi |
| 6934 Crestway Rd #2 San Antonio, TX | 3.0 | 2.5 | 1225 | $1,395 | $1.14 | 0d | 1 | 1.13mi |
| 7239 Converse Ridge Ln Unit 603 Windcrest, TX | 3.0 | 2.5 | 1225 | $1,450 | $1.18 | 14d | 1 | 1.13mi |
| 7239 Converse Ridge Ln Unit 703 Windcrest, TX | 3.0 | 2.5 | 1225 | $1,500 | $1.22 | 25d | 1 | 1.13mi |
HOA detail
- Monthly dues
- $11 · $132/yr
Listing history 17 events
-
2026-06-21days on market $194,900 Active 73 DOM
-
2026-06-18days on market $194,900 Active 70 DOM
-
2026-06-17days on market $194,900 Active 69 DOM
-
2026-06-16days on market $194,900 Active 68 DOM
-
2026-06-13days on market $194,900 Active 65 DOM
-
2026-06-13days on market $194,900 Active 64 DOM
-
2026-06-09statusdays on market $194,900 Active 61 DOM
-
2026-06-08days on market $194,900 Price Change 60 DOM
-
2026-06-07days on market $194,900 Price Change 59 DOM
-
2026-06-04days on market $194,900 Price Change 56 DOM
-
2026-06-03days on market $194,900 Price Change 55 DOM
-
2026-06-02days on market $194,900 Price Change 54 DOM
-
2026-06-01days on market $194,900 Price Change 53 DOM
-
2026-05-31days on market $194,900 Price Change 52 DOM
-
2026-05-08price $199,900 524-char remark
Show marketing remark (524 chars)
Move-in ready three-bedroom, two-bathroom home featuring a spacious and inviting open floor plan. The living room serves as the heart of the home, centered around a cozy fireplace that adds warmth and character to the space. The primary suite is a true retreat, offering an attached ensuite bathroom complete with a relaxing garden tub, a separate standing shower, and dual sinks for added convenience. You are just minutes away from local shopping, a variety of dining options, and area parks. Schedule your showing today!
-
2026-04-09$209,900 New 524-char remark
Show marketing remark (524 chars)
Move-in ready three-bedroom, two-bathroom home featuring a spacious and inviting open floor plan. The living room serves as the heart of the home, centered around a cozy fireplace that adds warmth and character to the space. The primary suite is a true retreat, offering an attached ensuite bathroom complete with a relaxing garden tub, a separate standing shower, and dual sinks for added convenience. You are just minutes away from local shopping, a variety of dining options, and area parks. Schedule your showing today!
-
2026-04-02soldstatus
ⓘ Source: listings_history table (triggers on properties + properties_extension) + one-shot
backfill from property_details.listing_events for pre-trigger history.
Tax reassessment forecast TX · Resets to sale price
- Current annual tax
- $5,193 · $433/mo
- Projected year-2 tax
- $5,193 · $433/mo
- Expected delta
- $0/yr ($0/mo · 0.0%)
ⓘ Screening estimate from a state-policy table — verify with the county assessor before closing.
Climate risk First Street
- Flood 1/10 Low FEMA zone X (unshaded) · 0% chance over 30 yrs
- Wildfire 2/10 Low
- Heat 8/10 Severe 6 d/yr ≥107°F today · 18 d/yr by 30 yrs out
- Wind 8/10 Severe 80% chance of damaging wind over 30 yrs
- Air quality 2/10 Low 0 unhealthy d/yr today · 1 by 30 yrs out
Nearby sold comps map
Loading sold comps map…
Walkable amenities ~0.75 mi
Loading nearby amenities…
Taxation est. · year 1
- Rental income
- $20,501
- − Mortgage interest
- −$10,917
- − Property taxes
- −$5,193
- − Insurance
- −$974
- − Repairs & maintenance
- −$1,640
- − Management
- −$1,640
- − HOA
- −$132
- − Depreciation
- −$5,670
- Taxable loss
- −$5,666
- Est. tax savings @ 24.0%
- +$1,360
- After-tax cash flow
- $-1,009/yr
For passive investors: Depreciation is non-cash, so a rental often shows a tax loss while cash-flowing — sheltering income. Rental losses are passive: they offset passive income freely, and up to $25,000/yr can offset ordinary (W-2) income if you actively participate and your MAGI is under $100k (phasing out to $0 by $150k); unused losses carry forward. On sale, claimed depreciation is recaptured at up to 25%, and gains may owe capital-gains tax (a 1031 exchange can defer both). Figures are a year-1 estimate at your 24.0% rate — not tax advice; consult a CPA.
Schools (NCES district)
- District
- North East ISD
- NCES district ID
- 4832940
- Math proficiency
- 38% ▼ -14.00%
- Reading proficiency
- 49% ▼ -4.00%
- Median HH income
- $57,715
- Composite
- 38.1/100
- National rank
- #4276
- State rank
- #276 of 826 in TX
Livability — San Antonio
- Score
- 80/100
- State rank
- #31
- US rank
- #1616
Category grades
Schools grade is shown separately in the Schools card above.
Census & demographics
- Census place
- San Antonio, TX
- County
- Bexar County · 1,990,555 people
- City population
- 1,806,925
- Metro
- San Antonio-New Braunfels, TX
- Population (ZIP)
- 28,609
- Household income
- $70,098
- Rent vs Own
- Severe rent burden
- 488.0
Population outlook (Bexar County) Hauer SSP2
- Today (2025)
- 2,336,851 people
- By 2030
- 2,560,728 · +9.6%
- By 2040
- 3,020,569 · +29.3%
- By 2050
- 3,493,522 · +49.5%
- By 2075
- 4,668,459 · +99.8%
- By 2100
- 5,533,242 · +136.8%
Race, ethnicity, and origin ACS 2023
- Neighborhood character
- Diverse neighborhood (Simpson 0.66)
- Race & ethnicity
- Hispanic / Latino 47% White 30% Two or more races 20% Black 16% Asian 4% Pacific Islander 2%
- Hispanic origin (detail)
- Mexican 38% Puerto Rican 4%
- Common ancestry
- Lithuanian 2% Romanian 1% Slovak 1%
- Foreign-born
- 13% · Canada, Vietnam, Jamaica
- Languages at home
- 72% English-only · Spanish 24% Vietnamese 1% Chinese 1%
Political lean MEDSL · Bexar
- 2024 margin
- Lean D (+9.8) · D 54.3% · R 44.6% · Other 1.1%
- 2008→2024 swing
- +4.2pp toward D · 2008: 5.6pp · 2024: 9.8pp
- All cycles
- 2024: D+9.8 2020: D+18.2 2016: D+13.5 2012: D+4.6 2008: D+5.6
Not yet ingested
- Civics
- —
Market trends
- HPI YoY
- ▼ -15.13%
- Current HPI
- 242.1272
- Rent YoY
- ▼ -1.05%
- Metro
- San Antonio-New Braunfels, TX
- State GDP YoY
- ▲ 3.95%
- F500 in state
- 110
Industry mix (Fortune 500 HQ in TX)
| Industry | F500 HQs | Revenue |
|---|---|---|
| Energy | 16 | $1,198B |
|
||
| Technology | 5 | $198B |
|
||
| Engineering / Construction | 4 | $72B |
|
||
| Energy Services | 3 | $60B |
|
||
| Utilities | 3 | $41B |
|
||
| Healthcare | 2 | $330B |
|
||
Price history
-4.8% since first listed3 events — show timeline
- 2026-05-08 Price Changed $199,900 LERA
- 2026-04-09 Listed $209,900 LERA
- 2026-04-02 Sold (Public Records) — Public Records
Property tax history
+4.7%/yrLatest (2025): $5,193 · -4.1% YoY. Source: county tax records.
Cash-flow waterfall
monthlySold comps — $/sqft
last 12 mo · ≤1 miLoading sold comps…