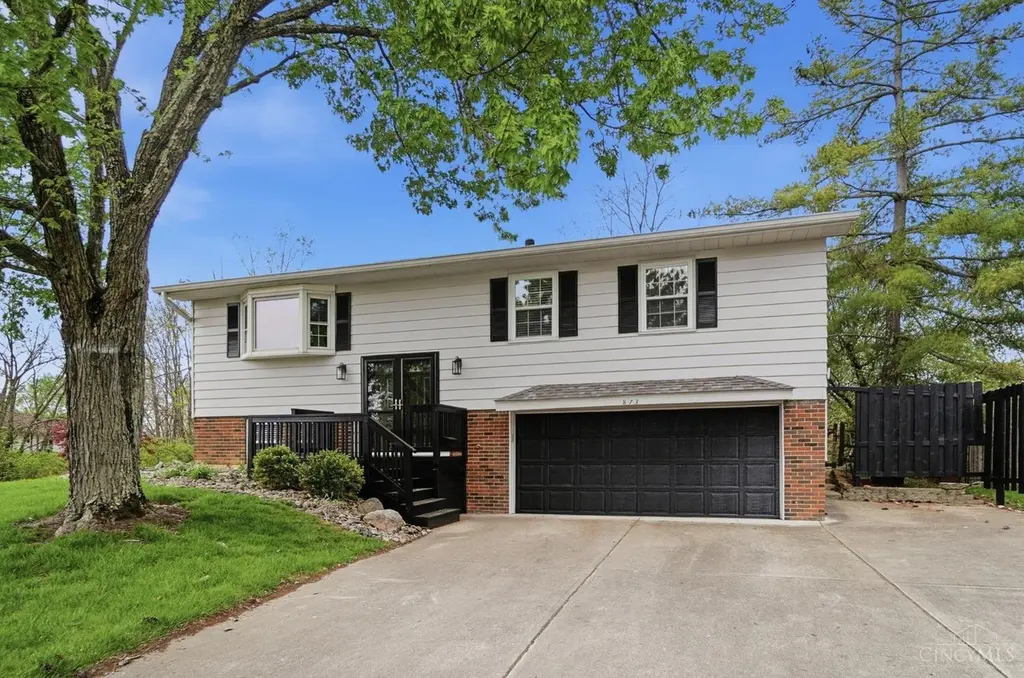
873 Tradewind Dr · Mason, OH
Flood risk 4/10 · Minor
- FEMA flood zone
- X (unshaded)
- Chance of flooding over 30 yrs
- 0.22%
- Est. flood insurance / yr
- $473 – $860
Fire risk 1/10 · Minimal
- Est. fire insurance / yr
- $713 – $1,323
Heat risk 4/10 · Minor
- Hot days now (above 101°F)
- 7 days/yr
- Hot days in 30 yrs
- 19 days/yr
Wind risk 2/10 · Minimal
- Chance of severe wind over 30 yrs
- 1.0%
Air-quality risk 4/10 · Minor
- Unhealthy air days now
- 5 days/yr
- Unhealthy air days in 30 yrs
- 7 days/yr
Risk factors via First Street. Map © Google.
Why this score? — see what drove the D grade
The composite is a weighted blend of 9 inputs, each scored 0–100. Each bar is that input's sub-score; the figure is the points it added to the 100-point composite (weight × sub-score).
- Cash flow +10.3/30.0
- ARV discount +9.0/15.0
- Schools +7.2/10.0
- Livability +4.2/5.0
- Rent growth +3.4/5.0
- DSCR +2.9/10.0
- 1% rule +2.5/10.0
- Condition / age +2.5/5.0
- Appreciation +0.0/10.0
$425,000
🖨 Deal sheet (PDF) 📄 Offer letter ✓ Due diligence
Listing remarks MLS
Must See in Mason! Beautifully updated and meticulously maintained 4-bedroom, 2-bath bi-level home in one of the most sought-after areas of Mason, Ohio! This home offers a spacious lower-level primary suite featuring a walk-in closet and private ensuite bath - perfect for added comfort and privacy. Step outside to your own backyard oasis, ideal for entertaining, complete with a covered bar, fire pit, wood deck, storage shed, and plenty of yard space to enjoy! The kitchen shines with new stainless steel appliances, and major updates - including roof, HVAC, water heater, and windows - provide peace of mind for years to come. Electrical updated as of June 2026. Move-in ready and packed with value... this one won't last long!
Key facts
- Walk-in closet
- Backyard oasis
- Fire pit
Tags
Property features AI
Finance
- Other: Lease not considered
- HOA & community: No HOA
Exterior
- Parking: Attached front garage with 2 garage spaces
- Utilities: Public water; Public sewer; Natural gas
- Home design: Traditional single-family home; Poured foundation
- Construction: Aluminum siding; Brick construction; Poured foundation; Shingle roof
- Exterior features: Aluminum siding and brick exterior; Vinyl insulated windows; Shingle roof; Residential zoning
Interior
- Kitchen: Kitchen (10 x 11)
- Bedrooms: 4 bedrooms total; Primary bedroom (20 x 12) on the lower level; Bedroom 2 (9 x 12) on the upper level; Bedroom 3 (15 x 11) on the upper level; Bedroom 4 (11 x 11) on the upper level
- Bathrooms: 2 full bathrooms; Full bathroom on the lower level; Full bathroom on the upper level
- Heating & cooling: Forced air heating (gas); Central air conditioning; Gas water heating
- Interior features: 8 total rooms; Finished full basement
- Laundry & utility: Basement utility area
Neighborhood map
What this means for you Summary
Snapshot
- This is a 4-bed/2.0-bath single-family listed at $425k.
Deal economics
- At list price, monthly cash flow is $-235 ($-3k/yr) — negative.
- To cash-flow at today's rent, offer at most $383k (9.8% below list).
- To meet the 1% rule (rent ≥ 1% of price), the offer needs to be $317k (25.3% below list).
- Recommended offer: $317k (25.3% below list) — sets the bar for 1% rule.
- Cap rate 5.6% vs local median 3.2% in Mason — top-decile yield for the area; either an underpriced asset or a hidden risk that comps aren't pricing in. Stress-test before assuming the spread holds.
Location & tenants
- Location reads 85/100 on livability (#43 in OH, #590 nationally) — a professional / high-income tenant draw. Strengths: schools A+, crime A+, employment A+; Watch: health & safety C-, commute F.
- Mason City (suburban): math 81% / reading 81% proficiency, ranked #33 of 656 in OH (top 5%) — strong family-tenant draw, lease renewals of 3-5y typical; only 6% free/reduced lunch — higher-income household profile.
- Market conditions: Rents rising (+3.5%/yr); 139 active listings in the ZIP; 9 comparable units currently listed for rent nearby; rentals lingering (median 45d on market — plan ~5-8 weeks vacancy on turnover, expect pricing pressure); 56% of comp listings sitting > 30 days — soft ceiling on asking rent; high-income renter base; 1,224 units permitted in Warren County in 2024 (474 in 5+ unit buildings).
Forward outlook
- Local home prices are declining (-3.0%/yr); year-one equity from $3k of loan paydown is wiped out by about $13k of value loss. Plan a longer hold.
- Warren County population projected at +16% by 2050 — long-run rental-demand tailwind backs the buy-and-hold thesis.
Negotiation context
- Only 9 days on market — expect competitive offers; lowballing is unlikely to land.
- 5 sale attempts since 4y ago with the ask held roughly flat each time — persistent listings suggest the price (not the market) is what's stuck; bring a comps-based counter.
- Current owner paid $319k; 33% above their basis — modest negotiation headroom, anchor on the comps not their cost.
Questions for the listing agent
- What do current leases actually rent for vs. the listed asking? Can we see a recent rent roll and the last 12 months of T-12 income?
- Built in 1973 — when were the roof, HVAC, electrical panel, plumbing, and water heater last replaced?
- Is there a deadline driving the sale (1031 exchange, divorce, estate, relocation)? That informs how much negotiation room exists.
- Schools are A-rated — typically a magnet for longer-tenancy family renters. What's the average tenant stay here, and is there a school-zone premium baked into asking?
- The area grade is low — what's the realistic commute time and amenity access for the typical tenant pool here? Any planned neighborhood developments (good or bad) we should know about?
- What's the average days-on-market for RENTAL listings here right now (not sales)? A rising rental-DOM trend means longer vacancies and softer asking-rent achievability than the comps imply.
- What's the recent tenant-quality profile in this submarket — average credit score on applications, eviction rate, late-payment / NSF rate, and stable-employment percentage? A property-management company in the area should have these aggregated.
- How much new for-sale + rental construction is in the pipeline within 1–3 miles? Heavy new supply typically softens prices + rents 12–24 months out; constrained supply supports both.
Investment metrics
- 1% rule
- 0.75% ✗
- Cap rate
- 5.63%
- Cash-on-cash
- -2.37%
- DSCR
- 0.89
- GRM
- 11.2
CMA / ARV
- ARV (on-the-fly)
- $439,287
- Comps found
- 3
Show comp detail 3 sales within ~0.75 mi
| Address | Dist | Beds/Ba | Sqft | Sold | Price | $/sf | Match |
|---|---|---|---|---|---|---|---|
| 6955 Grand Oaks Ct | 0.48mi | 4/2.5 | 2,548 (+5%) | 8mo | $490,000 | $192 | 60 |
| 1424 Hillary Ln | 0.37mi | 4/2.5 | 2,184 (-10%) | 11mo | $395,000 | $181 | 55 |
| 962 Western Row Rd | 0.68mi | 3/2.0 (-1) | 2,128 (-12%) | 17mo | $333,000 | $156 | 29 |
Match score weights: distance 35% · size 25% · config 20% · recency 20%. Top-matched comps best support the ARV.
Projected returns pro-forma
-3.0% appreciation · 3.51% rent growth · sell at horizon
- IRR
- -19.7%
- Equity multiple
- 0.31×
- Total profit
- $-82,277
- Equity at exit
- $63,369
- IRR
- -11.7%
- Equity multiple
- 0.29×
- Total profit
- $-84,432
- Equity at exit
- $36,746
Cash invested: $119,000 (down + closing). Projections, not guarantees.
Landlord ↔ Tenant lean methodology
- Overall (STATE)
- 73 Landlord-Friendly
- State Ohio
- 73 Landlord-Friendly · R+6
- County
- — inherits STATE
- City
- — inherits STATE
ZIP-level market 45040
- Rents YoY
- 3.5%
- Active inventory
- 139
- Price-to-rent
- 11.2×
Monthly cashflow live
- Estimated rent
- $3,174 high interval (Pro) →
- Mortgage (P&I)
- −$2,229
- Tax from tax record
- −$336 /mo · $4,036/yr
- Insurance
- −$177
- HOA
- −$0
- Vacancy / Maint / Mgmt
- −$666
- Net cashflow
- $-235
Break-even live
Sensitivity live
| Price | -10% $5 | -5% $-115 | +0% $-235 | +5% $-355 | +10% $-476 |
|---|---|---|---|---|---|
| Rent | -10% $-486 | -5% $-360 | +0% $-235 | +5% $-110 | +10% $16 |
| Rate | -1.0pp $-21 | -0.5pp $-127 | base $-235 | +0.5pp $-345 | +1.0pp $-457 |
UW: 25.0% down · 7.5% · 30yr · 1.5% tax · 5.0% vac · 8.0% maint · 8.0% mgmt
Financing live
Cash to close
- Down payment
- $106,250
- Closing costs
- $12,750
- Reserves months
- —
- Total cash needed
- —
Loan-product check · same deal, 3 products live
Conventional
25% down · 7.5% · 30yr
- Down + closing
- —
- Monthly P&I
- —
- Monthly cashflow
- —
- DSCR
- —
- Eligible?
- —
Personal DTI + credit; lowest rate.
DSCR
20% down · 8.5% · 30yr
- Down + closing
- —
- Monthly P&I
- —
- Monthly cashflow
- —
- DSCR
- —
- Eligible?
- —
No personal income docs; deal must DSCR.
Hard money
10% down · 12.0% · 12mo
- Down + closing
- —
- Monthly P&I
- —
- Monthly cashflow
- —
- DSCR
- —
- Eligible?
- —
Short-term bridge; refi at stabilization.
Rent comps 9 comps
| Address | Beds | Baths | Sqft | Rent | $/sqft | DOM | Units | Dist |
|---|---|---|---|---|---|---|---|---|
| 1455 Baymeadows Dr Mason, OH | 4.0 | 2.5 | 2292 | $3,200 | $1.40 | 45d | 1 | 0.35mi |
| 6342 Coverage CT Mason, OH | 3.0 | 2.5 | 1676 | $3,250 | $1.94 | 45d | 1 | 0.74mi |
| 5646 Santa Fe Trl Mason, OH | 3.0 | 3.5 | 2808 | $3,495 | $1.24 | 13d | 1 | 1.22mi |
| 7763 Hunters Trl Mason, OH | 4.0 | 2.5 | 2802 | $3,495 | $1.25 | 45d | 1 | 1.24mi |
| 6173 Greenbrier Gln Mason, OH | 4.0 | 3.5 | 2608 | $3,400 | $1.30 | 25d | 1 | 1.24mi |
| 5920 Thornberry Ct Mason, OH | 4.0 | 3.5 | 3200 | $3,698 | $1.16 | 5d | 1 | 1.33mi |
| 5707 Villas Creek Dr Mason, OH | 4.0 | 2.5 | 2070 | $2,981 | $1.44 | 45d | 1 | 1.35mi |
| 6370 Sherman Terrace Dr Mason, OH | 4.0 | 2.5 | 2542 | $2,531 | $1.00 | 8d | 1 | 1.40mi |
| 6907 Keeneland Way Mason, OH | 4.0 | 2.5 | 3086 | $3,650 | $1.18 | 45d | 1 | 1.48mi |
Listing history 7 events
-
2026-06-21days on market $425,000 Active 9 DOM
-
2026-06-18days on market $425,000 Active 6 DOM
-
2026-06-17days on market $425,000 Active 5 DOM
-
2026-06-16days on market $425,000 Active 4 DOM
-
2026-06-15days on market $425,000 Active 3 DOM
-
2026-06-13remarks 699-char remark
-
2026-06-13$425,000 Active 1 DOM
ⓘ Source: listings_history table (triggers on properties + properties_extension) + one-shot
backfill from property_details.listing_events for pre-trigger history.
Tax reassessment forecast OH · Partial reset (capped growth)
- Current annual tax
- $4,036 · $336/mo
- Projected year-2 tax
- $5,333 · $444/mo
- Expected delta
- +$1,297/yr (+$108/mo · 32.1%)
ⓘ Screening estimate from a state-policy table — verify with the county assessor before closing.
Climate risk First Street
- Flood 4/10 Moderate FEMA zone X (unshaded) · 22% chance over 30 yrs
- Wildfire 1/10 Low
- Heat 4/10 Moderate 7 d/yr ≥101°F today · 19 d/yr by 30 yrs out
- Wind 2/10 Low 100% chance of damaging wind over 30 yrs
- Air quality 4/10 Moderate 5 unhealthy d/yr today · 7 by 30 yrs out
Nearby sold comps map
Loading sold comps map…
Walkable amenities ~0.75 mi
Loading nearby amenities…
Taxation est. · year 1
- Rental income
- $38,082
- − Mortgage interest
- −$23,807
- − Property taxes
- −$4,036
- − Insurance
- −$2,125
- − Repairs & maintenance
- −$3,047
- − Management
- −$3,047
- − Depreciation
- −$12,364
- Taxable loss
- −$10,342
- Est. tax savings @ 24.0%
- +$2,482
- After-tax cash flow
- $-339/yr
For passive investors: Depreciation is non-cash, so a rental often shows a tax loss while cash-flowing — sheltering income. Rental losses are passive: they offset passive income freely, and up to $25,000/yr can offset ordinary (W-2) income if you actively participate and your MAGI is under $100k (phasing out to $0 by $150k); unused losses carry forward. On sale, claimed depreciation is recaptured at up to 25%, and gains may owe capital-gains tax (a 1031 exchange can defer both). Figures are a year-1 estimate at your 24.0% rate — not tax advice; consult a CPA.
Schools (NCES district)
- District
- Mason City
- NCES district ID
- 3905045
- Math proficiency
- 81% ▼ -8.00%
- Reading proficiency
- 81% ▼ -5.00%
- Median HH income
- $91,430
- Composite
- 72.46/100
- National rank
- #200
- State rank
- #33 of 656 in OH
Livability — Mason
- Score
- 85/100
- State rank
- #43
- US rank
- #590
Category grades
Schools grade is shown separately in the Schools card above.
Census & demographics
- Census place
- Mason, OH
- County
- Warren County · 196,906 people
- City population
- 59,518
- Metro
- Cincinnati, OH-KY-IN
- Population (ZIP)
- 59,518
- Household income
- $133,240
- Rent vs Own
- Severe rent burden
- 562.0
Population outlook (Warren County) Hauer SSP2
- Today (2025)
- 248,603 people
- By 2030
- 259,345 · +4.3%
- By 2040
- 277,666 · +11.7%
- By 2050
- 289,599 · +16.5%
- By 2075
- 311,681 · +25.4%
- By 2100
- 302,738 · +21.8%
Race, ethnicity, and origin ACS 2023
- Neighborhood character
- Predominantly White (70%)
- Race & ethnicity
- White 70% Asian 19% Two or more races 6% Black 4% Hispanic / Latino 3%
- Common ancestry
- Romanian 2% Slovak 2% Lithuanian 1%
- Foreign-born
- 20% · China, Canada, Vietnam
- Languages at home
- 77% English-only · Other Asian/Pacific 6% Other Indo-European 6% Chinese 4%
Political lean MEDSL · Warren
- 2024 margin
- Solid R (+31.5) · D 33.8% · R 65.3%
- 2008→2024 swing
- +4.5pp toward D · 2008: -36.1pp · 2024: -31.5pp
- All cycles
- 2024: R+31.5 2020: R+30.8 2016: R+37.6 2012: R+39.5 2008: R+36.1
Not yet ingested
- Civics
- —
Market trends
- HPI YoY
- ▼ -210.08%
- Current HPI
- 234.0754
- Rent YoY
- ▲ 3.51%
- Metro
- Cincinnati, OH-KY-IN
- State GDP YoY
- ▲ 1.98%
- F500 in state
- 48
Industry mix (Fortune 500 HQ in OH)
| Industry | F500 HQs | Revenue |
|---|---|---|
| Insurance | 3 | $145B |
|
||
| Industrial Machinery | 3 | $49B |
|
||
| Financial Services | 3 | $24B |
|
||
| Consumer Goods | 2 | $93B |
|
||
| Aerospace / Defense | 2 | $47B |
|
||
| Utilities | 2 | $33B |
|
||
Price history
+679.8% since first listed15 events — show timeline
- 2026-06-12 Relisted — Cincy MLS
- 2026-06-12 Listed $425,000 Cincy MLS
- 2026-06-12 Listing Removed — Cincy MLS
- 2026-05-14 Listing Removed — Cincy MLS
- 2026-04-22 Contingent — Cincy MLS
- 2026-04-16 Listed $425,000 Cincy MLS
- 2025-11-18 Listing Removed — Cincy MLS
- 2025-09-03 Listed $399,000 Cincy MLS
- 2022-06-28 Sold (Public Records) $318,780 Public Records
- 2022-06-21 Sold (MLS) $316,780 Cincy MLS
- 2022-05-06 Contingent — Cincy MLS
- 2022-04-29 Listed $295,000 Cincy MLS
- 1988-08-29 Sold (Public Records) $69,000 Public Records
- 1987-12-14 Sold (Public Records) $66,900 Public Records
- 1985-08-22 Sold (Public Records) $54,500 Public Records
Property tax history
+2.9%/yrLatest (2025): $4,036 · -0.5% YoY. Source: county tax records.
Cash-flow waterfall
monthlySold comps — $/sqft
last 12 mo · ≤1 miLoading sold comps…