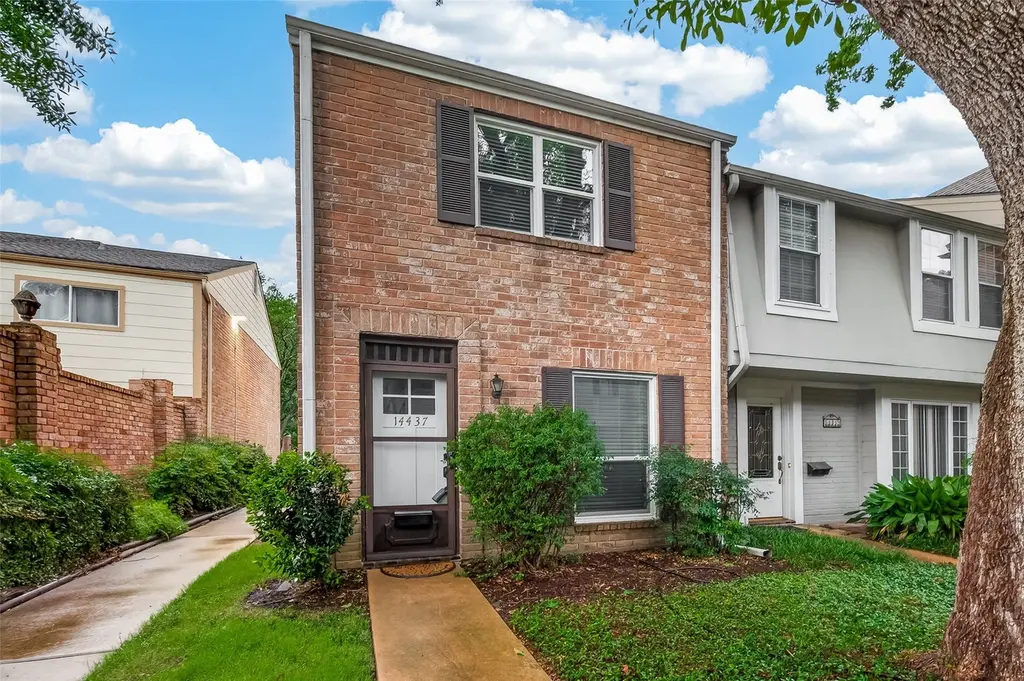
14437 Still Meadow Dr S · Houston, TX
Flood risk 1/10 · Minimal
- FEMA flood zone
- X (unshaded)
- Chance of flooding over 30 yrs
- 0.0%
- Est. flood insurance / yr
- $507 – $1,088
Fire risk 4/10 · Minor
- Est. fire insurance / yr
- $1,222 – $2,270
Heat risk 9/10 · Severe
- Hot days now (above 110°F)
- 7 days/yr
- Hot days in 30 yrs
- 24 days/yr
Wind risk 9/10 · Severe
- Chance of severe wind over 30 yrs
- 99.0%
Air-quality risk 3/10 · Minor
- Unhealthy air days now
- 2 days/yr
- Unhealthy air days in 30 yrs
- 3 days/yr
Risk factors via First Street. Map © Google.
Why this score? — see what drove the D grade
The composite is a weighted blend of 9 inputs, each scored 0–100. Each bar is that input's sub-score; the figure is the points it added to the 100-point composite (weight × sub-score).
- Cash flow +13.9/30.0
- ARV discount +7.5/15.0
- 1% rule +4.6/10.0
- DSCR +4.2/10.0
- Schools +4.1/10.0
- Livability +3.7/5.0
- Condition / age +2.5/5.0
- Rent growth +2.3/5.0
- Appreciation +0.0/10.0
$173,000
🖨 Deal sheet (PDF) 📄 Offer letter ✓ Due diligence
Listing remarks
This home is freshly painted throughout entire interior including ceilings. New Pella windows with Pella Patio door Waranty transferable to New Home Owners. New carpet on the stairway. Club House is connected to Extra Large Pool Secured with Gates, 9 Tennis Courts and 2 Satelite Pools Courtyards with Mature Landscaping and Beautiful Grounds for walking with your Pets. Friendly Neighborhood with convenient routes to eateries, restaurants at every level and most Important easy access to the I-10 Freeway near the Energy Corridor.
Key facts
- 9 tennis courts
- Extra large pool
- 2 satellite pools
Tags
Property features AI
Finance
- Other: Private in-ground pool (association); Ownership: Full ownership
- HOA & community: Memorial Club Townhouse Association; Community features include clubhouse, community pool, tennis courts, playground, park, picnic area, meeting/party room, gated entry, trash service, and maintained grounds; Association dues cover clubhouse, common areas, grounds maintenance and recreation facilities
Exterior
- Parking: Attached carport; 2-car garage spaces; 2-car carport; Driveway; Additional parking
- Security: Smoke detector(s)
- Utilities: Public water; Public sewer
- Home design: Residential property; Faces east; Slab foundation; Built in 1973
- Construction: Brick construction; Composition roof
- Exterior features: Deck; Patio; Fence (partial); Storage shed(s); Tennis court(s); Subdivision setting; Concrete road surface
Interior
- Kitchen: Convection oven; Electric oven; Electric range; Dishwasher; Disposal; Microwave; Refrigerator; Pantry; Breakfast nook (8 x 12)
- Bedrooms: Primary bedroom (Second level) — 12 x 14; Bedroom (Second level) — 2 x 12
- Flooring: Laminate; Tile
- Bathrooms: 2 full bathrooms; 1 half bathroom
- Heating & cooling: Central heating (Electric and Gas); Central air conditioning; Programmable thermostat
- Interior features: Breakfast bar; Primary bathroom; Pantry; Tub with shower; Window treatments; Ceiling fans; Kitchen/dining combo; Living/dining room; Programmable thermostat; Washer hookup and electric dryer hookup; Convection oven, Electric oven, Electric range, Dishwasher, Disposal, Microwave, Refrigerator
- Laundry & utility: Washer hookup; Electric dryer hookup
Neighborhood map
What this means for you Summary
Snapshot
- This is a 2-bed/2.0-bath single-family listed at $173k.
Deal economics
- At list price, monthly cash flow is $18 ($217/yr) — positive.
- The deal already cash-flows at list — no discount required.
- To meet the 1% rule (rent ≥ 1% of price), the offer needs to be $166k (4.0% below list).
- Recommended offer: $166k (4.0% below list) — sets the bar for 1% rule.
- Cap rate 6.4% vs local median 3.2% in Houston — top-decile yield for the area; either an underpriced asset or a hidden risk that comps aren't pricing in. Stress-test before assuming the spread holds.
Location & tenants
- Location reads 74/100 on livability (#184 in TX, #4,771 nationally) — a middle-class / working-renter tenant base. Strengths: amenities A+, cost of living A+, housing A+; Watch: crime F.
- Spring Branch ISD (urban): math 47% / reading 46% proficiency, ranked #215 of 826 in TX (top 26%) — families likely to look elsewhere, expect single-tenant / working-renter base with shorter leases.
- Zoned schools: Thornwood El (math 27% / reading 27%, grade F, #2,791 of 4,322 statewide, top 68%, 408 students, 88% FRL); Spring Forest Middle (math 39% / reading 44%, grade F, #595 of 1,662 statewide, top 37%, 962 students, 56% FRL); Stratford H S (math 52% / reading 59%, grade C, #364 of 1,632 statewide, top 23%, 2,272 students, 33% FRL) — zoned schools at 59% FRL track the district average.
- Market conditions: Rents soft (-0.8%/yr); 243 active listings in the ZIP; 40 comparable units currently listed for rent nearby; rentals at typical pace (median 20d on market — plan ~3-4 weeks tenant-placement turnaround); solid renter incomes; 29,883 units permitted in Harris County in 2024 (8,621 in 5+ unit buildings).
Forward outlook
- Local home prices are declining (-3.0%/yr); year-one equity from $1k of loan paydown is wiped out by about $5k of value loss. Plan a longer hold.
- Harris County population projected at +47% by 2050 — long-run rental-demand tailwind backs the buy-and-hold thesis.
Negotiation context
- It's been on market 18 days — a 2% lower offer ($170k) is reasonable based on typical stale-listing flexibility.
Risks & watch-outs
- Climate carrying-cost: severe wind risk, 99% chance of damaging wind over 30y; extreme-heat days projected 7→24/yr by 2055 (HVAC capex compounding) — expect insurance premiums to compound above CPI over the hold.
Questions for the listing agent
- Built in 1973 — when were the roof, HVAC, electrical panel, plumbing, and water heater last replaced?
- Is there a deadline driving the sale (1031 exchange, divorce, estate, relocation)? That informs how much negotiation room exists.
- Schools are D-rated, which usually means shorter tenancies and higher turnover. Who's the typical renter profile here, and what's been the actual vacancy rate?
- Crime grade is F in this area — have there been break-ins, vandalism, or insurance claims at this property in the last 3 years? What carrier currently insures it and at what premium?
- The area grade is low — what's the realistic commute time and amenity access for the typical tenant pool here? Any planned neighborhood developments (good or bad) we should know about?
- What's the average days-on-market for RENTAL listings here right now (not sales)? A rising rental-DOM trend means longer vacancies and softer asking-rent achievability than the comps imply.
- What's the recent tenant-quality profile in this submarket — average credit score on applications, eviction rate, late-payment / NSF rate, and stable-employment percentage? A property-management company in the area should have these aggregated.
- How much new for-sale + rental construction is in the pipeline within 1–3 miles? Heavy new supply typically softens prices + rents 12–24 months out; constrained supply supports both.
Investment metrics
- 1% rule
- 0.96% ✗
- Cap rate
- 6.42%
- Cash-on-cash
- 0.45%
- DSCR
- 1.02
- GRM
- 8.7
CMA / ARV
No comps found within radius.
Projected returns pro-forma
-3.0% appreciation · 0.0% rent growth · sell at horizon
- IRR
- -19.2%
- Equity multiple
- 0.35×
- Total profit
- $-31,662
- Equity at exit
- $25,795
- IRR
- -20.6%
- Equity multiple
- 0.08×
- Total profit
- $-44,547
- Equity at exit
- $14,958
Cash invested: $48,440 (down + closing). Projections, not guarantees.
Landlord ↔ Tenant lean methodology
- Overall (STATE)
- 87 Strongly Landlord-Friendly
- State Texas
- 87 Strongly Landlord-Friendly · R+5
- County
- — inherits STATE
- City
- — inherits STATE
ZIP-level market 77079
- Rents YoY
- -0.8%
- Active inventory
- 243
- Price-to-rent
- 8.7×
Monthly cashflow live
- Estimated rent
- $1,661 high interval (Pro) →
- Mortgage (P&I)
- −$907
- Tax from tax record
- −$314 /mo · $3,773/yr
- Insurance
- −$72
- HOA
- −$0
- Vacancy / Maint / Mgmt
- −$349
- Net cashflow
- $18
Break-even live
Sensitivity live
| Price | -10% $116 | -5% $67 | +0% $18 | +5% $-31 | +10% $-80 |
|---|---|---|---|---|---|
| Rent | -10% $-113 | -5% $-47 | +0% $18 | +5% $84 | +10% $149 |
| Rate | -1.0pp $105 | -0.5pp $62 | base $18 | +0.5pp $-27 | +1.0pp $-72 |
UW: 25.0% down · 7.5% · 30yr · 1.5% tax · 5.0% vac · 8.0% maint · 8.0% mgmt
Financing live
Cash to close
- Down payment
- $43,250
- Closing costs
- $5,190
- Reserves months
- —
- Total cash needed
- —
Loan-product check · same deal, 3 products live
Conventional
25% down · 7.5% · 30yr
- Down + closing
- —
- Monthly P&I
- —
- Monthly cashflow
- —
- DSCR
- —
- Eligible?
- —
Personal DTI + credit; lowest rate.
DSCR
20% down · 8.5% · 30yr
- Down + closing
- —
- Monthly P&I
- —
- Monthly cashflow
- —
- DSCR
- —
- Eligible?
- —
No personal income docs; deal must DSCR.
Hard money
10% down · 12.0% · 12mo
- Down + closing
- —
- Monthly P&I
- —
- Monthly cashflow
- —
- DSCR
- —
- Eligible?
- —
Short-term bridge; refi at stabilization.
Rent comps 40 comps
| Address | Beds | Baths | Sqft | Rent | $/sqft | DOM | Units | Dist |
|---|---|---|---|---|---|---|---|---|
| 14553 Still Meadow Dr Houston, TX | 2.0 | 2.5 | 1264 | $1,900 | $1.50 | 20d | 1 | 0.05mi |
| 898 Threadneedle St Houston, TX | 2.0 | 2.0 | 1194 | $1,933 | $1.62 | 20d | 1 | 0.50mi |
| 801 Country Place Dr Unit 858 Houston, TX | 2.0 | 2.0 | 975 | $1,324 | $1.36 | 12d | 1 | 0.51mi |
| 801 Country Place Dr Unit 834 Houston, TX | 3.0 | 2.0 | 1161 | $1,554 | $1.34 | 12d | 1 | 0.51mi |
| 801 Country Place Dr Unit 525 Houston, TX | 3.0 | 2.0 | 1161 | $1,514 | $1.30 | 0d | 1 | 0.51mi |
| 801 Country Place Dr Unit 2162 Houston, TX | 2.0 | 2.0 | 975 | $1,300 | $1.33 | 7d | 1 | 0.51mi |
| 801 Country Place Dr Unit 2148 Houston, TX | 2.0 | 2.0 | 975 | $1,325 | $1.36 | 0d | 1 | 0.51mi |
| 801 Country Place Dr Unit 2047 Houston, TX | 2.0 | 2.0 | 975 | $1,335 | $1.37 | 13d | 1 | 0.51mi |
| 801 Country Place Dr Unit 3047 Houston, TX | 3.0 | 2.0 | 1161 | $1,565 | $1.35 | 13d | 1 | 0.51mi |
| 801 Country Place Dr Unit 2165 Houston, TX | 2.0 | 2.0 | 975 | $1,284 | $1.32 | 0d | 1 | 0.51mi |
| 857 Threadneedle St Houston, TX | 2.0 | 2.0 | 961 | $1,470 | $1.53 | 26d | 1 | 0.53mi |
| 851 Threadneedle St Apt 1206 Houston, TX | 2.0 | 2.0 | 967 | $1,417 | $1.47 | 26d | 1 | 0.65mi |
| 851 Threadneedle St Apt 509 Houston, TX | 2.0 | 2.0 | 961 | $1,390 | $1.45 | 26d | 1 | 0.65mi |
| 851 Threadneedle St Apt 1206 Houston, TX | 2.0 | 2.0 | 967 | $1,417 | $1.47 | 45d | 1 | 0.65mi |
| 14401 Mackilsee Ln Houston, TX | 2.0 | 2.0 | 1081 | $2,121 | $1.96 | 13d | 1 | 0.74mi |
| 777 Bateswood Dr Houston, TX | 2.0 | 1.5–2.0 | 1488 | $1,459 | $0.98 | 7d | 4 | 0.76mi |
| 14759 Perthshire Rd Houston, TX | 2.0 | 1.0 | 1272 | $1,925 | $1.51 | 26d | 1 | 0.76mi |
| 14814 Perthshire Rd Houston, TX | 2.0–4.0 | 1.0–2.5 | 1381 | $1,250 | $0.90 | 0d | 79 | 0.82mi |
| 11601 Katy Fwy Unit 227 Houston, TX | 2.0 | 2.0 | 1053 | $1,200 | $1.14 | 20d | 1 | 0.84mi |
| 11601 Katy Fwy Unit 507 Houston, TX | 2.0 | 2.0 | 1148 | $1,250 | $1.09 | 45d | 1 | 0.84mi |
| 11601 Katy Fwy Unit 406 Houston, TX | 2.0 | 2.0 | 1079 | $1,200 | $1.11 | 45d | 1 | 0.84mi |
| 11601 Katy Fwy Unit 131 Houston, TX | 2.0 | 1.0 | 911 | $1,100 | $1.21 | 45d | 1 | 0.84mi |
| 738 Bateswood Dr Houston, TX | 1.0–3.0 | 1.0–2.0 | 1010 | $1,179 | $1.17 | 22d | 12 | 0.88mi |
| 14800 Memorial Dr Houston, TX | 1.0–3.0 | 1.5–3.0 | 1368 | $3,038 | $2.22 | 12d | 21 | 0.90mi |
| 14800 Memorial Dr Houston, TX | 1.0–3.0 | 1.5–3.0 | 1371 | $2,945 | $2.15 | 0d | 12 | 0.90mi |
| 13800 Myrtlea Dr Houston, TX | 2.0 | 2.0 | 1075 | $1,355 | $1.26 | 13d | 1 | 0.91mi |
| 681 Dairy Ashford Rd Houston, TX | 3.0 | 2.0 | 1492 | $1,886 | $1.26 | 45d | 1 | 0.91mi |
| 681 Dairy Ashford Rd Houston, TX | 3.0 | 2.0 | 1492 | $1,886 | $1.26 | 24d | 1 | 0.91mi |
| 14806 Memorial Dr Houston, TX | 3.0 | 3.0 | 1565 | $2,750 | $1.76 | 45d | 1 | 0.95mi |
| 881 N Eldridge Pkwy Houston, TX | 3.0 | 3.0 | 1766 | $2,483 | $1.41 | 45d | 1 | 1.00mi |
| 881 N Eldridge Pkwy Houston, TX | 3.0 | 3.0 | 1766 | $2,483 | $1.41 | 22d | 1 | 1.00mi |
| 14900 Memorial Dr Apt 424 Houston, TX | 2.0 | 2.0 | 1097 | $1,840 | $1.68 | 7d | 1 | 1.01mi |
| 14900 Memorial Dr Unit 2174 Houston, TX | 2.0 | 2.0 | 1097 | $1,864 | $1.70 | 12d | 1 | 1.01mi |
| 14900 Memorial Dr Unit 14937 Houston, TX | 2.0 | 2.0 | 1097 | $1,914 | $1.74 | 45d | 1 | 1.01mi |
| 14900 Memorial Dr Apt 425 Houston, TX | 2.0 | 2.0 | 1097 | $1,824 | $1.66 | 0d | 1 | 1.01mi |
| 611 N Dairy Ashford Rd Houston, TX | 1.0–3.0 | 1.0–2.0 | 988 | $1,854 | $1.88 | 0d | 17 | 1.02mi |
| 14906 Memorial Dr Houston, TX | 2.0 | 2.0 | 1129 | $1,669 | $1.48 | 45d | 1 | 1.03mi |
| 14861 Memorial Dr Houston, TX | 2.0 | 2.0 | 1100 | $1,579 | $1.44 | 45d | 1 | 1.04mi |
| 14855 Memorial Dr Houston, TX | 1.0–2.0 | 1.0–2.0 | 1098 | $1,996 | $1.82 | 0d | 29 | 1.05mi |
| 600 Nottingham Oaks Trl Houston, TX | 1.0–2.0 | 1.0–2.0 | 883 | $1,325 | $1.50 | 0d | 13 | 1.07mi |
Listing history 11 events
-
2026-06-21days on market $173,000 Active 18 DOM
-
2026-06-18days on market $173,000 Active 15 DOM
-
2026-06-17days on market $173,000 Active 14 DOM
-
2026-06-16days on market $173,000 Active 13 DOM
-
2026-06-15days on market $173,000 Active 12 DOM
-
2026-06-13days on market $173,000 Active 10 DOM
-
2026-06-09days on market $173,000 Active 6 DOM
-
2026-06-08days on market $173,000 Active 5 DOM
-
2026-06-07days on market $173,000 Active 4 DOM
-
2026-06-04remarks 533-char remark
-
2026-06-04$173,000 Active 1 DOM
ⓘ Source: listings_history table (triggers on properties + properties_extension) + one-shot
backfill from property_details.listing_events for pre-trigger history.
Tax reassessment forecast TX · Resets to sale price
- Current annual tax
- $3,773 · $314/mo
- Projected year-2 tax
- $3,773 · $314/mo
- Expected delta
- $0/yr ($0/mo · 0.0%)
ⓘ Screening estimate from a state-policy table — verify with the county assessor before closing.
Climate risk First Street
- Flood 1/10 Low FEMA zone X (unshaded) · 0% chance over 30 yrs
- Wildfire 4/10 Moderate
- Heat 9/10 Extreme 7 d/yr ≥110°F today · 24 d/yr by 30 yrs out
- Wind 9/10 Extreme 99% chance of damaging wind over 30 yrs
- Air quality 3/10 Moderate 2 unhealthy d/yr today · 3 by 30 yrs out
Nearby sold comps map
Loading sold comps map…
Walkable amenities ~0.75 mi
Loading nearby amenities…
Taxation est. · year 1
- Rental income
- $19,927
- − Mortgage interest
- −$9,691
- − Property taxes
- −$3,773
- − Insurance
- −$865
- − Repairs & maintenance
- −$1,594
- − Management
- −$1,594
- − Depreciation
- −$5,033
- Taxable loss
- −$2,623
- Est. tax savings @ 24.0%
- +$630
- After-tax cash flow
- $847/yr
For passive investors: Depreciation is non-cash, so a rental often shows a tax loss while cash-flowing — sheltering income. Rental losses are passive: they offset passive income freely, and up to $25,000/yr can offset ordinary (W-2) income if you actively participate and your MAGI is under $100k (phasing out to $0 by $150k); unused losses carry forward. On sale, claimed depreciation is recaptured at up to 25%, and gains may owe capital-gains tax (a 1031 exchange can defer both). Figures are a year-1 estimate at your 24.0% rate — not tax advice; consult a CPA.
Schools (NCES district)
- District
- Spring Branch ISD
- NCES district ID
- 4841100
- Math proficiency
- 47% ▼ -4.00%
- Reading proficiency
- 46% ▼ -1.00%
- Median HH income
- $60,311
- Composite
- 40.88/100
- National rank
- #3624
- State rank
- #215 of 826 in TX
Livability — Houston
- Score
- 74/100
- State rank
- #184
- US rank
- #4771
Category grades
Schools grade is shown separately in the Schools card above.
Census & demographics
- Census place
- Houston, TX
- County
- Harris County · 4,702,590 people
- City population
- 3,226,434
- Metro
- Houston-The Woodlands-Sugar Land, TX
- Population (ZIP)
- 37,276
- Household income
- $101,995
- Rent vs Own
- Severe rent burden
- 1811.0
Population outlook (Harris County) Hauer SSP2
- Today (2025)
- 5,571,493 people
- By 2030
- 6,089,821 · +9.3%
- By 2040
- 7,142,806 · +28.2%
- By 2050
- 8,185,864 · +46.9%
- By 2075
- 10,574,329 · +89.8%
- By 2100
- 12,109,958 · +117.4%
Race, ethnicity, and origin ACS 2023
- Neighborhood character
- Diverse neighborhood (Simpson 0.64)
- Race & ethnicity
- White 55% Hispanic / Latino 20% Two or more races 15% Black 13% Asian 8%
- Hispanic origin (detail)
- Mexican 10% Cuban 1%
- Common ancestry
- Lithuanian 4% Slovak 2% Italian 2%
- Foreign-born
- 25% · Canada, Jamaica, China
- Languages at home
- 69% English-only · Spanish 15% Other Indo-European 5% Chinese 2%
Political lean MEDSL · Harris
- 2024 margin
- Lean D (+5.5) · D 52.0% · R 46.4% · Other 1.6%
- 2008→2024 swing
- +3.9pp toward D · 2008: 1.6pp · 2024: 5.5pp
- All cycles
- 2024: D+5.5 2020: D+13.3 2016: D+12.4 2012: D+0.1 2008: D+1.6
Not yet ingested
- Civics
- —
Market trends
- HPI YoY
- ▼ -316.55%
- Current HPI
- 286.7958
- Rent YoY
- ▼ -0.80%
- Metro
- Houston-The Woodlands-Sugar Land, TX
- State GDP YoY
- ▲ 3.95%
- F500 in state
- 110
Industry mix (Fortune 500 HQ in TX)
| Industry | F500 HQs | Revenue |
|---|---|---|
| Energy | 16 | $1,198B |
|
||
| Technology | 5 | $198B |
|
||
| Engineering / Construction | 4 | $72B |
|
||
| Energy Services | 3 | $60B |
|
||
| Utilities | 3 | $41B |
|
||
| Healthcare | 2 | $330B |
|
||
Price history
2 events — show timeline
- 2026-06-03 Listed $173,000 HARMLS
- 1988-01-02 Sold (Public Records) — Public Records
Property tax history
+6.5%/yrLatest (2025): $3,773 · -7.7% YoY. Source: county tax records.
Cash-flow waterfall
monthlySold comps — $/sqft
last 12 mo · ≤1 miLoading sold comps…