2110 Leight St · Beaumont, TX
Flood risk 6/10 · Moderate
- FEMA flood zone
- X
- Chance of flooding over 30 yrs
- 0.74%
- Est. flood insurance / yr
- $507 – $1,088
Fire risk 1/10 · Minimal
- Est. fire insurance / yr
- $1,222 – $2,270
Heat risk 9/10 · Severe
- Hot days now (above 109°F)
- 7 days/yr
- Hot days in 30 yrs
- 24 days/yr
Wind risk 9/10 · Severe
- Chance of severe wind over 30 yrs
- 99.0%
Air-quality risk 2/10 · Minimal
- Unhealthy air days now
- 1 days/yr
- Unhealthy air days in 30 yrs
- 1 days/yr
Risk factors via First Street. Map © Google.
Why this score? — see what drove the B grade
The composite is a weighted blend of 9 inputs, each scored 0–100. Each bar is that input's sub-score; the figure is the points it added to the 100-point composite (weight × sub-score).
- Cash flow +28.9/30.0
- DSCR +10.0/10.0
- 1% rule +8.2/10.0
- Appreciation +7.7/10.0
- ARV discount +6.6/15.0
- Livability +3.2/5.0
- Rent growth +2.5/5.0
- Condition / age +2.5/5.0
- Schools +1.5/10.0
$99,000
🖨 Deal sheet 📄 Offer letter ✓ Due diligence
Listing remarks MLS
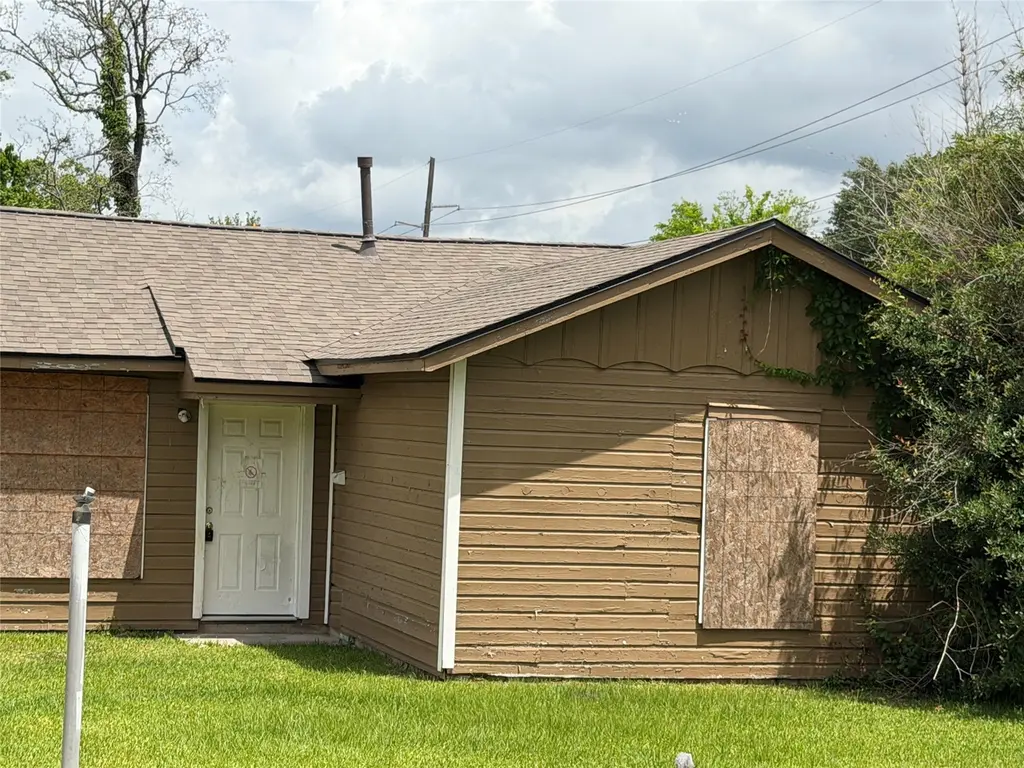
GOOD LOCATION! 2110 Leight St needs some repairs but has lots of potential. It has three bedrooms, one bathroom, and 1,278 square feet of space, this residence provides ample room for comfortable living. Situated on a large 9,520 square foot lot, the property boasts a spacious backyard, perfect for outdoor activities and entertaining. Inside, the home features vinyl plank flooring, providing durability and easy maintenance. The family room is bright and inviting, thanks to its large windows that flood the space with natural light. Whether you're relaxing indoors or enjoying the outdoor space, this home offers a cozy and welcoming atmosphere for you and your loved ones. Easy access I-10 and is near restaurant, supermarkets, and local shops in the Beaumont area. WE MAKE IT EASY TO OWN. This is a great opportunity! Don't wait, call us today to get more information on the owner's easy terms and smooth process that mat be able to put the deed in your name and make this your dream home.
Key facts
- Large windows
- Easy access i-10
- Near supermarkets
Tags
Neighborhood map
What this means for you Summary
Snapshot
- This is a 3-bed/1.0-bath single-family listed at $99k.
Deal economics
- At list price, monthly cash flow is $335 ($4k/yr) — positive.
- The deal already cash-flows at list — no discount required.
- Meets the 1% rule at list price ($1k rent vs $99k).
- Recommended offer: $87k (12.0% below list) — sets the bar for market timing.
- Cap rate 10.4% vs local median 5.3% in Beaumont — top-decile yield for the area; either an underpriced asset or a hidden risk that comps aren't pricing in. Stress-test before assuming the spread holds.
Location & tenants
- Location reads 64/100 on livability (#739 in TX) — a middle-class / working-renter tenant base. Strengths: cost of living A+, housing A+, health & safety A+; Watch: employment D, schools D-, crime F.
- Beaumont ISD (urban): math 14% / reading 22% proficiency, ranked #789 of 826 in TX (top 96%) — low school quality limits family demand, transient renter base, plan for 1-2y turnover; 69% free/reduced lunch — lower-income household profile, screen leases tightly.
- Market conditions: 79 active listings in the ZIP; 17 comparable units currently listed for rent nearby; rentals at typical pace (median 24d on market — plan ~3-4 weeks tenant-placement turnaround); lower-income renter base — watch delinquency; 343 units permitted in Jefferson County in 2024 (0 in 5+ unit buildings).
- At $1,305/mo this rent would consume 49% of the median local household income ($32k/yr) (locally 657% of renters already pay >50% of income on rent) — very limited rent-growth headroom before tenants either downsize or default.
Forward outlook
- In year one you build about $6k of equity ($684 loan paydown + $5k appreciation (5.4% local appreciation)).
- At projected returns (5.4% appreciation + 3.0% rent growth), your $28k cash investment doubles in ~3 years — after that, you're playing with house money.
- By year 6, paydown + projected appreciation supports a ~$33k cash-out refi (75% LTV) — recoverable capital for the next deal without selling this one.
Negotiation context
- It's been on market 377 days — a 12% lower offer ($87k) is reasonable based on typical stale-listing flexibility.
- 2 sale attempts since 4y ago; this cycle's ask has dropped $16k (14%) from the opening price — seller is motivated, your offer sets the floor, not the list.
Risks & watch-outs
- Climate carrying-cost: major flood risk; severe wind risk, 99% chance of damaging wind over 30y; extreme-heat days projected 7→24/yr by 2055 (HVAC capex compounding) — expect insurance premiums to compound above CPI over the hold.
Questions for the listing agent
- It's been on market 377 days. Have you received any prior offers? Is the seller open to a 12% concession, seller financing, or rate buy-down credit?
- Built in 1962 — when were the roof, HVAC, electrical panel, plumbing, and water heater last replaced?
- Why hasn't it sold? Are there any deal-killer items the seller is aware of (foundation, flood, title, zoning, code violations)?
- Is there a deadline driving the sale (1031 exchange, divorce, estate, relocation)? That informs how much negotiation room exists.
- Schools are D-rated, which usually means shorter tenancies and higher turnover. Who's the typical renter profile here, and what's been the actual vacancy rate?
- Crime grade is F in this area — have there been break-ins, vandalism, or insurance claims at this property in the last 3 years? What carrier currently insures it and at what premium?
- What's the average days-on-market for RENTAL listings here right now (not sales)? A rising rental-DOM trend means longer vacancies and softer asking-rent achievability than the comps imply.
- What's the recent tenant-quality profile in this submarket — average credit score on applications, eviction rate, late-payment / NSF rate, and stable-employment percentage? A property-management company in the area should have these aggregated.
- How much new for-sale + rental construction is in the pipeline within 1–3 miles? Heavy new supply typically softens prices + rents 12–24 months out; constrained supply supports both.
Investment metrics
- 1% rule
- 1.32% ✓
- Cap rate
- 10.35%
- Cash-on-cash
- 14.50%
- DSCR
- 1.65
- GRM
- 6.3
CMA / ARV
- ARV (median comp)
- $97,102
- List price
- $99,000
- Delta
- 1.95%
- Verdict
- FAIR
- Comps
- 20 within 1.0 mi
Show comp detail 6 sales within ~0.75 mi
| Address | Dist | Beds/Ba | Sqft | Sold | Price | $/sf | Match |
|---|---|---|---|---|---|---|---|
| 2125 Gill St | 0.27mi | 3/2.0 | 1,344 (+5%) | 1mo | $65,000 | $48 | 74 |
| 3565 West Ave | 0.35mi | 2/2.0 (-1) | 1,293 (+1%) | 3mo | $116,995 | $90 | 70 |
| 2255 Earl St | 0.19mi | 3/2.0 | 1,240 (-3%) | 20mo | $155,000 | $125 | 66 |
| 2490 Overbrook Ln | 0.30mi | 2/1.0 (-1) | 1,170 (-8%) | 9mo | $79,000 | $68 | 59 |
| 1728 Glasshouse St | 0.59mi | 3/1.0 | 1,293 (+1%) | 15mo | $55,000 | $43 | 58 |
| 2360 Tyler St | 0.69mi | 2/1.0 (-1) | 1,308 (+2%) | 19mo | $69,900 | $53 | 43 |
Match score weights: distance 35% · size 25% · config 20% · recency 20%. Top-matched comps best support the ARV.
Projected returns pro-forma
5.43% appreciation · 3.0% rent growth · sell at horizon
- IRR
- 26.3%
- Equity multiple
- 2.68×
- Total profit
- $46,659
- Equity at exit
- $58,737
- IRR
- 25.0%
- Equity multiple
- 5.39×
- Total profit
- $121,575
- Equity at exit
- $103,622
Cash invested: $27,720 (down + closing). Projections, not guarantees.
Landlord ↔ Tenant lean methodology
- Overall (STATE)
- 87 Strongly Landlord-Friendly
- State Texas
- 87 Strongly Landlord-Friendly · R+5
- County
- — inherits STATE
- City
- — inherits STATE
ZIP-level market 77703
- Home prices YoY
- 3.7%
- Active inventory
- 79
- Price-to-rent
- 6.3×
Monthly cashflow live
- Estimated rent
- $1,305 high interval (Pro) →
- Mortgage (P&I)
- −$519
- Tax from tax record
- −$135 /mo · $1,624/yr
- Insurance
- −$41
- HOA
- −$0
- Vacancy / Maint / Mgmt
- −$274
- Net cashflow
- $335
Break-even live
UW: 25.0% down · 7.5% · 30yr · 1.5% tax · 5.0% vac · 8.0% maint · 8.0% mgmt
Financing live
Cash to close
- Down payment
- $24,750
- Closing costs
- $2,970
- Reserves months
- —
- Total cash needed
- —
Loan-product check · same deal, 3 products live
Conventional
25% down · 7.5% · 30yr
- Down + closing
- —
- Monthly P&I
- —
- Monthly cashflow
- —
- DSCR
- —
- Eligible?
- —
Personal DTI + credit; lowest rate.
DSCR
20% down · 8.5% · 30yr
- Down + closing
- —
- Monthly P&I
- —
- Monthly cashflow
- —
- DSCR
- —
- Eligible?
- —
No personal income docs; deal must DSCR.
Hard money
10% down · 12.0% · 12mo
- Down + closing
- —
- Monthly P&I
- —
- Monthly cashflow
- —
- DSCR
- —
- Eligible?
- —
Short-term bridge; refi at stabilization.
Rent comps 17 comps
| Address | Beds | Baths | Sqft | Rent | $/sqft | DOM | Units | Dist |
|---|---|---|---|---|---|---|---|---|
| 2450 N Lynwood Dr Beaumont, TX | 3.0 | 1.0 | 1015 | $1,175 | $1.16 | 23d | 1 | 0.40mi |
| 2023 Delaware St Beaumont, TX | 3.0 | 1.0 | 1180 | $1,300 | $1.10 | 43d | 1 | 0.43mi |
| 2555 Pierce St Beaumont, TX | 3.0 | 2.0 | 1364 | $1,450 | $1.06 | 23d | 1 | 0.51mi |
| 2530 Pierce St Beaumont, TX | 2.0 | 1.0 | 950 | $1,000 | $1.05 | 43d | 1 | 0.53mi |
| 2550 Pierce St Beaumont, TX | 2.0 | 1.0 | 1044 | $1,050 | $1.01 | 43d | 1 | 0.54mi |
| 4565 Detroit St Beaumont, TX | 2.0 | 1.0 | 880 | $995 | $1.13 | 44d | 1 | 0.79mi |
| 3085 S Willowood Ln Beaumont, TX | 3.0 | 1.0 | 1533 | $1,400 | $0.91 | 13d | 1 | 0.84mi |
| 2020 Cottonwood St Beaumont, TX | 2.0–4.0 | 1.0 | 928 | $1,238 | $1.33 | 13d | 9 | 0.87mi |
| 4325 Woodlawn St Beaumont, TX | 2.0 | 1.0 | 1150 | $1,000 | $0.87 | 13d | 1 | 0.89mi |
| 1420 Liveoak St Beaumont, TX | 3.0 | 2.0 | 1760 | $1,695 | $0.96 | 23d | 1 | 1.05mi |
| 2570 Sweetgum Ln Beaumont, TX | 1.0–2.0 | 1.0–1.5 | 876 | $1,599 | $1.82 | 13d | 15 | 1.16mi |
| 5070 Wilshire St Beaumont, TX | 2.0 | 1.0 | 1042 | $1,295 | $1.24 | 13d | 1 | 1.18mi |
| 3910 Baldwin St Beaumont, TX | 3.0 | 1.0 | 1220 | $1,200 | $0.98 | 23d | 1 | 1.33mi |
| 3155 French Rd Beaumont, TX | 1.0–3.0 | 1.0–2.0 | 905 | $999 | $1.10 | 13d | 9 | 1.38mi |
| 3255 Charles St Beaumont, TX | 3.0 | 1.0 | 1396 | $1,350 | $0.97 | 43d | 1 | 1.38mi |
| 2525 Louisiana St Beaumont, TX | 2.0 | 1.0 | 1516 | $1,485 | $0.98 | 23d | 1 | 1.39mi |
| 2995 Wier Dr Beaumont, TX | 3.0 | 2.0 | 1446 | $1,800 | $1.24 | 13d | 1 | 1.50mi |
Listing history 20 events
-
2026-06-18days on market $99,000 Active 377 DOM
-
2026-06-17days on market $99,000 Active 376 DOM
-
2026-06-16days on market $99,000 Active 375 DOM
-
2026-06-15days on market $99,000 Active 374 DOM
-
2026-06-14days on market $99,000 Active 372 DOM
-
2026-06-13days on market $99,000 Active 371 DOM
-
2026-06-10days on market $99,000 Active 369 DOM
-
2026-06-09days on market $99,000 Active 368 DOM
-
2026-06-08days on market $99,000 Active 367 DOM
-
2026-06-07days on market $99,000 Active 366 DOM
-
2026-06-03days on market $99,000 Active 362 DOM
-
2026-06-02days on market $99,000 Active 361 DOM
-
2026-06-01days on market $99,000 Active 360 DOM
-
2026-05-31days on market $99,000 Active 359 DOM
-
2026-05-30days on market $99,000 Active 358 DOM
-
2025-06-20price $99,000 996-char remark
Show marketing remark (996 chars)
GOOD LOCATION! 2110 Leight St needs some repairs but has lots of potential. It has three bedrooms, one bathroom, and 1,278 square feet of space, this residence provides ample room for comfortable living. Situated on a large 9,520 square foot lot, the property boasts a spacious backyard, perfect for outdoor activities and entertaining. Inside, the home features vinyl plank flooring, providing durability and easy maintenance. The family room is bright and inviting, thanks to its large windows that flood the space with natural light. Whether you're relaxing indoors or enjoying the outdoor space, this home offers a cozy and welcoming atmosphere for you and your loved ones. Easy access I-10 and is near restaurant, supermarkets, and local shops in the Beaumont area. WE MAKE IT EASY TO OWN. This is a great opportunity! Don't wait, call us today to get more information on the owner's easy terms and smooth process that mat be able to put the deed in your name and make this your dream home.
-
2025-06-06$114,749 Active 996-char remark
Show marketing remark (996 chars)
GOOD LOCATION! 2110 Leight St needs some repairs but has lots of potential. It has three bedrooms, one bathroom, and 1,278 square feet of space, this residence provides ample room for comfortable living. Situated on a large 9,520 square foot lot, the property boasts a spacious backyard, perfect for outdoor activities and entertaining. Inside, the home features vinyl plank flooring, providing durability and easy maintenance. The family room is bright and inviting, thanks to its large windows that flood the space with natural light. Whether you're relaxing indoors or enjoying the outdoor space, this home offers a cozy and welcoming atmosphere for you and your loved ones. Easy access I-10 and is near restaurant, supermarkets, and local shops in the Beaumont area. WE MAKE IT EASY TO OWN. This is a great opportunity! Don't wait, call us today to get more information on the owner's easy terms and smooth process that mat be able to put the deed in your name and make this your dream home.
-
2022-07-18soldstatus
-
2022-06-16historical
-
2022-06-10$30,000 Active
ⓘ Source: listings_history table (triggers on properties + properties_extension) + one-shot
backfill from property_details.listing_events for pre-trigger history.
Tax reassessment forecast TX · Resets to sale price
- Current annual tax
- $1,624 · $135/mo
- Projected year-2 tax
- $1,812 · $151/mo
- Expected delta
- +$188/yr (+$16/mo · 11.6%)
ⓘ Screening estimate from a state-policy table — verify with the county assessor before closing.
Climate risk First Street
- Flood 6/10 Major FEMA zone X · 74% chance over 30 yrs
- Wildfire 1/10 Low
- Heat 9/10 Extreme 7 d/yr ≥109°F today · 24 d/yr by 30 yrs out
- Wind 9/10 Extreme 99% chance of damaging wind over 30 yrs
- Air quality 2/10 Low 1 unhealthy d/yr today · 1 by 30 yrs out
Nearby sold comps map
Loading sold comps map…
Walkable amenities ~0.75 mi
Loading nearby amenities…
Taxation est. · year 1
- Rental income
- $15,657
- − Mortgage interest
- −$5,546
- − Property taxes
- −$1,624
- − Insurance
- −$495
- − Repairs & maintenance
- −$1,253
- − Management
- −$1,253
- − Depreciation
- −$2,880
- Taxable income
- $2,607
- Est. tax owed @ 24.0%
- −$626
- After-tax cash flow
- $3,394/yr
For passive investors: Depreciation is non-cash, so a rental often shows a tax loss while cash-flowing — sheltering income. Rental losses are passive: they offset passive income freely, and up to $25,000/yr can offset ordinary (W-2) income if you actively participate and your MAGI is under $100k (phasing out to $0 by $150k); unused losses carry forward. On sale, claimed depreciation is recaptured at up to 25%, and gains may owe capital-gains tax (a 1031 exchange can defer both). Figures are a year-1 estimate at your 24.0% rate — not tax advice; consult a CPA.
Schools (NCES district)
- District
- Beaumont ISD
- NCES district ID
- 4809670
- Math proficiency
- 14% ▼ -13.00%
- Reading proficiency
- 22% ▼ -7.00%
- Median HH income
- $41,683
- Composite
- 15.43/100
- National rank
- #9316
- State rank
- #789 of 826 in TX
Livability — Beaumont
- Score
- 64/100
- State rank
- #739
- US rank
- #13710
Category grades
Schools grade is shown separately in the Schools card above.
Census & demographics
- Census place
- Beaumont, TX
- County
- Jefferson County · 203,592 people
- City population
- 125,901
- Metro
- Beaumont-Port Arthur, TX
- Population (ZIP)
- 11,004
- Household income
- $31,803
- Rent vs Own
- Severe rent burden
- 657.0
Population outlook (Jefferson County) Hauer SSP2
- Today (2025)
- 259,015 people
- By 2030
- 260,685 · +0.6%
- By 2040
- 263,309 · +1.7%
- By 2050
- 265,237 · +2.4%
- By 2075
- 270,193 · +4.3%
- By 2100
- 255,628 · -1.3%
Race, ethnicity, and origin ACS 2023
- Neighborhood character
- Majority Black (60%)
- Race & ethnicity
- Black 60% Hispanic / Latino 31% Two or more races 7% White 5%
- Hispanic origin (detail)
- Mexican 25%
- Common ancestry
- Serbian 1%
- Foreign-born
- 13% · Canada
- Languages at home
- 70% English-only · Spanish 29% French/Haitian/Cajun 1%
Political lean MEDSL · Jefferson
- 2024 margin
- Lean R (+8.9) · D 45.1% · R 54.0%
- 2008→2024 swing
- -11.1pp toward R · 2008: 2.2pp · 2024: -8.9pp
- All cycles
- 2024: R+8.9 2020: R+1.6 2016: R+0.5 2012: D+1.6 2008: D+2.2
Not yet ingested
- Civics
- —
Market trends
- HPI YoY
- ▲ 5.43%
- Current HPI
- 151.9888
- Rent YoY
- —
- Metro
- Beaumont-Port Arthur, TX
- State GDP YoY
- ▲ 3.95%
- F500 in state
- 110
Industry mix (Fortune 500 HQ in TX)
| Industry | F500 HQs | Revenue |
|---|---|---|
| Energy | 16 | $1,198B |
|
||
| Technology | 5 | $198B |
|
||
| Engineering / Construction | 4 | $72B |
|
||
| Energy Services | 3 | $60B |
|
||
| Utilities | 3 | $41B |
|
||
| Healthcare | 2 | $330B |
|
||
Price history
+230.0% since first listed5 events — show timeline
- 2025-06-20 Price Changed $99,000 HARMLS
- 2025-06-06 Listed $114,749 HARMLS
- 2022-07-18 Sold (Public Records) — Public Records
- 2022-06-16 Listing Removed — HARMLS
- 2022-06-10 Listed $30,000 HARMLS
Property tax history
+9.5%/yrLatest (2025): $1,624 · -28.3% YoY. Source: county tax records.
Cash-flow waterfall
monthlySold comps — $/sqft
last 12 mo · ≤1 miLoading sold comps…