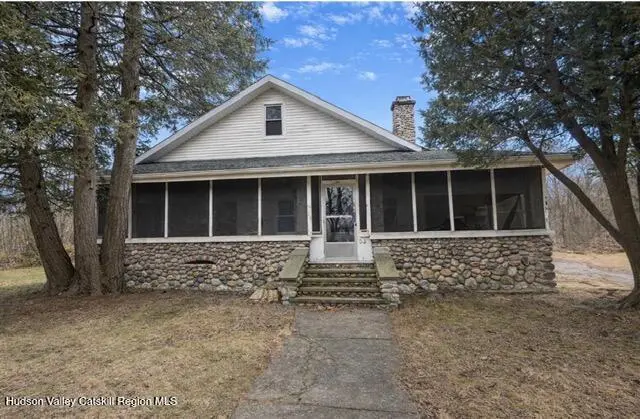
55 Payn Ave · Chatham, NY
Flood risk 1/10 · Minimal
- FEMA flood zone
- X
- Chance of flooding over 30 yrs
- 0.0%
- Est. flood insurance / yr
- $473 – $860
Fire risk 5/10 · Moderate
- Est. fire insurance / yr
- $691 – $1,283
Heat risk 3/10 · Minor
- Hot days now (above 95°F)
- 7 days/yr
- Hot days in 30 yrs
- 16 days/yr
Wind risk 4/10 · Minor
- Chance of severe wind over 30 yrs
- 9.0%
Air-quality risk 2/10 · Minimal
- Unhealthy air days now
- 1 days/yr
- Unhealthy air days in 30 yrs
- 1 days/yr
Risk factors via First Street. Map © Google.
Why this score? — see what drove the D grade
The composite is a weighted blend of 9 inputs, each scored 0–100. Each bar is that input's sub-score; the figure is the points it added to the 100-point composite (weight × sub-score).
- Appreciation +10.0/10.0
- Cash flow +8.4/30.0
- ARV discount +7.5/15.0
- Schools +4.4/10.0
- 1% rule +4.1/10.0
- Livability +3.2/5.0
- Rent growth +2.5/5.0
- Condition / age +2.5/5.0
- DSCR +2.3/10.0
$211,500
🖨 Deal sheet (PDF) 📄 Offer letter ✓ Due diligence
Listing remarks
Charming cape on one acre with a detached garage. Lots of room to spread out on this property. 4 Bedrooms 2 Baths on a fenced in lot. Inside has high ceilings and a beautiful stone fireplace, there is a crawl space basement and attic. Lots of original features, including beautiful inlaid wood flooring and wood trim. Detached oversized garage and 2 enclosed porches wrap up this gem.
Key facts
- Wood trim
- Crawl space basement
- Stone fireplace
Tags
Neighborhood map
What this means for you Summary
Snapshot
- This is a 4-bed/2.0-bath single-family listed at $212k.
Deal economics
- At list price, monthly cash flow is $-191 ($-2k/yr) — negative.
- To cash-flow at today's rent, offer at most $178k (16.0% below list).
- To meet the 1% rule (rent ≥ 1% of price), the offer needs to be $193k (8.7% below list).
- Recommended offer: $178k (16.0% below list) — sets the bar for cash-flow.
- Cap rate 5.2% vs local median 2.5% in Chatham — top-decile yield for the area; either an underpriced asset or a hidden risk that comps aren't pricing in. Stress-test before assuming the spread holds.
Location & tenants
- Location reads 65/100 on livability (#686 in NY) — a middle-class / working-renter tenant base. Strengths: crime A+, housing A-; Watch: employment C-, cost of living C-, amenities F.
- Chatham Central School District (rural): math 48% / reading 53% proficiency, ranked #353 of 590 in NY (top 60%) — acceptable for families but not a draw, mixed tenant base, ~2y average lease.
- Zoned schools: Mary E Dardess Elementary School (math 32% / reading 52%, grade F, #1,361 of 2,108 statewide, top 67%, 360 students, 45% FRL); Chatham Middle School (math 37% / reading 57%, grade D+, #315 of 729 statewide, top 45%, 186 students, 44% FRL); Chatham High School (math 92% / reading 75%, grade A, #409 of 1,100 statewide, top 39%, 323 students, 41% FRL) — zoned schools average 43% FRL vs 26% district-wide (18 pts higher); higher-poverty schools than district average — tighter screening recommended.
- Market conditions: 31 active listings in the ZIP; 136 units permitted in Columbia County in 2024 (0 in 5+ unit buildings).
Forward outlook
- In year one you build about $23k of equity ($1k loan paydown + $21k appreciation (10.0% local appreciation)).
- Columbia County population projected at -22% by 2050 — secular population decline; favor cash flow + early exit over multi-decade hold.
- By year 2, paydown + projected appreciation supports a ~$36k cash-out refi (75% LTV) — recoverable capital for the next deal without selling this one.
Negotiation context
- It's been on market 51 days — a 3% lower offer ($205k) is reasonable based on typical stale-listing flexibility.
- 5 sale attempts since 2y ago; this cycle's ask has dropped $24k (10%) from the opening price — seller is motivated, your offer sets the floor, not the list.
Risks & watch-outs
- Watch-outs: property tax is 2.9% of price; built in 1921 — expect roof / HVAC / electrical / plumbing capex.
- Climate carrying-cost: moderate wildfire risk — expect insurance premiums to compound above CPI over the hold.
Questions for the listing agent
- What do current leases actually rent for vs. the listed asking? Can we see a recent rent roll and the last 12 months of T-12 income?
- It's been on market 51 days. Have you received any prior offers? Is the seller open to a 16% concession, seller financing, or rate buy-down credit?
- Built in 1921 — when were the roof, HVAC, electrical panel, plumbing, and water heater last replaced?
- Property tax is high relative to price — has the assessment been appealed recently, and will the sale trigger a re-assessment?
- Is there a deadline driving the sale (1031 exchange, divorce, estate, relocation)? That informs how much negotiation room exists.
- Schools are B-rated — typically a magnet for longer-tenancy family renters. What's the average tenant stay here, and is there a school-zone premium baked into asking?
- The area grade is low — what's the realistic commute time and amenity access for the typical tenant pool here? Any planned neighborhood developments (good or bad) we should know about?
- What's the average days-on-market for RENTAL listings here right now (not sales)? A rising rental-DOM trend means longer vacancies and softer asking-rent achievability than the comps imply.
- What's the recent tenant-quality profile in this submarket — average credit score on applications, eviction rate, late-payment / NSF rate, and stable-employment percentage? A property-management company in the area should have these aggregated.
- How much new for-sale + rental construction is in the pipeline within 1–3 miles? Heavy new supply typically softens prices + rents 12–24 months out; constrained supply supports both.
Investment metrics
- 1% rule
- 0.91% ✗
- Cap rate
- 5.21%
- Cash-on-cash
- -3.88%
- DSCR
- 0.83
- GRM
- 9.1
CMA / ARV
- ARV (on-the-fly)
- $650,234
- Comps found
- 3
Show comp detail 3 sales within ~0.75 mi
| Address | Dist | Beds/Ba | Sqft | Sold | Price | $/sf | Match |
|---|---|---|---|---|---|---|---|
| 65 High St | 0.68mi | 3/1.5 (-1) | 2,242 (-3%) | 1mo | $629,000 | $281 | 55 |
| 7 Railroad Ave | 0.74mi | 3/2.0 (-1) | 2,264 (-2%) | 6mo | $425,000 | $188 | 52 |
| 1582 State Route 203 | 0.43mi | 3/3.5 (-1) | 2,050 (-11%) | 10mo | $679,000 | $331 | 42 |
Match score weights: distance 35% · size 25% · config 20% · recency 20%. Top-matched comps best support the ARV.
Projected returns pro-forma
10.0% appreciation · 3.0% rent growth · sell at horizon
- IRR
- 21.6%
- Equity multiple
- 2.74×
- Total profit
- $103,184
- Equity at exit
- $190,536
- IRR
- 19.5%
- Equity multiple
- 6.30×
- Total profit
- $313,814
- Equity at exit
- $410,898
Cash invested: $59,220 (down + closing). Projections, not guarantees.
Landlord ↔ Tenant lean methodology
- Overall (STATE)
- 15 Strongly Tenant-Friendly
- State New York
- 15 Strongly Tenant-Friendly · D+10
- County
- — inherits STATE
- City
- — inherits STATE
ZIP-level market 12037
- Home prices YoY
- 5.6%
- Active inventory
- 31
- Price-to-rent
- 9.1×
Monthly cashflow live
- Estimated rent
- $1,930 medium interval (Pro) →
- Mortgage (P&I)
- −$1,109
- Tax from tax record
- −$519 /mo · $6,226/yr
- Insurance
- −$88
- HOA
- −$0
- Vacancy / Maint / Mgmt
- −$405
- Net cashflow
- $-191
Break-even live
Sensitivity live
| Price | -10% $-72 | -5% $-132 | +0% $-191 | +5% $-251 | +10% $-311 |
|---|---|---|---|---|---|
| Rent | -10% $-344 | -5% $-268 | +0% $-191 | +5% $-115 | +10% $-39 |
| Rate | -1.0pp $-85 | -0.5pp $-138 | base $-191 | +0.5pp $-246 | +1.0pp $-302 |
UW: 25.0% down · 7.5% · 30yr · 1.5% tax · 5.0% vac · 8.0% maint · 8.0% mgmt
Financing live
Cash to close
- Down payment
- $52,875
- Closing costs
- $6,345
- Reserves months
- —
- Total cash needed
- —
Loan-product check · same deal, 3 products live
Conventional
25% down · 7.5% · 30yr
- Down + closing
- —
- Monthly P&I
- —
- Monthly cashflow
- —
- DSCR
- —
- Eligible?
- —
Personal DTI + credit; lowest rate.
DSCR
20% down · 8.5% · 30yr
- Down + closing
- —
- Monthly P&I
- —
- Monthly cashflow
- —
- DSCR
- —
- Eligible?
- —
No personal income docs; deal must DSCR.
Hard money
10% down · 12.0% · 12mo
- Down + closing
- —
- Monthly P&I
- —
- Monthly cashflow
- —
- DSCR
- —
- Eligible?
- —
Short-term bridge; refi at stabilization.
Listing history 13 events
-
2026-04-11status Pending
-
2026-03-27historical Active Under Contract
-
2026-03-17status Active
-
2026-03-17price $211,500
-
2026-02-12status Pending
-
2026-01-28historical Active Under Contract
-
2026-01-16$235,000 Active
-
2025-01-21status Pending
-
2025-01-15historical
-
2024-09-23status Active
-
2024-08-22historical Contingent
-
2024-07-22$325,000 Active
-
2024-07-21$325,000
ⓘ Source: listings_history table (triggers on properties + properties_extension) + one-shot
backfill from property_details.listing_events for pre-trigger history.
Tax reassessment forecast NY · Partial reset (capped growth)
- Current annual tax
- $6,226 · $519/mo
- Projected year-2 tax
- $6,226 · $519/mo
- Expected delta
- $0/yr ($0/mo · 0.0%)
ⓘ Screening estimate from a state-policy table — verify with the county assessor before closing.
Climate risk First Street
- Flood 1/10 Low FEMA zone X · 0% chance over 30 yrs
- Wildfire 5/10 Major
- Heat 3/10 Moderate 7 d/yr ≥95°F today · 16 d/yr by 30 yrs out
- Wind 4/10 Moderate 9% chance of damaging wind over 30 yrs
- Air quality 2/10 Low 1 unhealthy d/yr today · 1 by 30 yrs out
Nearby sold comps map
Loading sold comps map…
Walkable amenities ~0.75 mi
Loading nearby amenities…
Taxation est. · year 1
- Rental income
- $23,160
- − Mortgage interest
- −$11,847
- − Property taxes
- −$6,226
- − Insurance
- −$1,058
- − Repairs & maintenance
- −$1,853
- − Management
- −$1,853
- − Depreciation
- −$6,153
- Taxable loss
- −$5,829
- Est. tax savings @ 24.0%
- +$1,399
- After-tax cash flow
- $-898/yr
For passive investors: Depreciation is non-cash, so a rental often shows a tax loss while cash-flowing — sheltering income. Rental losses are passive: they offset passive income freely, and up to $25,000/yr can offset ordinary (W-2) income if you actively participate and your MAGI is under $100k (phasing out to $0 by $150k); unused losses carry forward. On sale, claimed depreciation is recaptured at up to 25%, and gains may owe capital-gains tax (a 1031 exchange can defer both). Figures are a year-1 estimate at your 24.0% rate — not tax advice; consult a CPA.
Schools (NCES district)
- District
- Chatham Central School District
- NCES district ID
- 3607110
- Math proficiency
- 48% ▼ -12.00%
- Reading proficiency
- 53% ▲ 1.00%
- Median HH income
- $61,460
- Composite
- 44.28/100
- National rank
- #2835
- State rank
- #353 of 590 in NY
Livability — Chatham
- Score
- 65/100
- State rank
- #686
- US rank
- #12965
Category grades
Schools grade is shown separately in the Schools card above.
Census & demographics
- Census place
- Chatham, NY
- Population (ZIP)
- 4,045
Population outlook (Columbia County) Hauer SSP2
- Today (2025)
- 58,662 people
- By 2030
- 56,557 · -3.6%
- By 2040
- 51,324 · -12.5%
- By 2050
- 45,790 · -21.9%
- By 2075
- 35,232 · -39.9%
- By 2100
- 25,846 · -55.9%
Race, ethnicity, and origin ACS 2023
- Neighborhood character
- Predominantly White (83%)
- Race & ethnicity
- White 83% Two or more races 12% Hispanic / Latino 2%
- Common ancestry
- Lithuanian 3% Romanian 3% Iranian 3%
- Foreign-born
- 6% · Canada
- Languages at home
- 89% English-only · Other Indo-European 6% German/W. Germanic 3% Spanish 2%
Political lean MEDSL · Columbia
- 2024 margin
- D (+14.7) · D 57.4% · R 42.6%
- 2008→2024 swing
- +1.3pp toward D · 2008: 13.4pp · 2024: 14.7pp
- All cycles
- 2024: D+14.7 2020: D+16.7 2016: D+1.4 2012: D+11.7 2008: D+13.4
Not yet ingested
- Civics
- —
Market trends
- HPI YoY
- ▲ 22.31%
- Current HPI
- 419.8449
- Rent YoY
- —
- Metro
- —
- State GDP YoY
- ▲ 2.60%
- F500 in state
- 92
Industry mix (Fortune 500 HQ in NY)
| Industry | F500 HQs | Revenue |
|---|---|---|
| Financial Services | 10 | $950B |
|
||
| Consumer Goods | 9 | $162B |
|
||
| Insurance | 4 | $225B |
|
||
| Telecommunications | 2 | $144B |
|
||
| Pharmaceuticals | 2 | $112B |
|
||
| Media / Entertainment | 2 | $69B |
|
||
Price history
-34.9% since first listed13 events — show timeline
- 2026-04-11 Pending — HVCRMLS
- 2026-03-27 Contingent — HVCRMLS
- 2026-03-17 Relisted — HVCRMLS
- 2026-03-17 Price Changed $211,500 HVCRMLS
- 2026-02-12 Pending — HVCRMLS
- 2026-01-28 Contingent — HVCRMLS
- 2026-01-16 Listed $235,000 HVCRMLS
- 2025-01-21 Pending — Global MLS
- 2025-01-15 Listing Removed — Global MLS
- 2024-09-23 Relisted — Global MLS
- 2024-08-22 Contingent — Global MLS
- 2024-07-22 Listed $325,000 Global MLS
- 2024-07-21 Listed $325,000 HVCRMLS
Property tax history
+1.4%/yrLatest (2025): $6,226 · +4.9% YoY. Source: county tax records.
Cash-flow waterfall
monthlySold comps — $/sqft
last 12 mo · ≤1 miLoading sold comps…