 Multi-family
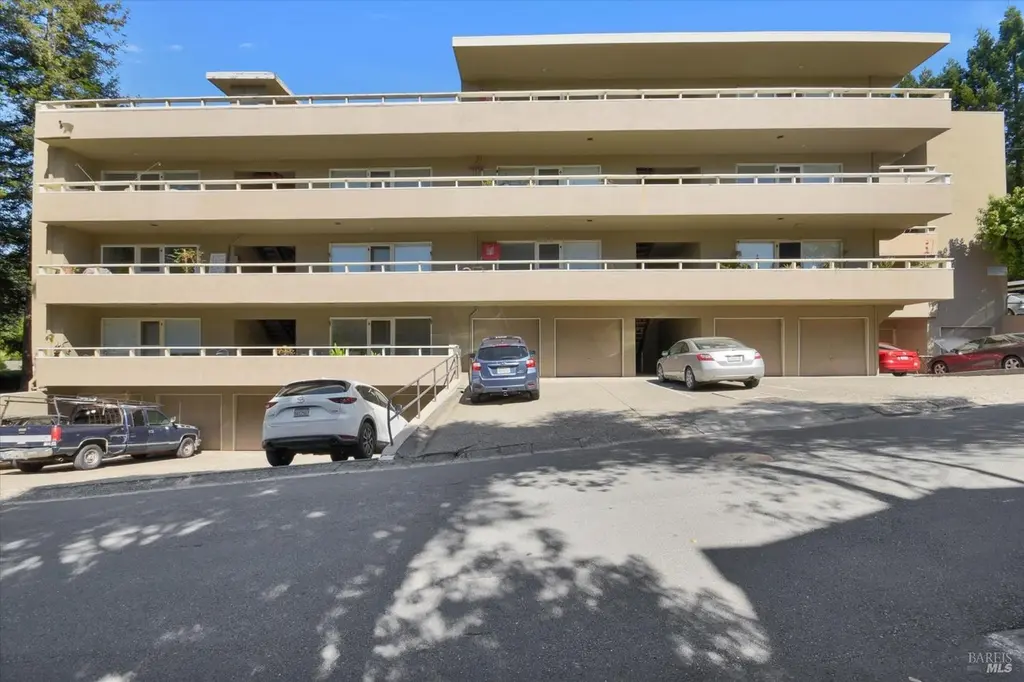
1118 Sir Francis Drake Blvd · Kentfield, CA
Flood risk 1/10 · Minimal
- FEMA flood zone
- X (shaded)
- Chance of flooding over 30 yrs
- 0.0%
- Est. flood insurance / yr
- $507 – $1,088
Fire risk 3/10 · Minor
- Est. fire insurance / yr
- $659 – $1,223
Heat risk 3/10 · Minor
- Hot days now (above 86°F)
- 7 days/yr
- Hot days in 30 yrs
- 17 days/yr
Wind risk 1/10 · Minimal
- Chance of severe wind over 30 yrs
- —
Air-quality risk 7/10 · Major
- Unhealthy air days now
- 12 days/yr
- Unhealthy air days in 30 yrs
- 12 days/yr
Risk factors via First Street. Map © Google.
Why this score? — see what drove the B grade
The composite is a weighted blend of 9 inputs, each scored 0–100. Each bar is that input's sub-score; the figure is the points it added to the 100-point composite (weight × sub-score).
- Cash flow +25.9/30.0
- DSCR +8.7/10.0
- Appreciation +7.7/10.0
- ARV discount +7.5/15.0
- Schools +6.5/10.0
- 1% rule +6.3/10.0
- Livability +3.5/5.0
- Rent growth +3.4/5.0
- Condition / age +2.5/5.0
$10,500,000
🖨 Deal sheet (PDF) 📄 Offer letter ✓ Due diligence
Multi-family units
County records classify this as Multi-Family (5+ Unit). Listing-text estimate: 1 unit. estimate disagrees with records
5+ unit building — per-unit beds/baths from public records are typically unavailable; the breakdown below (if shown) is an estimate from the listing text.
Listing remarks
Ideally located in the heart of affluent central Marin, this well-positioned property sits directly across from Kentfield Hospital and just two blocks west of the College of Marin. The highly desirable Kentfield location offers residents convenient access to major employers, retail, dining, and transportation corridors. Originally constructed in 1955, The Ross Apartments have been meticulously maintained by long-term ownership. While select improvements have been completed over the years, the property presents a strong value-add opportunity for future modernization and interior upgrades. The unit mix consists of four 2-bedroom apartments, twenty-six 1-bedroom apartments, and one spacious st
Key facts
- Hardwood flooring
- Shared outdoor decks
- Stucco exterior
Tags
Property features AI
Finance
- HOA & community: No association
Exterior
- Parking: Total parking for 31 vehicles; Carport and off-street parking; 8-space garage
- Utilities: Public sewer
- Home design: Residential income property; Five-or-more-unit multi-family building; Four levels; Property shows both original and updated/remodeled condition
- Construction: Bitumen roof
- Exterior features: Corner lot with landscaped front
Interior
- Kitchen: Free standing electric oven; Free standing refrigerator
- Bedrooms: 31 total residential units: 26 one-bedroom units, 4 two-bedroom units, 1 studio
- Flooring: Wood floors
- Heating & cooling: Central heating; Individual heating in some units; No cooling
- Interior features: Free standing electric oven; Free standing refrigerator; Coin-operated laundry in a common area; Wood flooring; Varied unit heating with central and individual systems
- Laundry & utility: Coin-operated laundry located in a common area
Neighborhood map
What this means for you Summary
Snapshot
- This is a multifamily listed at $10.50M.
Deal economics
- At list price, monthly cash flow is $26k ($310k/yr) — positive.
- The deal already cash-flows at list — no discount required.
- Meets the 1% rule at list price ($119k rent vs $10.50M).
- Recommended offer: $10.34M (1.5% below list) — sets the bar for market timing.
Location & tenants
- Location reads 69/100 on livability (#245 in CA) — a middle-class / working-renter tenant base. Strengths: schools A+, crime A+, employment A+; Watch: amenities F, cost of living F.
- Tamalpais Union High (suburban): math 62% / reading 78% proficiency, ranked #42 of 517 in CA (top 8%) — strong family-tenant draw, lease renewals of 3-5y typical.
- Market conditions: Rents rising (+3.5%/yr); 51 active listings in the ZIP; 26 comparable units currently listed for rent nearby; rentals leasing fast (median 0d on market — plan ~1-2 weeks tenant-placement turnaround); high-income renter base; 149 units permitted in Marin County in 2024 (5 in 5+ unit buildings).
- At $118,600/mo this rent would consume 842% of the median local household income ($169k/yr) (locally 713% of renters already pay >50% of income on rent) — very limited rent-growth headroom before tenants either downsize or default.
Forward outlook
- In year one you build about $643k of equity ($73k loan paydown + $570k appreciation (5.4% local appreciation)).
- Marin County population projected at +9% by 2050 — modest demand growth; plan on rents tracking national, not racing it.
- At projected returns (5.4% appreciation + 3.5% rent growth), your $2.94M cash investment doubles in ~3 years — after that, you're playing with house money.
- By year 2, paydown + projected appreciation supports a ~$1.03M cash-out refi (75% LTV) — recoverable capital for the next deal without selling this one.
Negotiation context
- It's been on market 26 days — a 2% lower offer ($10.34M) is reasonable based on typical stale-listing flexibility.
- Current owner paid $2.33M; list at $10.50M implies a 351% gain — meaningful room to come down on a strong offer.
Risks & watch-outs
- Watch-outs: built in 1955 — expect roof / HVAC / electrical / plumbing capex.
Questions for the listing agent
- Built in 1955 — when were the roof, HVAC, electrical panel, plumbing, and water heater last replaced?
- Is there a deadline driving the sale (1031 exchange, divorce, estate, relocation)? That informs how much negotiation room exists.
- Schools are A-rated — typically a magnet for longer-tenancy family renters. What's the average tenant stay here, and is there a school-zone premium baked into asking?
- What's the average days-on-market for RENTAL listings here right now (not sales)? A rising rental-DOM trend means longer vacancies and softer asking-rent achievability than the comps imply.
- What's the recent tenant-quality profile in this submarket — average credit score on applications, eviction rate, late-payment / NSF rate, and stable-employment percentage? A property-management company in the area should have these aggregated.
- How much new apartment / multifamily construction is in the pipeline within 1–3 miles? Heavy new supply (>2% of stock underway) typically softens rents 12–24 months out; light construction supports rent growth.
Investment metrics
- 1% rule
- 1.13% ✓
- Cap rate
- 9.24%
- Cash-on-cash
- 10.53%
- DSCR
- 1.47
- GRM
- 7.4
CMA / ARV
No comps found within radius.
Show comp detail 2 sales within ~0.75 mi
| Address | Dist | Beds/Ba | Sqft | Sold | Price | $/sf | Match |
|---|---|---|---|---|---|---|---|
| 5 Elm Ave | 0.17mi | 4/3.0 | 2,131 | 7mo | $1,380,000 | $648 | 74 |
| 14 - 16 Stadium Way | 0.52mi | 4/2.0 | 1,884 | 8mo | $1,625,000 | $863 | 56 |
Match score weights: distance 35% · size 25% · config 20% · recency 20%. Top-matched comps best support the ARV.
Projected returns pro-forma
5.43% appreciation · 3.52% rent growth · sell at horizon
- IRR
- 23.1%
- Equity multiple
- 2.49×
- Total profit
- $4,385,362
- Equity at exit
- $6,227,853
- IRR
- 22.5%
- Equity multiple
- 5.03×
- Total profit
- $11,845,171
- Equity at exit
- $10,985,312
Cash invested: $2,940,000 (down + closing). Projections, not guarantees.
Landlord ↔ Tenant lean methodology
- Overall (STATE)
- 18 Strongly Tenant-Friendly
- State California
- 18 Strongly Tenant-Friendly · D+13
- County
- — inherits STATE
- City
- — inherits STATE
ZIP-level market 94904
- Home prices YoY
- 2.0%
- Rents YoY
- 3.5%
- Active inventory
- 51
- Price-to-rent
- 208.7×
Monthly cashflow live
- Estimated rent
- $118,600 high interval (Pro) →
- Mortgage (P&I)
- −$55,063
- Tax from tax record
- −$8,459 /mo · $101,513/yr
- Insurance
- −$4,375
- HOA
- −$0
- Vacancy / Maint / Mgmt
- −$24,906
- Net cashflow
- $25,796
Break-even live
Sensitivity live
| Price | -10% $31,740 | -5% $28,768 | +0% $25,796 | +5% $22,825 | +10% $19,853 |
|---|---|---|---|---|---|
| Rent | -10% $16,427 | -5% $21,112 | +0% $25,796 | +5% $30,481 | +10% $35,166 |
| Rate | -1.0pp $31,084 | -0.5pp $28,467 | base $25,796 | +0.5pp $23,076 | +1.0pp $20,308 |
31-unit breakdown (identical units grouped — click to expand)
| Units | Beds | Baths | Est. rent |
|---|---|---|---|
| 5× units | 2 | 1 | $20,965 |
| #1 | 2 | 1 | $4,193 |
| #2 | 2 | 1 | $4,193 |
| #3 | 2 | 1 | $4,193 |
| #4 | 2 | 1 | $4,193 |
| #31 | 2 | 1 | $4,193 |
| 26× units | 1 | 1 | $97,630 |
| #5 | 1 | 1 | $3,755 |
| #6 | 1 | 1 | $3,755 |
| #7 | 1 | 1 | $3,755 |
| #8 | 1 | 1 | $3,755 |
| #9 | 1 | 1 | $3,755 |
| #10 | 1 | 1 | $3,755 |
| #11 | 1 | 1 | $3,755 |
| #12 | 1 | 1 | $3,755 |
| #13 | 1 | 1 | $3,755 |
| #14 | 1 | 1 | $3,755 |
| #15 | 1 | 1 | $3,755 |
| #16 | 1 | 1 | $3,755 |
| #17 | 1 | 1 | $3,755 |
| #18 | 1 | 1 | $3,755 |
| #19 | 1 | 1 | $3,755 |
| #20 | 1 | 1 | $3,755 |
| #21 | 1 | 1 | $3,755 |
| #22 | 1 | 1 | $3,755 |
| #23 | 1 | 1 | $3,755 |
| #24 | 1 | 1 | $3,755 |
| #25 | 1 | 1 | $3,755 |
| #26 | 1 | 1 | $3,755 |
| #27 | 1 | 1 | $3,755 |
| #28 | 1 | 1 | $3,755 |
| #29 | 1 | 1 | $3,755 |
| #30 | 1 | 1 | $3,755 |
| Total (31 units) | $118,600 | ||
UW: 25.0% down · 7.5% · 30yr · 1.5% tax · 5.0% vac · 8.0% maint · 8.0% mgmt
Financing live
Cash to close
- Down payment
- $2,625,000
- Closing costs
- $315,000
- Reserves months
- —
- Total cash needed
- —
Loan-product check · same deal, 3 products live
Conventional
25% down · 7.5% · 30yr
- Down + closing
- —
- Monthly P&I
- —
- Monthly cashflow
- —
- DSCR
- —
- Eligible?
- —
Personal DTI + credit; lowest rate.
DSCR
20% down · 8.5% · 30yr
- Down + closing
- —
- Monthly P&I
- —
- Monthly cashflow
- —
- DSCR
- —
- Eligible?
- —
No personal income docs; deal must DSCR.
Hard money
10% down · 12.0% · 12mo
- Down + closing
- —
- Monthly P&I
- —
- Monthly cashflow
- —
- DSCR
- —
- Eligible?
- —
Short-term bridge; refi at stabilization.
Rent comps 26 comps
| Address | Beds | Baths | Sqft | Rent | $/sqft | DOM | Units | Dist |
|---|---|---|---|---|---|---|---|---|
| 21 Elm Ave Kentfield, CA | 2.0 | 2.0 | 1106 | $7,000 | $6.33 | 23d | 1 | 0.17mi |
| 128 McAllister Ave Kentfield, CA | 3.0 | 2.0 | 1200 | $6,995 | $5.83 | 0d | 1 | 0.69mi |
| 19 Belle Ave Apt 9 San Anselmo, CA | 2.0 | 1.0 | 1025 | $3,000 | $2.93 | 0d | 1 | 0.96mi |
| 965 Magnolia Ave Larkspur, CA | 1.0–2.0 | 1.0–2.0 | 841 | $3,995 | $4.75 | 0d | 3 | 0.98mi |
| 201 D St Unit 1 San Rafael, CA | 2.0 | 1.0 | 1150 | $3,495 | $3.04 | 0d | 1 | 0.99mi |
| 201 D St Unit 7 San Rafael, CA | 2.0 | 1.0 | 875 | $2,895 | $3.31 | 0d | 1 | 1.00mi |
| 332 Bayview St Unit A San Rafael, CA | 1.0 | 1.0 | 552 | $2,850 | $5.16 | 0d | 1 | 1.01mi |
| 239 D St Unit 27 San Rafael, CA | 2.0 | 1.0 | — | $2,600 | — | 0d | 1 | 1.04mi |
| 14 Skylark Dr Larkspur, CA | 3.0 | 1.0–2.0 | 944 | $4,530 | $4.80 | 0d | 9 | 1.07mi |
| 122 Ross St San Rafael, CA | 1.0 | 1.0 | 500 | $2,225 | $4.45 | 0d | 1 | 1.07mi |
| 40 Ross Ave Apt 3 San Anselmo, CA | 1.0 | 1.0 | — | $2,495 | — | 0d | 1 | 1.14mi |
| 220 Marin St San Rafael, CA | 1.0 | 1.0 | — | $2,495 | — | 0d | 1 | 1.16mi |
| 10 E Crescent Dr Unit D San Rafael, CA | 3.0 | 3.0 | 1555 | $6,750 | $4.34 | 23d | 1 | 1.20mi |
| 1600-1606 3rd St San Rafael, CA | 1.0 | 1.0 | 763 | $2,800 | $3.67 | 0d | 1 | 1.24mi |
| 310 1st St Unit 17 San Rafael, CA | 1.0 | 1.0 | 700 | $2,385 | $3.41 | 16d | 1 | 1.25mi |
| 100 Bayo Vista Way San Rafael, CA | 2.0 | 1.0 | — | $2,650 | — | 0d | 1 | 1.25mi |
| 15 Bank St Unit A San Anselmo, CA | 2.0 | 1.0 | 1000 | $2,950 | $2.95 | 18d | 1 | 1.26mi |
| 107 G St Apt 208 San Rafael, CA | 1.0 | 1.5 | — | $3,225 | — | 11d | 1 | 1.29mi |
| 45 Bayo Vista Way San Rafael, CA | 3.0 | 1.5 | 1300 | $3,900 | $3.00 | 0d | 1 | 1.32mi |
| 51 Essex St San Anselmo, CA | 2.0 | 1.5 | 880 | $2,950 | $3.35 | 0d | 1 | 1.33mi |
| 290 Via Casitas Unit 206 Larkspur, CA | 3.0 | 2.0 | 1300 | $4,100 | $3.15 | 0d | 1 | 1.33mi |
| 50 Corte Real Greenbrae, CA | 2.0 | 2.0 | 1575 | $4,495 | $2.85 | 0d | 1 | 1.35mi |
| 40 Leafwood Cir Unit 42 Leafwood Circe San Rafael, CA | 2.0 | 2.0 | 1000 | $3,850 | $3.85 | 0d | 1 | 1.38mi |
| 1959 5th Ave San Rafael, CA | 2.0 | 1.0 | — | $3,895 | — | 11d | 1 | 1.41mi |
| 195 Melville Ave San Anselmo, CA | 1.0 | 1.0 | 640 | $2,500 | $3.91 | 0d | 1 | 1.41mi |
| 155 Andersen Dr San Rafael, CA | 1.0–2.0 | 1.0 | 1377 | $2,802 | $2.03 | 0d | 6 | 1.47mi |
Listing history 24 events
-
2026-06-21days on market $10,500,000 Active 26 DOM
-
2026-06-18days on market $10,500,000 Active 23 DOM
-
2026-06-17days on market $10,500,000 Active 22 DOM
-
2026-06-16days on market $10,500,000 Active 21 DOM
-
2026-06-15days on market $10,500,000 Active 20 DOM
-
2026-06-13days on market $10,500,000 Active 18 DOM
-
2026-06-13days on market $10,500,000 Active 17 DOM
-
2026-06-09days on market $10,500,000 Active 14 DOM
-
2026-06-08days on market $10,500,000 Active 13 DOM
-
2026-06-07days on market $10,500,000 Active 12 DOM
-
2026-06-04days on market $10,500,000 Active 9 DOM
-
2026-06-03days on market $10,500,000 Active 8 DOM
-
2026-06-02days on market $10,500,000 Active 7 DOM
-
2026-06-01days on market $10,500,000 Active 6 DOM
-
2026-05-31days on market $10,500,000 Active 5 DOM
-
2026-05-27$10,500,000 Active
-
1988-06-15soldstatus $2,330,000
-
1986-09-24soldstatus $1,705,000
-
1984-02-23soldstatus $1,730,000
-
1983-01-27soldstatus $25,810
-
1983-01-27soldstatus $8,500
-
1983-01-27soldstatus $8,500
-
1983-01-27soldstatus $34,000
-
1983-01-27soldstatus $34,000
ⓘ Source: listings_history table (triggers on properties + properties_extension) + one-shot
backfill from property_details.listing_events for pre-trigger history.
Tax reassessment forecast CA · Resets to sale price
- Current annual tax
- $101,513 · $8,459/mo
- Projected year-2 tax
- $101,513 · $8,459/mo
- Expected delta
- $0/yr ($0/mo · 0.0%)
ⓘ Screening estimate from a state-policy table — verify with the county assessor before closing.
Climate risk First Street
- Flood 1/10 Low FEMA zone X (shaded) · 0% chance over 30 yrs
- Wildfire 3/10 Moderate
- Heat 3/10 Moderate 7 d/yr ≥86°F today · 17 d/yr by 30 yrs out
- Wind 1/10 Low
- Air quality 7/10 Severe 12 unhealthy d/yr today · 12 by 30 yrs out
Nearby sold comps map
Loading sold comps map…
Walkable amenities ~0.75 mi
Loading nearby amenities…
Taxation est. · year 1
- Rental income
- $1,423,200
- − Mortgage interest
- −$588,163
- − Property taxes
- −$101,513
- − Insurance
- −$52,500
- − Repairs & maintenance
- −$113,856
- − Management
- −$113,856
- − Depreciation
- −$305,455
- Taxable income
- $147,857
- Est. tax owed @ 24.0%
- −$35,486
- After-tax cash flow
- $274,071/yr
For passive investors: Depreciation is non-cash, so a rental often shows a tax loss while cash-flowing — sheltering income. Rental losses are passive: they offset passive income freely, and up to $25,000/yr can offset ordinary (W-2) income if you actively participate and your MAGI is under $100k (phasing out to $0 by $150k); unused losses carry forward. On sale, claimed depreciation is recaptured at up to 25%, and gains may owe capital-gains tax (a 1031 exchange can defer both). Figures are a year-1 estimate at your 24.0% rate — not tax advice; consult a CPA.
Schools (NCES district)
- District
- Tamalpais Union High
- NCES district ID
- 0638790
- Math proficiency
- 62% ▲ 4.00%
- Reading proficiency
- 78% ▲ 6.00%
- Median HH income
- $106,037
- Composite
- 64.66/100
- National rank
- #527
- State rank
- #42 of 517 in CA
Livability — Kentfield
- Score
- 69/100
- State rank
- #245
- US rank
- #8176
Category grades
Schools grade is shown separately in the Schools card above.
Census & demographics
- Census place
- Kentfield, CA
- County
- Marin County · 243,328 people
- City population
- 12,815
- Metro
- San Francisco-Oakland-Berkeley, CA
- Population (ZIP)
- 12,815
- Household income
- $169,118
- Rent vs Own
- Severe rent burden
- 713.0
Population outlook (Marin County) Hauer SSP2
- Today (2025)
- 276,379 people
- By 2030
- 282,942 · +2.4%
- By 2040
- 292,937 · +6.0%
- By 2050
- 300,449 · +8.7%
- By 2075
- 316,946 · +14.7%
- By 2100
- 303,948 · +10.0%
Race, ethnicity, and origin ACS 2023
- Neighborhood character
- Predominantly White (73%)
- Race & ethnicity
- White 73% Hispanic / Latino 13% Two or more races 8% Asian 7%
- Hispanic origin (detail)
- Mexican 6%
- Common ancestry
- Italian 4% Romanian 3% Lithuanian 3%
- Foreign-born
- 17% · Canada, South Korea, China
- Languages at home
- 78% English-only · Spanish 10% Other Indo-European 4% German/W. Germanic 2%
Political lean MEDSL · Marin
- 2024 margin
- Solid D (+63.9) · D 80.6% · R 16.7% · Other 2.7%
- 2008→2024 swing
- +6.2pp toward D · 2008: 57.7pp · 2024: 63.9pp
- All cycles
- 2024: D+63.9 2020: D+66.5 2016: D+62.9 2012: D+50.5 2008: D+57.7
Not yet ingested
- Civics
- —
Market trends
- HPI YoY
- ▲ 5.43%
- Current HPI
- 282.1489
- Rent YoY
- ▲ 3.52%
- Metro
- San Francisco-Oakland-Berkeley, CA
- State GDP YoY
- ▲ 3.21%
- F500 in state
- 116
Industry mix (Fortune 500 HQ in CA)
| Industry | F500 HQs | Revenue |
|---|---|---|
| Technology | 27 | $1,492B |
|
||
| Financial Services | 3 | $174B |
|
||
| Retail | 3 | $44B |
|
||
| Insurance | 3 | $26B |
|
||
| Media / Entertainment | 2 | $115B |
|
||
| Pharmaceuticals / Biotech | 2 | $62B |
|
||
Price history
+40581.9% since first listed9 events — show timeline
- 2026-05-27 Listed $10,500,000 BAREIS
- 1988-06-15 Sold (Public Records) $2,330,000 Public Records
- 1986-09-24 Sold (Public Records) $1,705,000 Public Records
- 1984-02-23 Sold (Public Records) $1,730,000 Public Records
- 1983-01-27 Sold (Public Records) $34,000 Public Records
- 1983-01-27 Sold (Public Records) $34,000 Public Records
- 1983-01-27 Sold (Public Records) $8,500 Public Records
- 1983-01-27 Sold (Public Records) $8,500 Public Records
- 1983-01-27 Sold (Public Records) $25,810 Public Records
Property tax history
+3.1%/yrLatest (2025): $101,513 · +5.0% YoY. Source: county tax records.
Cash-flow waterfall
monthlySold comps — $/sqft
last 12 mo · ≤1 miLoading sold comps…