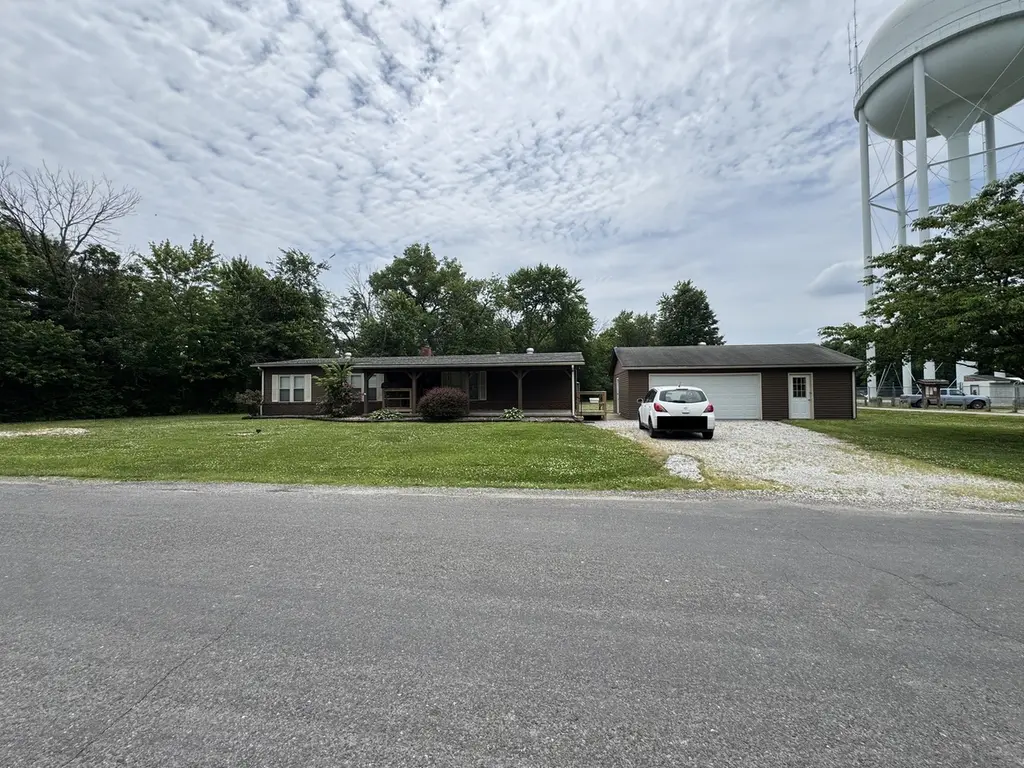
112 E 6th St · Staunton, IL
Flood risk 1/10 · Minimal
- FEMA flood zone
- X
- Chance of flooding over 30 yrs
- 0.0%
- Est. flood insurance / yr
- $473 – $860
Fire risk 2/10 · Minimal
- Est. fire insurance / yr
- $804 – $1,492
Heat risk 4/10 · Minor
- Hot days now (above 106°F)
- 7 days/yr
- Hot days in 30 yrs
- 20 days/yr
Wind risk 2/10 · Minimal
- Chance of severe wind over 30 yrs
- 1.0%
Air-quality risk 2/10 · Minimal
- Unhealthy air days now
- 1 days/yr
- Unhealthy air days in 30 yrs
- 1 days/yr
Risk factors via First Street. Map © Google.
Why this score? — see what drove the D+ grade
The composite is a weighted blend of 9 inputs, each scored 0–100. Each bar is that input's sub-score; the figure is the points it added to the 100-point composite (weight × sub-score).
- Cash flow +15.4/30.0
- ARV discount +14.7/15.0
- DSCR +4.7/10.0
- 1% rule +3.9/10.0
- Livability +3.0/5.0
- Rent growth +2.5/5.0
- Condition / age +2.5/5.0
- Schools +2.2/10.0
- Appreciation +0.0/10.0
$124,900
🖨 Deal sheet (PDF) 📄 Offer letter ✓ Due diligence
Listing remarks
Room to Live, Work, and Store It All! This well-maintained 3 bedroom, 2 bath manufactured home offers comfortable single-level living with the bonus of exceptional outdoor space. Inside you’ll find a practical, easy-flow layout with updated flooring throughout the last two years, a new water heater (2025), and a roof approximately 10 years old—making this home truly move-in ready. Where this property really shines is outside. In addition to the home, you’ll find a detached 2-car garage plus a 28 x 36 pole building, offering outstanding space for vehicles, equipment, hobbies, workshop use, or storage. Whether you're a car enthusiast, need room for tools and toys, or simply
Key facts
- Solid foundation
- 0.75 acre lot
- Garage
Tags
Property features AI
Finance
- Other: Home warranty included; Seller may consider concessions; Lease not considered
Exterior
- Parking: Detached garage (24x28); Driveway parking; Aggregate parking surface; 2-car garage
- Utilities: Public water; Public sewer; Electricity connected (electric service listed as Other); Cable available; Phone available; Water connected; Sewer connected
- Home design: Manufactured home (single story)
- Construction: Vinyl siding
- Exterior features: Level lot; Other structures include garages
Interior
- Kitchen: Range; Refrigerator
- Bedrooms: Three bedrooms, all on the main level
- Bathrooms: Two full bathrooms, both on the main level
- Heating & cooling: Forced air heating; Central air conditioning
- Interior features: One fireplace
- Laundry & utility: Washer and Dryer located in the kitchen on the main level
Neighborhood map
What this means for you Summary
Snapshot
- This is a 3-bed/2.0-bath single-family listed at $125k.
Deal economics
- At list price, monthly cash flow is $49 ($585/yr) — positive.
- The deal already cash-flows at list — no discount required.
- To meet the 1% rule (rent ≥ 1% of price), the offer needs to be $111k (10.8% below list).
- Recommended offer: $111k (10.8% below list) — sets the bar for 1% rule.
- Cap rate 6.8% vs local median 3.7% in Staunton — top-decile yield for the area; either an underpriced asset or a hidden risk that comps aren't pricing in. Stress-test before assuming the spread holds.
Location & tenants
- Location reads 59/100 on livability (#1,073 in IL) — a working-class tenant base; expect higher turnover. Strengths: cost of living A+, housing A+, crime B; Watch: employment D+, amenities F, commute F.
- Staunton CUSD 6 (town): math 22% / reading 28% proficiency, ranked #323 of 620 in IL (top 52%) — low school quality limits family demand, transient renter base, plan for 1-2y turnover.
- Zoned schools: Staunton Elem School (math 23% / reading 28%, grade F, #829 of 2,056 statewide, top 41%, 563 students, 0% FRL); Staunton Jr High School (math 21% / reading 29%, grade F, #327 of 665 statewide, top 50%, 243 students, 0% FRL); Staunton High School (math 22% / reading 22%, grade F, #319 of 693 statewide, top 50%, 411 students, 0% FRL) — zoned schools average 0% FRL vs 35% district-wide (35 pts lower); this property's tenant base skews higher-income than the district average.
- Market conditions: 35 active listings in the ZIP; 70 units permitted in Macoupin County in 2024 (0 in 5+ unit buildings).
Forward outlook
- Local home prices are declining (-3.0%/yr); year-one equity from $864 of loan paydown is wiped out by about $4k of value loss. Plan a longer hold.
- Macoupin County population projected at -27% by 2050 — secular population decline; favor cash flow + early exit over multi-decade hold.
Negotiation context
- Only 10 days on market — expect competitive offers; lowballing is unlikely to land.
- 2 sale attempts; this cycle's ask has dropped $25k (17%) from the opening price — seller is motivated, your offer sets the floor, not the list.
Questions for the listing agent
- Built in 1978 — when were the roof, HVAC, electrical panel, plumbing, and water heater last replaced?
- Is there a deadline driving the sale (1031 exchange, divorce, estate, relocation)? That informs how much negotiation room exists.
- Schools are D-rated, which usually means shorter tenancies and higher turnover. Who's the typical renter profile here, and what's been the actual vacancy rate?
- The area grade is low — what's the realistic commute time and amenity access for the typical tenant pool here? Any planned neighborhood developments (good or bad) we should know about?
- What's the average days-on-market for RENTAL listings here right now (not sales)? A rising rental-DOM trend means longer vacancies and softer asking-rent achievability than the comps imply.
- What's the recent tenant-quality profile in this submarket — average credit score on applications, eviction rate, late-payment / NSF rate, and stable-employment percentage? A property-management company in the area should have these aggregated.
- How much new for-sale + rental construction is in the pipeline within 1–3 miles? Heavy new supply typically softens prices + rents 12–24 months out; constrained supply supports both.
Investment metrics
- 1% rule
- 0.89% ✗
- Cap rate
- 6.76%
- Cash-on-cash
- 1.67%
- DSCR
- 1.07
- GRM
- 9.3
CMA / ARV
- ARV (on-the-fly)
- $148,512
- Comps found
- 12
Show comp detail 12 sales within ~0.75 mi
| Address | Dist | Beds/Ba | Sqft | Sold | Price | $/sf | Match |
|---|---|---|---|---|---|---|---|
| 724 W Mill St | 0.50mi | 3/1.5 | 1,220 (-2%) | 3mo | $150,000 | $123 | 68 |
| 812 W Mill St | 0.53mi | 3/1.0 | 1,231 (-1%) | 3mo | $170,000 | $138 | 67 |
| 302 S Hackman St | 0.60mi | 2/1.0 (-1) | 1,247 (-0%) | 0mo | $148,000 | $119 | 63 |
| 518 S Madison St | 0.30mi | 3/1.5 | 1,410 (+13%) | 2mo | $198,000 | $140 | 61 |
| 402 E Macoupin St | 0.59mi | 3/1.0 | 1,260 (+1%) | 8mo | $149,900 | $119 | 60 |
| 706 S Hibbard St | 0.26mi | 3/1.0 | 1,400 (+12%) | 6mo | $149,000 | $106 | 59 |
| 311 S Hibbard St | 0.39mi | 3/1.5 | 1,410 (+13%) | 4mo | $199,900 | $142 | 55 |
| 821 W Mill St | 0.57mi | 2/1.0 (-1) | 1,150 (-8%) | 3mo | $135,000 | $117 | 49 |
| 615 E Macoupin St | 0.68mi | 2/1.0 (-1) | 1,306 (+5%) | 5mo | $129,900 | $99 | 47 |
| 1032 W Pearl St | 0.69mi | 2/1.5 (-1) | 1,150 (-8%) | 6mo | $109,900 | $96 | 43 |
| 202 E Olive St | 0.65mi | 3/1.0 | 1,085 (-13%) | 3mo | $145,000 | $134 | 41 |
| 203 E Pennsylvania St | 0.73mi | 2/1.0 (-1) | 1,100 (-12%) | 7mo | $104,000 | $95 | 31 |
Match score weights: distance 35% · size 25% · config 20% · recency 20%. Top-matched comps best support the ARV.
Projected returns pro-forma
-3.0% appreciation · 3.0% rent growth · sell at horizon
- IRR
- -13.6%
- Equity multiple
- 0.51×
- Total profit
- $-17,137
- Equity at exit
- $18,623
- IRR
- -4.8%
- Equity multiple
- 0.69×
- Total profit
- $-10,935
- Equity at exit
- $10,799
Cash invested: $34,972 (down + closing). Projections, not guarantees.
Landlord ↔ Tenant lean methodology
- Overall (STATE)
- 43 Moderately Tenant-Leaning
- State Illinois
- 43 Moderately Tenant-Leaning · D+7
- County
- — inherits STATE
- City
- — inherits STATE
ZIP-level market 62088
- Home prices YoY
- -21.7%
- Active inventory
- 35
- Price-to-rent
- 9.3×
Monthly cashflow live
- Estimated rent
- $1,114 medium interval (Pro) →
- Mortgage (P&I)
- −$655
- Tax from tax record
- −$125 /mo · $1,496/yr
- Insurance
- −$52
- HOA
- −$0
- Vacancy / Maint / Mgmt
- −$234
- Net cashflow
- $49
Break-even live
Sensitivity live
| Price | -10% $119 | -5% $84 | +0% $49 | +5% $13 | +10% $-22 |
|---|---|---|---|---|---|
| Rent | -10% $-39 | -5% $5 | +0% $49 | +5% $93 | +10% $137 |
| Rate | -1.0pp $112 | -0.5pp $81 | base $49 | +0.5pp $16 | +1.0pp $-17 |
UW: 25.0% down · 7.5% · 30yr · 1.5% tax · 5.0% vac · 8.0% maint · 8.0% mgmt
Financing live
Cash to close
- Down payment
- $31,225
- Closing costs
- $3,747
- Reserves months
- —
- Total cash needed
- —
Loan-product check · same deal, 3 products live
Conventional
25% down · 7.5% · 30yr
- Down + closing
- —
- Monthly P&I
- —
- Monthly cashflow
- —
- DSCR
- —
- Eligible?
- —
Personal DTI + credit; lowest rate.
DSCR
20% down · 8.5% · 30yr
- Down + closing
- —
- Monthly P&I
- —
- Monthly cashflow
- —
- DSCR
- —
- Eligible?
- —
No personal income docs; deal must DSCR.
Hard money
10% down · 12.0% · 12mo
- Down + closing
- —
- Monthly P&I
- —
- Monthly cashflow
- —
- DSCR
- —
- Eligible?
- —
Short-term bridge; refi at stabilization.
Listing history 14 events
-
2026-06-21days on market $124,900 Active 10 DOM
-
2026-06-21days on market $124,900 Active 9 DOM
-
2026-06-18days on market $124,900 Active 7 DOM
-
2026-06-17days on market $124,900 Active 6 DOM
-
2026-06-16days on market $124,900 Active 5 DOM
-
2026-06-15days on market $124,900 Active 4 DOM
-
2026-06-13days on market $124,900 Active 2 DOM
-
2026-06-12pricestatusdays on market $124,900 Active 1 DOM
-
2026-04-30status Pending
-
2026-04-15status Active
-
2026-03-31status Pending
-
2026-03-14price $138,000
-
2026-02-12$149,900 Active
-
2026-02-10historical $149,900
ⓘ Source: listings_history table (triggers on properties + properties_extension) + one-shot
backfill from property_details.listing_events for pre-trigger history.
Tax reassessment forecast IL · Partial reset (capped growth)
- Current annual tax
- $1,496 · $125/mo
- Projected year-2 tax
- $2,165 · $180/mo
- Expected delta
- +$670/yr (+$56/mo · 44.8%)
ⓘ Screening estimate from a state-policy table — verify with the county assessor before closing.
Climate risk First Street
- Flood 1/10 Low FEMA zone X · 0% chance over 30 yrs
- Wildfire 2/10 Low
- Heat 4/10 Moderate 7 d/yr ≥106°F today · 20 d/yr by 30 yrs out
- Wind 2/10 Low 100% chance of damaging wind over 30 yrs
- Air quality 2/10 Low 1 unhealthy d/yr today · 1 by 30 yrs out
Nearby sold comps map
Loading sold comps map…
Walkable amenities ~0.75 mi
Loading nearby amenities…
Taxation est. · year 1
- Rental income
- $13,373
- − Mortgage interest
- −$6,996
- − Property taxes
- −$1,496
- − Insurance
- −$624
- − Repairs & maintenance
- −$1,070
- − Management
- −$1,070
- − Depreciation
- −$3,633
- Taxable loss
- −$1,516
- Est. tax savings @ 24.0%
- +$364
- After-tax cash flow
- $949/yr
For passive investors: Depreciation is non-cash, so a rental often shows a tax loss while cash-flowing — sheltering income. Rental losses are passive: they offset passive income freely, and up to $25,000/yr can offset ordinary (W-2) income if you actively participate and your MAGI is under $100k (phasing out to $0 by $150k); unused losses carry forward. On sale, claimed depreciation is recaptured at up to 25%, and gains may owe capital-gains tax (a 1031 exchange can defer both). Figures are a year-1 estimate at your 24.0% rate — not tax advice; consult a CPA.
Schools (NCES district)
- District
- Staunton CUSD 6
- NCES district ID
- 1737590
- Math proficiency
- 22% ▬ 0.00%
- Reading proficiency
- 28% ▼ -2.00%
- Median HH income
- $49,408
- Composite
- 21.98/100
- National rank
- #8211
- State rank
- #323 of 620 in IL
Livability — Staunton
- Score
- 59/100
- State rank
- #1073
- US rank
- #20495
Category grades
Schools grade is shown separately in the Schools card above.
Census & demographics
- Census place
- Staunton, IL
- City population
- 6,482
- Population (ZIP)
- 6,482
Population outlook (Macoupin County) Hauer SSP2
- Today (2025)
- 42,867 people
- By 2030
- 40,796 · -4.8%
- By 2040
- 36,135 · -15.7%
- By 2050
- 31,469 · -26.6%
- By 2075
- 22,102 · -48.4%
- By 2100
- 15,380 · -64.1%
Race, ethnicity, and origin ACS 2023
- Neighborhood character
- Predominantly White (95%)
- Race & ethnicity
- White 95% Two or more races 3% Asian 2%
- Common ancestry
- Italian 3% Lithuanian 3% Slovak 3%
- Foreign-born
- 2% · South Korea, China
- Languages at home
- 97% English-only · Korean 1% Chinese 1%
Political lean MEDSL · Macoupin
- 2024 margin
- Solid R (+39.2) · D 29.4% · R 68.7% · Other 1.9%
- 2008→2024 swing
- -49.0pp toward R · 2008: 9.8pp · 2024: -39.2pp
- All cycles
- 2024: R+39.2 2020: R+36.5 2016: R+35.0 2012: R+7.0 2008: D+9.8
Not yet ingested
- Civics
- —
Market trends
- HPI YoY
- ▼ -53.97%
- Current HPI
- 195.0059
- Rent YoY
- —
- Metro
- —
- State GDP YoY
- ▲ 1.59%
- F500 in state
- 60
Industry mix (Fortune 500 HQ in IL)
| Industry | F500 HQs | Revenue |
|---|---|---|
| Insurance | 4 | $201B |
|
||
| Consumer Goods | 4 | $87B |
|
||
| Industrial Machinery | 3 | $64B |
|
||
| Healthcare | 2 | $55B |
|
||
| Retail / Pharmacy | 1 | $148B |
|
||
| Agriculture / Food | 1 | $86B |
|
||
Price history
-7.9% since first listed6 events — show timeline
- 2026-04-30 Pending — MARIS as Distributed by MLS Grid
- 2026-04-15 Relisted — MARIS as Distributed by MLS Grid
- 2026-03-31 Pending — MARIS as Distributed by MLS Grid
- 2026-03-14 Price Changed $138,000 MARIS as Distributed by MLS Grid
- 2026-02-12 Listed $149,900 MARIS as Distributed by MLS Grid
- 2026-02-10 Coming Soon $149,900 MARIS as Distributed by MLS Grid
Property tax history
+5.2%/yrLatest (2024): $1,496 · +26.4% YoY. Source: county tax records.
Cash-flow waterfall
monthlySold comps — $/sqft
last 12 mo · ≤1 miLoading sold comps…