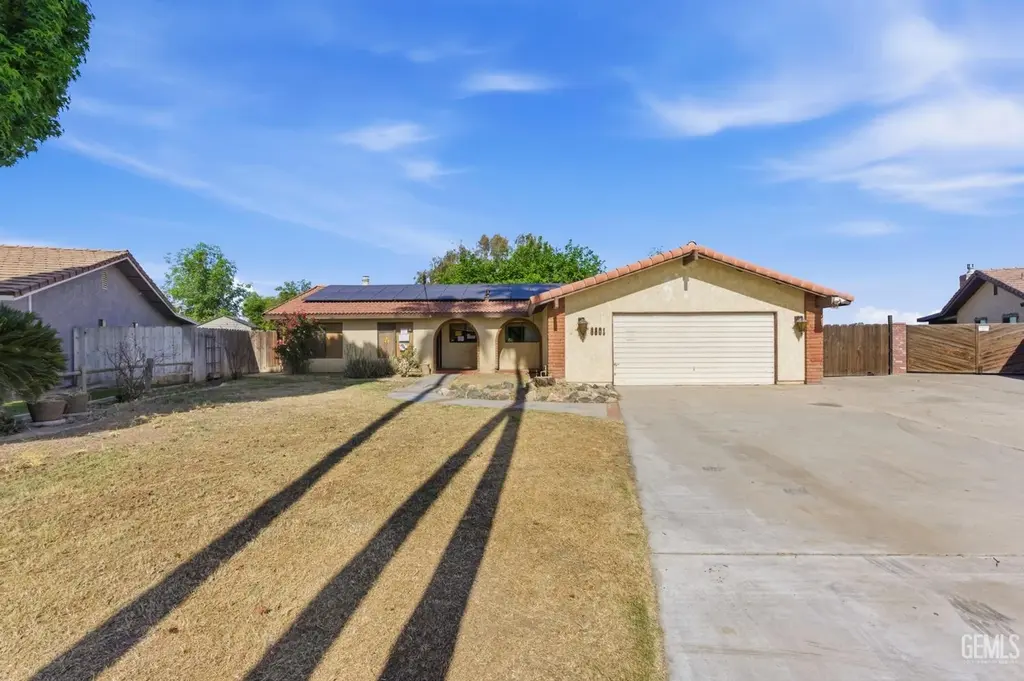
8801 Sorrel · Greenfield, CA
Flood risk 1/10 · Minimal
- FEMA flood zone
- X (unshaded)
- Chance of flooding over 30 yrs
- 0.0%
- Est. flood insurance / yr
- $507 – $1,088
Fire risk 1/10 · Minimal
- Est. fire insurance / yr
- $659 – $1,223
Heat risk 8/10 · Major
- Hot days now (above 105°F)
- 7 days/yr
- Hot days in 30 yrs
- 19 days/yr
Wind risk 1/10 · Minimal
- Chance of severe wind over 30 yrs
- —
Air-quality risk 10/10 · Severe
- Unhealthy air days now
- 33 days/yr
- Unhealthy air days in 30 yrs
- 37 days/yr
Risk factors via First Street. Map © Google.
Why this score? — see what drove the D grade
The composite is a weighted blend of 9 inputs, each scored 0–100. Each bar is that input's sub-score; the figure is the points it added to the 100-point composite (weight × sub-score).
- ARV discount +13.7/15.0
- Cash flow +9.6/30.0
- Rent growth +3.9/5.0
- Livability +3.5/5.0
- Schools +3.4/10.0
- DSCR +2.7/10.0
- Condition / age +2.5/5.0
- 1% rule +2.1/10.0
- Appreciation +0.0/10.0
$374,900
🖨 Deal sheet (PDF) 📄 Offer letter ✓ Due diligence
Listing remarks MLS
Great opportunity! This spacious home features a generous floor plan with 4 bedrooms, 2.5 bathrooms, a large living room, and kitchenall situated on a large lot. A detached unit on the property has fire damage, offering additional potential for renovation or redevelopment. Ready for you to make it your own!
Key facts
- Large lot
- Additional potential
- Detached unit
Tags
Neighborhood map
What this means for you Summary
Snapshot
- This is a 4-bed/3.0-bath single-family listed at $375k.
Deal economics
- At list price, monthly cash flow is $-251 ($-3k/yr) — negative.
- To cash-flow at today's rent, offer at most $331k (11.8% below list).
- To meet the 1% rule (rent ≥ 1% of price), the offer needs to be $268k (28.6% below list).
- Recommended offer: $268k (28.6% below list) — sets the bar for 1% rule.
Location & tenants
- Location reads 69/100 on livability (#258 in CA) — a middle-class / working-renter tenant base. Strengths: commute A+, housing A+, health & safety A; Watch: amenities D, crime D-, cost of living F.
- Kern High (urban): math 21% / reading 51% proficiency, ranked #860 of 1,400 in CA (top 61%) — families likely to look elsewhere, expect single-tenant / working-renter base with shorter leases.
- Zoned schools: Golden Valley High (reading 77%, 2,533 students, 91% FRL).
- Market conditions: Rents rising fast (+5.7%/yr); 314 active listings in the ZIP; 15 comparable units currently listed for rent nearby; rentals leasing fast (median 5d on market — plan ~1-2 weeks tenant-placement turnaround); 3,244 units permitted in Kern County in 2024 (73 in 5+ unit buildings).
- At $2,676/mo this rent would consume 57% of the median local household income ($56k/yr) (locally 3246% of renters already pay >50% of income on rent) — very limited rent-growth headroom before tenants either downsize or default.
Forward outlook
- Local home prices are declining (-3.0%/yr); year-one equity from $3k of loan paydown is wiped out by about $11k of value loss. Plan a longer hold.
- Kern County population projected at +17% by 2050 — long-run rental-demand tailwind backs the buy-and-hold thesis.
Negotiation context
- It's been on market 73 days — a 6% lower offer ($352k) is reasonable based on typical stale-listing flexibility.
- 2 sale attempts with the ask held roughly flat each time — persistent listings suggest the price (not the market) is what's stuck; bring a comps-based counter.
- Current owner paid $122k; list at $375k implies a 207% gain — meaningful room to come down on a strong offer.
Risks & watch-outs
- Climate carrying-cost: extreme-heat days projected 7→19/yr by 2055 (HVAC capex compounding) — expect insurance premiums to compound above CPI over the hold.
Questions for the listing agent
- What do current leases actually rent for vs. the listed asking? Can we see a recent rent roll and the last 12 months of T-12 income?
- It's been on market 73 days. Have you received any prior offers? Is the seller open to a 29% concession, seller financing, or rate buy-down credit?
- Built in 1979 — when were the roof, HVAC, electrical panel, plumbing, and water heater last replaced?
- Why hasn't it sold? Are there any deal-killer items the seller is aware of (foundation, flood, title, zoning, code violations)?
- Is there a deadline driving the sale (1031 exchange, divorce, estate, relocation)? That informs how much negotiation room exists.
- Schools are F-rated, which usually means shorter tenancies and higher turnover. Who's the typical renter profile here, and what's been the actual vacancy rate?
- Crime grade is D in this area — have there been break-ins, vandalism, or insurance claims at this property in the last 3 years? What carrier currently insures it and at what premium?
- The area grade is low — what's the realistic commute time and amenity access for the typical tenant pool here? Any planned neighborhood developments (good or bad) we should know about?
- What's the average days-on-market for RENTAL listings here right now (not sales)? A rising rental-DOM trend means longer vacancies and softer asking-rent achievability than the comps imply.
- What's the recent tenant-quality profile in this submarket — average credit score on applications, eviction rate, late-payment / NSF rate, and stable-employment percentage? A property-management company in the area should have these aggregated.
- How much new for-sale + rental construction is in the pipeline within 1–3 miles? Heavy new supply typically softens prices + rents 12–24 months out; constrained supply supports both.
Investment metrics
- 1% rule
- 0.71% ✗
- Cap rate
- 5.49%
- Cash-on-cash
- -2.86%
- DSCR
- 0.87
- GRM
- 11.7
CMA / ARV
- ARV (median comp)
- $434,720
- List price
- $374,900
- Delta
- -13.76%
- Verdict
- UNDERPRICED
- Comps
- 20 within 1.0 mi
Show comp detail 5 sales within ~0.75 mi
| Address | Dist | Beds/Ba | Sqft | Sold | Price | $/sf | Match |
|---|---|---|---|---|---|---|---|
| 8805 Clydesdale St | 0.09mi | 5/3.0 (+1) | 2,705 (+11%) | 24mo | $535,000 | $198 | 53 |
| 9201 Millfort St | 0.50mi | 4/2.0 | 2,362 (-3%) | 22mo | $495,000 | $210 | 49 |
| 1124 Stub Oak Ave | 0.48mi | 3/2.0 (-1) | 2,250 (-8%) | 21mo | $469,500 | $209 | 38 |
| 900 charterten Ave | 0.53mi | 4/2.8 | 2,129 (-13%) | 20mo | $440,000 | $207 | 36 |
| 2609 Tara Leigh Dr | 0.71mi | 4/2.5 | 2,107 (-14%) | 23mo | $435,000 | $206 | 23 |
Match score weights: distance 35% · size 25% · config 20% · recency 20%. Top-matched comps best support the ARV.
Projected returns pro-forma
-3.0% appreciation · 5.71% rent growth · sell at horizon
- IRR
- -18.4%
- Equity multiple
- 0.34×
- Total profit
- $-69,315
- Equity at exit
- $55,899
- IRR
- -6.6%
- Equity multiple
- 0.54×
- Total profit
- $-48,801
- Equity at exit
- $32,415
Cash invested: $104,972 (down + closing). Projections, not guarantees.
Landlord ↔ Tenant lean methodology
- Overall (STATE)
- 18 Strongly Tenant-Friendly
- State California
- 18 Strongly Tenant-Friendly · D+13
- County
- — inherits STATE
- City
- — inherits STATE
ZIP-level market 93307
- Rents YoY
- 5.7%
- Active inventory
- 314
- Price-to-rent
- 11.7×
Monthly cashflow live
- Estimated rent
- $2,676 high interval (Pro) →
- Mortgage (P&I)
- −$1,966
- Tax from tax record
- −$242 /mo · $2,909/yr
- Insurance
- −$156
- HOA
- −$0
- Vacancy / Maint / Mgmt
- −$562
- Net cashflow
- $-251
Break-even live
Sensitivity live
| Price | -10% $-38 | -5% $-144 | +0% $-251 | +5% $-357 | +10% $-463 |
|---|---|---|---|---|---|
| Rent | -10% $-462 | -5% $-356 | +0% $-251 | +5% $-145 | +10% $-39 |
| Rate | -1.0pp $-62 | -0.5pp $-155 | base $-251 | +0.5pp $-348 | +1.0pp $-447 |
UW: 25.0% down · 7.5% · 30yr · 1.5% tax · 5.0% vac · 8.0% maint · 8.0% mgmt
Financing live
Cash to close
- Down payment
- $93,725
- Closing costs
- $11,247
- Reserves months
- —
- Total cash needed
- —
Loan-product check · same deal, 3 products live
Conventional
25% down · 7.5% · 30yr
- Down + closing
- —
- Monthly P&I
- —
- Monthly cashflow
- —
- DSCR
- —
- Eligible?
- —
Personal DTI + credit; lowest rate.
DSCR
20% down · 8.5% · 30yr
- Down + closing
- —
- Monthly P&I
- —
- Monthly cashflow
- —
- DSCR
- —
- Eligible?
- —
No personal income docs; deal must DSCR.
Hard money
10% down · 12.0% · 12mo
- Down + closing
- —
- Monthly P&I
- —
- Monthly cashflow
- —
- DSCR
- —
- Eligible?
- —
Short-term bridge; refi at stabilization.
Rent comps 15 comps
| Address | Beds | Baths | Sqft | Rent | $/sqft | DOM | Units | Dist |
|---|---|---|---|---|---|---|---|---|
| 2402 Lebow Ct Bakersfield, CA | 4.0 | 2.0 | 2100 | $2,495 | $1.19 | 45d | 1 | 0.55mi |
| 9118 Davedaly Ct Bakersfield, CA | 3.0 | 2.0 | 1700 | $2,300 | $1.35 | 4d | 1 | 0.56mi |
| 8211 Slider Dr Bakersfield, CA | 4.0 | 2.0 | 2100 | $2,550 | $1.21 | 4d | 1 | 0.57mi |
| 2401 Donnalynn St Bakersfield, CA | 4.0 | 2.0 | 2048 | $3,900 | $1.90 | 4d | 1 | 0.61mi |
| 8602 Vincenso Way Bakersfield, CA | 3.0 | 2.0 | 1607 | $2,550 | $1.59 | 4d | 1 | 0.68mi |
| 265 Hudson Dr Bakersfield, CA | 4.0 | 2.0 | 1766 | $2,900 | $1.64 | 4d | 1 | 0.76mi |
| 2717 Mercedes Dr Bakersfield, CA | 4.0 | 2.0 | 1900 | $2,600 | $1.37 | 21d | 1 | 0.81mi |
| 3106 Stone Meadows Dr Bakersfield, CA | 4.0 | 3.0 | 2223 | $2,700 | $1.21 | 4d | 1 | 0.98mi |
| 8203 Libby Ct Bakersfield, CA | 4.0 | 2.0 | 1715 | $2,400 | $1.40 | 23d | 1 | 1.09mi |
| 301 Alysheba Dr Bakersfield, CA | 4.0 | 2.5 | 1864 | $2,650 | $1.42 | 12d | 1 | 1.13mi |
| 2922 Paradise Point Pl Bakersfield, CA | 4.0 | 3.0 | 2079 | $2,650 | $1.27 | 4d | 1 | 1.14mi |
| 7210 Olen Arnold Ave Bakersfield, CA | 4.0 | 3.0 | 2249 | $2,500 | $1.11 | 45d | 1 | 1.28mi |
| 6513 Pine View Dr Bakersfield, CA | 3.0 | 2.5 | 1600 | $1,950 | $1.22 | 4d | 1 | 1.31mi |
| 8501 Tamworth St Bakersfield, CA | 3.0 | 2.0 | 1796 | $2,795 | $1.56 | 16d | 1 | 1.31mi |
| 415 Welch Ave Bakersfield, CA | 4.0 | 2.0 | 1998 | $2,400 | $1.20 | 4d | 1 | 1.33mi |
Listing history 22 events
-
2026-06-21days on market $374,900 Active 73 DOM
-
2026-06-18days on market $374,900 Active 70 DOM
-
2026-06-17days on market $374,900 Active 69 DOM
-
2026-06-16pricedays on market $374,900 Active 68 DOM
-
2026-06-15days on market $379,000 Active 67 DOM
-
2026-06-14days on market $379,000 Active 65 DOM
-
2026-06-13days on market $379,000 Active 64 DOM
-
2026-06-10days on market $379,000 Active 62 DOM
-
2026-06-09days on market $379,000 Active 61 DOM
-
2026-06-08days on market $379,000 Active 60 DOM
-
2026-06-07days on market $379,000 Active 59 DOM
-
2026-06-05days on market $379,000 Active 56 DOM
-
2026-06-03days on market $379,000 Active 55 DOM
-
2026-06-03days on market $379,000 Active 54 DOM
-
2026-06-01days on market $379,000 Active 53 DOM
-
2026-05-31days on market $379,000 Active 52 DOM
-
2026-05-13$379,000 Active 308-char remark
Show marketing remark (308 chars)
Great opportunity! This spacious home features a generous floor plan with 4 bedrooms, 2.5 bathrooms, a large living room, and kitchenall situated on a large lot. A detached unit on the property has fire damage, offering additional potential for renovation or redevelopment. Ready for you to make it your own!
-
2026-05-08price $379,000 315-char remark
Show marketing remark (315 chars)
Great opportunity! This spacious home features a generous floor plan with 4 bedrooms, 2.5 bathrooms, a large living room, and kitchen—all situated on a large lot. A detached unit on the property has fire damage, offering additional potential for renovation or redevelopment. Ready for you to make it your own!
-
2026-04-30price $389,000 315-char remark
Show marketing remark (315 chars)
Great opportunity! This spacious home features a generous floor plan with 4 bedrooms, 2.5 bathrooms, a large living room, and kitchen—all situated on a large lot. A detached unit on the property has fire damage, offering additional potential for renovation or redevelopment. Ready for you to make it your own!
-
2026-04-09$399,000 Active 315-char remark
Show marketing remark (315 chars)
Great opportunity! This spacious home features a generous floor plan with 4 bedrooms, 2.5 bathrooms, a large living room, and kitchen—all situated on a large lot. A detached unit on the property has fire damage, offering additional potential for renovation or redevelopment. Ready for you to make it your own!
-
1995-11-10soldstatus $122,000
-
1980-06-30soldstatus $86,900
ⓘ Source: listings_history table (triggers on properties + properties_extension) + one-shot
backfill from property_details.listing_events for pre-trigger history.
Tax reassessment forecast CA · Resets to sale price
- Current annual tax
- $2,909 · $242/mo
- Projected year-2 tax
- $2,909 · $242/mo
- Expected delta
- $0/yr ($0/mo · 0.0%)
ⓘ Screening estimate from a state-policy table — verify with the county assessor before closing.
Climate risk First Street
- Flood 1/10 Low FEMA zone X (unshaded) · 0% chance over 30 yrs
- Wildfire 1/10 Low
- Heat 8/10 Severe 7 d/yr ≥105°F today · 19 d/yr by 30 yrs out
- Wind 1/10 Low
- Air quality 10/10 Extreme 33 unhealthy d/yr today · 37 by 30 yrs out
Nearby sold comps map
Loading sold comps map…
Walkable amenities ~0.75 mi
Loading nearby amenities…
Taxation est. · year 1
- Rental income
- $32,112
- − Mortgage interest
- −$21,000
- − Property taxes
- −$2,909
- − Insurance
- −$1,874
- − Repairs & maintenance
- −$2,569
- − Management
- −$2,569
- − Depreciation
- −$10,906
- Taxable loss
- −$9,716
- Est. tax savings @ 24.0%
- +$2,332
- After-tax cash flow
- $-675/yr
For passive investors: Depreciation is non-cash, so a rental often shows a tax loss while cash-flowing — sheltering income. Rental losses are passive: they offset passive income freely, and up to $25,000/yr can offset ordinary (W-2) income if you actively participate and your MAGI is under $100k (phasing out to $0 by $150k); unused losses carry forward. On sale, claimed depreciation is recaptured at up to 25%, and gains may owe capital-gains tax (a 1031 exchange can defer both). Figures are a year-1 estimate at your 24.0% rate — not tax advice; consult a CPA.
Schools (NCES district)
- District
- Kern High
- NCES district ID
- 0619540
- Math proficiency
- 21% ▬ 0.00%
- Reading proficiency
- 51% ▲ 2.00%
- Median HH income
- $49,686
- Composite
- 33.68/100
- National rank
- #10443
- State rank
- #860 of 1400 in CA
Livability — Greenfield
- Score
- 69/100
- State rank
- #258
- US rank
- #8416
Category grades
Schools grade is shown separately in the Schools card above.
Census & demographics
- Census place
- Greenfield, CA
- County
- Kern County · 710,371 people
- Metro
- Bakersfield, CA
- Population (ZIP)
- 85,945
- Household income
- $56,446
- Rent vs Own
- Severe rent burden
- 3246.0
Population outlook (Kern County) Hauer SSP2
- Today (2025)
- 947,286 people
- By 2030
- 978,984 · +3.3%
- By 2040
- 1,045,018 · +10.3%
- By 2050
- 1,105,232 · +16.7%
- By 2075
- 1,229,538 · +29.8%
- By 2100
- 1,238,059 · +30.7%
Race, ethnicity, and origin ACS 2023
- Neighborhood character
- Predominantly Hispanic (80%)
- Race & ethnicity
- Hispanic / Latino 80% Two or more races 12% White 10% Black 6% Asian 3% Native American 1%
- Hispanic origin (detail)
- Mexican 73%
- Common ancestry
- Lithuanian 0%
- Foreign-born
- 31% · Canada
- Languages at home
- 28% English-only · Spanish 69% Other Indo-European 1% Arabic 1%
Political lean MEDSL · Kern
- 2024 margin
- Strong R (+21.1) · D 38.2% · R 59.3% · Other 2.5%
- 2008→2024 swing
- -3.3pp toward R · 2008: -17.8pp · 2024: -21.1pp
- All cycles
- 2024: R+21.1 2020: R+10.2 2016: R+15.0 2012: R+20.9 2008: R+17.8
Not yet ingested
- Civics
- —
Market trends
- HPI YoY
- ▼ -263.59%
- Current HPI
- 447.1746
- Rent YoY
- ▲ 5.71%
- Metro
- Bakersfield, CA
- State GDP YoY
- ▲ 3.21%
- F500 in state
- 116
Industry mix (Fortune 500 HQ in CA)
| Industry | F500 HQs | Revenue |
|---|---|---|
| Technology | 27 | $1,492B |
|
||
| Financial Services | 3 | $174B |
|
||
| Retail | 3 | $44B |
|
||
| Insurance | 3 | $26B |
|
||
| Media / Entertainment | 2 | $115B |
|
||
| Pharmaceuticals / Biotech | 2 | $62B |
|
||
Price history
+336.1% since first listed6 events — show timeline
- 2026-05-13 Listed $379,000 GEMLS
- 2026-05-08 Price Changed $379,000 CRMLS
- 2026-04-30 Price Changed $389,000 CRMLS
- 2026-04-09 Listed $399,000 CRMLS
- 1995-11-10 Sold (Public Records) $122,000 Public Records
- 1980-06-30 Sold (Public Records) $86,900 Public Records
Property tax history
+2.8%/yrLatest (2025): $2,909 · +2.4% YoY. Source: county tax records.
Cash-flow waterfall
monthlySold comps — $/sqft
last 12 mo · ≤1 miLoading sold comps…