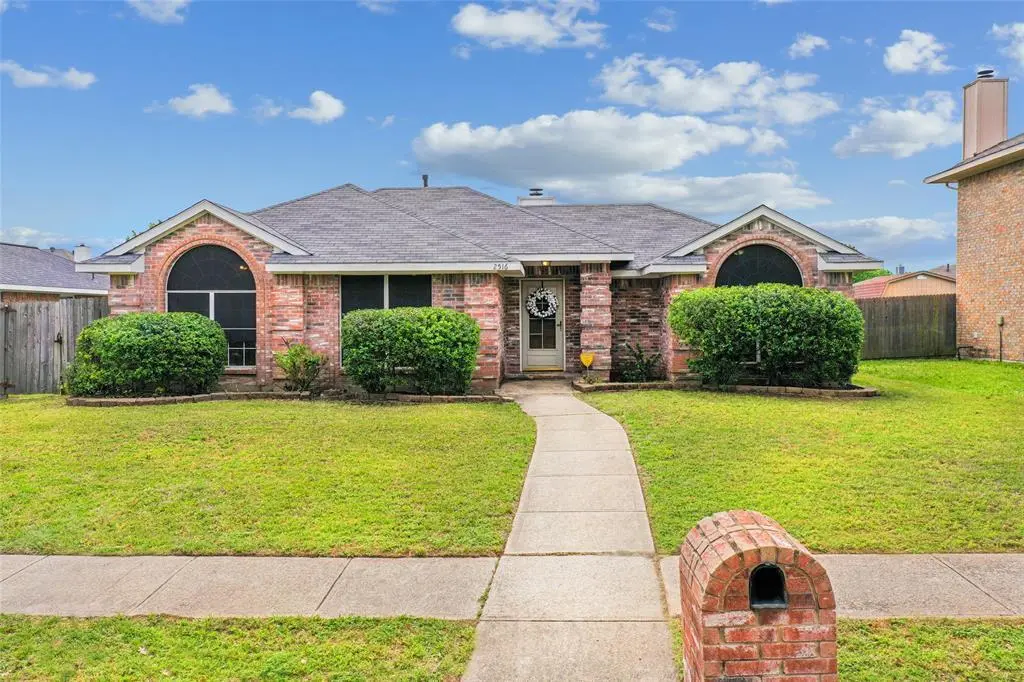
2516 Buck Dr · Mesquite, TX
Flood risk 1/10 · Minimal
- FEMA flood zone
- X (unshaded)
- Chance of flooding over 30 yrs
- 0.0%
- Est. flood insurance / yr
- $507 – $1,088
Fire risk 3/10 · Minor
- Est. fire insurance / yr
- $1,222 – $2,270
Heat risk 8/10 · Major
- Hot days now (above 110°F)
- 7 days/yr
- Hot days in 30 yrs
- 25 days/yr
Wind risk 6/10 · Moderate
- Chance of severe wind over 30 yrs
- 27.0%
Air-quality risk 2/10 · Minimal
- Unhealthy air days now
- 1 days/yr
- Unhealthy air days in 30 yrs
- 1 days/yr
Risk factors via First Street. Map © Google.
Why this score? — see what drove the D- grade
The composite is a weighted blend of 9 inputs, each scored 0–100. Each bar is that input's sub-score; the figure is the points it added to the 100-point composite (weight × sub-score).
- Cash flow +10.5/30.0
- ARV discount +10.5/15.0
- 1% rule +3.6/10.0
- Livability +3.5/5.0
- DSCR +3.0/10.0
- Schools +2.9/10.0
- Rent growth +2.5/5.0
- Condition / age +2.5/5.0
- Appreciation +0.0/10.0
$299,000
🖨 Deal sheet (PDF) 📄 Offer letter ✓ Due diligence
Listing remarks
Beautiful 3 bedroom, 2 bath home in the highly sought after Creek Crossing Estates! You’ll love the flexibility this home offers with both a dedicated dining room and a separate breakfast nook. The primary suite is generously oversized with plenty of room to create your own private sitting area, reading nook or workspace. Featuring thoughtful updates including NEW granite countertops, NEW modern kitchen sink and brand NEW carpet for a fresh, move in feel. Step outside and you’ll find a backyard that’s just as impressive! Whether you’re envisioning a pool, outdoor kitchen, play area or simply room to spread out and relax this yard gives you the freedom to make it your
Key facts
- New carpet
- 7,187 sq ft lot
- 2 garage spots
Tags
Property features AI
Finance
- HOA & community: No homeowners association
Exterior
- Parking: Two covered parking spaces; Attached 2-car garage (approximately 18' x 20'); Additional/oversized parking and boat parking available; Garage faces rear
- Utilities: City water; City sewer; Not in a municipal utility district
- Home design: Single family residence; Residential property; One story; Built in 1996
- Construction: Brick construction; Composition roof; Slab foundation
- Exterior features: Landscaped yard; Large backyard with grass; Back yard wood fencing; Alley access; Asphalt driveway and curbs
Interior
- Kitchen: Gas cooktop; Microwave; Refrigerator; Dishwasher; Disposal
- Bedrooms: Primary bedroom on main level with built-in cabinets, garden tub, separate shower and separate vanities; Two additional bedrooms on main level (each approximately 10 x 10)
- Flooring: Carpet; Laminate; Luxury vinyl plank; Tile
- Bathrooms: Two full bathrooms; Primary bathroom with garden tub, separate shower and separate vanities
- Heating & cooling: Central heating; Central air conditioning; Living room fireplace with wood-burning hearth and gas starter
- Interior features: Cable TV available; Walk-in closets; One living area; Two dining areas; 9 total rooms; One-level layout
Neighborhood map
What this means for you Summary
Snapshot
- This is a 3-bed/2.0-bath single-family listed at $299k.
Deal economics
- At list price, monthly cash flow is $-151 ($-2k/yr) — negative.
- To cash-flow at today's rent, offer at most $272k (8.9% below list).
- To meet the 1% rule (rent ≥ 1% of price), the offer needs to be $258k (13.6% below list).
- Recommended offer: $258k (13.6% below list) — sets the bar for 1% rule.
- Cap rate 5.7% vs local median 4.4% in Mesquite — meaningfully above typical; check what's discounted (condition, days-on-market, listing class) to confirm the premium yield is real.
Location & tenants
- Location reads 70/100 on livability (#358 in TX) — a middle-class / working-renter tenant base. Strengths: cost of living A+, housing A+, health & safety A-; Watch: crime F, commute F.
- Mesquite ISD (suburban): math 35% / reading 32% proficiency, ranked #536 of 826 in TX (top 65%) — families likely to look elsewhere, expect single-tenant / working-renter base with shorter leases; 63% free/reduced lunch — lower-income household profile, screen leases tightly.
- Zoned schools: Smith El (math 26% / reading 32%, grade F, #2,668 of 4,322 statewide, top 63%, 582 students, 76% FRL).
- Market conditions: Rents flat; 590 active listings in the ZIP; 37 comparable units currently listed for rent nearby; rentals at typical pace (median 18d on market — plan ~3-4 weeks tenant-placement turnaround); high-income renter base; 12,577 units permitted in Dallas County in 2024 (6,829 in 5+ unit buildings).
Forward outlook
- Local home prices are declining (-3.0%/yr); year-one equity from $2k of loan paydown is wiped out by about $9k of value loss. Plan a longer hold.
- Dallas County population projected at +35% by 2050 — long-run rental-demand tailwind backs the buy-and-hold thesis.
Negotiation context
- It's been on market 50 days — a 3% lower offer ($290k) is reasonable based on typical stale-listing flexibility.
- 5 sale attempts since 17y ago; this cycle's ask has dropped $17k (5%) from the opening price — seller is motivated, your offer sets the floor, not the list.
Risks & watch-outs
- Climate carrying-cost: major wind risk, 27% chance of damaging wind over 30y; extreme-heat days projected 7→25/yr by 2055 (HVAC capex compounding) — expect insurance premiums to compound above CPI over the hold.
Questions for the listing agent
- What do current leases actually rent for vs. the listed asking? Can we see a recent rent roll and the last 12 months of T-12 income?
- It's been on market 50 days. Have you received any prior offers? Is the seller open to a 14% concession, seller financing, or rate buy-down credit?
- Is there a deadline driving the sale (1031 exchange, divorce, estate, relocation)? That informs how much negotiation room exists.
- Crime grade is F in this area — have there been break-ins, vandalism, or insurance claims at this property in the last 3 years? What carrier currently insures it and at what premium?
- The area grade is low — what's the realistic commute time and amenity access for the typical tenant pool here? Any planned neighborhood developments (good or bad) we should know about?
- What's the average days-on-market for RENTAL listings here right now (not sales)? A rising rental-DOM trend means longer vacancies and softer asking-rent achievability than the comps imply.
- What's the recent tenant-quality profile in this submarket — average credit score on applications, eviction rate, late-payment / NSF rate, and stable-employment percentage? A property-management company in the area should have these aggregated.
- How much new for-sale + rental construction is in the pipeline within 1–3 miles? Heavy new supply typically softens prices + rents 12–24 months out; constrained supply supports both.
Investment metrics
- 1% rule
- 0.86% ✗
- Cap rate
- 5.69%
- Cash-on-cash
- -2.17%
- DSCR
- 0.90
- GRM
- 9.6
CMA / ARV
- ARV (median comp)
- $319,980
- List price
- $299,000
- Delta
- -6.56%
- Verdict
- FAIR
- Comps
- 20 within 1.0 mi
Show comp detail 12 sales within ~0.75 mi
| Address | Dist | Beds/Ba | Sqft | Sold | Price | $/sf | Match |
|---|---|---|---|---|---|---|---|
| 1904 Osage Trl | 0.46mi | 3/2.0 | 1,498 (-4%) | 5mo | $318,480 | $213 | 67 |
| 2516 Mcnally Dr | 0.47mi | 3/2.0 | 1,649 (+6%) | 5mo | $314,990 | $191 | 65 |
| 2521 Breakaway Dr | 0.64mi | 3/2.0 | 1,571 (+1%) | 5mo | $324,990 | $207 | 65 |
| 2603 Palisades Pl | 0.45mi | 3/2.0 | 1,686 (+8%) | 5mo | $210,000 | $125 | 61 |
| 2505 Russell Way | 0.53mi | 3/2.0 | 1,649 (+6%) | 6mo | $309,990 | $188 | 61 |
| 2017 Paradise Valley Dr | 0.47mi | 3/2.5 | 1,699 (+9%) | 1mo | $339,834 | $200 | 60 |
| 1609 Quapaw Trl | 0.71mi | 3/2.0 | 1,510 (-3%) | 4mo | $314,990 | $209 | 58 |
| 2516 Russell Way | 0.50mi | 3/2.5 | 1,699 (+9%) | 3mo | $314,990 | $185 | 57 |
| 1844 Osage Trl | 0.53mi | 3/2.0 | 1,695 (+8%) | 5mo | $319,990 | $189 | 57 |
| 2528 Breakaway Dr | 0.62mi | 3/2.5 | 1,699 (+9%) | 5mo | $339,990 | $200 | 50 |
| 2105 Highwood St | 0.70mi | 3/2.0 | 1,722 (+10%) | 3mo | $300,000 | $174 | 48 |
| 2024 Austin Dr | 0.67mi | 4/2.0 (+1) | 1,783 (+14%) | 0mo | $297,800 | $167 | 40 |
Match score weights: distance 35% · size 25% · config 20% · recency 20%. Top-matched comps best support the ARV.
Projected returns pro-forma
-3.0% appreciation · 0.07% rent growth · sell at horizon
- IRR
- -23.4%
- Equity multiple
- 0.22×
- Total profit
- $-65,365
- Equity at exit
- $44,582
- IRR
- -29.7%
- Equity multiple
- -0.16×
- Total profit
- $-97,484
- Equity at exit
- $25,852
Cash invested: $83,720 (down + closing). Projections, not guarantees.
Landlord ↔ Tenant lean methodology
- Overall (STATE)
- 87 Strongly Landlord-Friendly
- State Texas
- 87 Strongly Landlord-Friendly · R+5
- County
- — inherits STATE
- City
- — inherits STATE
ZIP-level market 75181
- Home prices YoY
- -9.4%
- Rents YoY
- 0.1%
- Active inventory
- 590
- Price-to-rent
- 9.6×
Monthly cashflow live
- Estimated rent
- $2,584 high interval (Pro) →
- Mortgage (P&I)
- −$1,568
- Tax from tax record
- −$500 /mo · $5,996/yr
- Insurance
- −$125
- HOA
- −$0
- Vacancy / Maint / Mgmt
- −$543
- Net cashflow
- $-151
Break-even live
Sensitivity live
| Price | -10% $18 | -5% $-67 | +0% $-151 | +5% $-236 | +10% $-320 |
|---|---|---|---|---|---|
| Rent | -10% $-355 | -5% $-253 | +0% $-151 | +5% $-49 | +10% $53 |
| Rate | -1.0pp $-1 | -0.5pp $-75 | base $-151 | +0.5pp $-229 | +1.0pp $-308 |
UW: 25.0% down · 7.5% · 30yr · 1.5% tax · 5.0% vac · 8.0% maint · 8.0% mgmt
Financing live
Cash to close
- Down payment
- $74,750
- Closing costs
- $8,970
- Reserves months
- —
- Total cash needed
- —
Loan-product check · same deal, 3 products live
Conventional
25% down · 7.5% · 30yr
- Down + closing
- —
- Monthly P&I
- —
- Monthly cashflow
- —
- DSCR
- —
- Eligible?
- —
Personal DTI + credit; lowest rate.
DSCR
20% down · 8.5% · 30yr
- Down + closing
- —
- Monthly P&I
- —
- Monthly cashflow
- —
- DSCR
- —
- Eligible?
- —
No personal income docs; deal must DSCR.
Hard money
10% down · 12.0% · 12mo
- Down + closing
- —
- Monthly P&I
- —
- Monthly cashflow
- —
- DSCR
- —
- Eligible?
- —
Short-term bridge; refi at stabilization.
Rent comps 37 comps
| Address | Beds | Baths | Sqft | Rent | $/sqft | DOM | Units | Dist |
|---|---|---|---|---|---|---|---|---|
| 2600 Waterloo Ln Mesquite, TX | 3.0 | 2.0 | 1460 | $1,900 | $1.30 | 44d | 1 | 0.43mi |
| 1809 Osage Trl Mesquite, TX | 4.0 | 2.0 | 2022 | $2,599 | $1.29 | 18d | 1 | 0.53mi |
| 1729 Hazer Ln Mesquite, TX | 3.0 | 2.0 | 1498 | $2,400 | $1.60 | 21d | 1 | 0.57mi |
| 2302 Highbank Dr Mesquite, TX | 3.0 | 2.0 | 1783 | $2,145 | $1.20 | 44d | 1 | 0.68mi |
| 2621 Ash Crk Mesquite, TX | 3.0 | 2.0 | 1843 | $2,299 | $1.25 | 44d | 1 | 0.74mi |
| 2314 Stillwater Dr Mesquite, TX | 4.0 | 2.0 | 1995 | $2,600 | $1.30 | 25d | 1 | 0.82mi |
| 2524 Park Valley Dr Mesquite, TX | 3.0 | 2.0 | 1360 | $2,085 | $1.53 | 2d | 1 | 0.82mi |
| 2812 Clearmeadow Dr Mesquite, TX | 4.0 | 2.0 | 1837 | $2,800 | $1.52 | 2d | 1 | 0.83mi |
| 2321 Bent Brook Dr Mesquite, TX | 3.0 | 2.0 | 2029 | $2,460 | $1.21 | 8d | 1 | 0.86mi |
| 2338 Stillwater Dr Mesquite, TX | 3.0 | 2.0 | 1765 | $2,300 | $1.30 | 21d | 1 | 0.87mi |
| 1615 Ariel Dr Mesquite, TX | 4.0 | 2.0 | 2002 | $3,200 | $1.60 | 2d | 1 | 0.89mi |
| 2004 Poppy Way Mesquite, TX | 3.0 | 2.0 | 1572 | $2,700 | $1.72 | 44d | 1 | 0.91mi |
| 2213 Creek Royal Dr Mesquite, TX | 3.0 | 2.0 | 1505 | $1,850 | $1.23 | 22d | 1 | 0.92mi |
| 2213 Creek Royal Dr Mesquite, TX | 3.0 | 2.0 | 1505 | $1,850 | $1.23 | 44d | 1 | 0.92mi |
| 1521 Cool Springs Dr Mesquite, TX | 4.0 | 2.0 | 1924 | $2,295 | $1.19 | 25d | 1 | 0.93mi |
| 1217 Buckeye Dr Mesquite, TX | 3.0 | 2.0 | 1735 | $1,995 | $1.15 | 22d | 1 | 1.00mi |
| 1217 Buckeye Dr Mesquite, TX | 3.0 | 2.0 | 1735 | $1,995 | $1.15 | 44d | 1 | 1.00mi |
| 2705 Hidden Springs Dr Mesquite, TX | 3.0 | 2.0 | 1656 | $2,280 | $1.38 | 3d | 1 | 1.05mi |
| 1411 Springwood Dr Mesquite, TX | 4.0 | 2.5 | 1874 | $2,081 | $1.11 | 44d | 1 | 1.05mi |
| 1417 Stillmeadow Dr Mesquite, TX | 3.0 | 1.5 | 1251 | $2,800 | $2.24 | 0d | 1 | 1.05mi |
| 1233 Clear Creek Dr Mesquite, TX | 4.0 | 2.5 | 1749 | $2,289 | $1.31 | 8d | 1 | 1.06mi |
| 2124 Amber Spgs Mesquite, TX | 4.0 | 2.5 | 1950 | $3,049 | $1.56 | 13d | 1 | 1.06mi |
| 1229 Clear Creek Dr Mesquite, TX | 3.0 | 2.5 | 1993 | $3,075 | $1.54 | 13d | 1 | 1.07mi |
| 1229 Clear Creek Dr Mesquite, TX | 3.0 | 2.5 | 1993 | $2,900 | $1.46 | 2d | 1 | 1.07mi |
| 2008 Birch Bnd Mesquite, TX | 3.0 | 2.0 | 1580 | $2,799 | $1.77 | 8d | 1 | 1.07mi |
| 1411 Sandalwood Dr Mesquite, TX | 3.0 | 2.0 | 1491 | $2,195 | $1.47 | 2d | 1 | 1.09mi |
| 2632 Bent Brook Dr Mesquite, TX | 3.0 | 2.0 | 1622 | $1,995 | $1.23 | 6d | 1 | 1.09mi |
| 2136 Walden Pl Mesquite, TX | 3.0 | 2.0 | 1704 | $2,250 | $1.32 | 44d | 1 | 1.10mi |
| 2208 Browning Dr Mesquite, TX | 3.0 | 2.0 | 1406 | $1,955 | $1.39 | 44d | 1 | 1.15mi |
| 928 Winchester Ln Mesquite, TX | 3.0 | 2.0 | 1426 | $2,650 | $1.86 | 2d | 1 | 1.15mi |
| 2345 Browning Dr Mesquite, TX | 3.0 | 2.0 | 1384 | $3,500 | $2.53 | 2d | 1 | 1.18mi |
| 908 Winchester Ln Mesquite, TX | 3.0 | 2.0 | 1386 | $2,049 | $1.48 | 2d | 1 | 1.19mi |
| 2820 Bent Brook Dr Mesquite, TX | 3.0 | 2.0 | 1360 | $2,889 | $2.12 | 25d | 1 | 1.21mi |
| 2824 Bent Brook Dr Mesquite, TX | 3.0 | 2.0 | 1622 | $1,945 | $1.20 | 17d | 1 | 1.22mi |
| 3012 Southern Hills Ln Mesquite, TX | 4.0 | 2.0 | 1957 | $2,700 | $1.38 | 44d | 1 | 1.24mi |
| 2433 Baretta Dr Mesquite, TX | 3.0 | 2.0 | 1406 | $2,091 | $1.49 | 22d | 1 | 1.24mi |
| 1013 Clear Creek Dr Mesquite, TX | 4.0 | 2.0 | 1887 | $2,399 | $1.27 | 3d | 1 | 1.26mi |
Listing history 50 events
-
2026-06-18days on market $299,000 Active 50 DOM
-
2026-06-17days on market $299,000 Active 49 DOM
-
2026-06-16days on market $299,000 Active 48 DOM
-
2026-06-15price $299,000 Active 47 DOM
-
2026-06-15pricedays on market $299,500 Active 47 DOM
-
2026-06-13days on market $299,750 Active 45 DOM
-
2026-06-13pricedays on market $299,750 Active 44 DOM
-
2026-06-10price $299,900 Active 41 DOM
-
2026-06-09days on market $299,999 Active 41 DOM
-
2026-06-08days on market $299,999 Active 40 DOM
-
2026-06-07days on market $299,999 Active 39 DOM
-
2026-06-04days on market $299,999 Active 36 DOM
-
2026-06-03days on market $299,999 Active 35 DOM
-
2026-06-02days on market $299,999 Active 34 DOM
-
2026-06-01days on market $299,999 Active 33 DOM
-
2026-05-31price $299,999 Active 32 DOM
-
2026-05-31pricedays on market $300,250 Active 32 DOM
-
2026-05-14price $302,900 997-char remark
-
2026-05-13price $303,900 997-char remark
-
2026-05-12price $304,500 997-char remark
-
2026-05-11price $305,000 997-char remark
-
2026-05-10price $306,000 997-char remark
-
2026-05-09price $308,000 997-char remark
-
2026-05-08price $309,000 997-char remark
-
2026-05-07price $310,000 997-char remark
-
2026-05-05price $312,000 997-char remark
-
2026-05-04price $312,900 997-char remark
-
2026-05-02price $314,500 997-char remark
-
2026-04-29$315,900 Active 997-char remark
-
2026-04-28historical
-
2026-04-28price $317,000
-
2026-04-27price $318,500
-
2026-04-25price $320,000
-
2026-04-22price $322,900
-
2026-04-21price $324,900
-
2026-04-20price $326,500
-
2026-04-19price $327,000
-
2026-04-16price $327,500
-
2026-04-14price $328,000
-
2026-04-12price $328,500
-
2026-04-10price $329,900
-
2026-04-03$330,000 Active
-
2025-06-27soldstatus
-
2019-03-05historical
-
2019-02-16price $205,000
-
2019-01-20$206,900 Active
-
2018-12-28historical
-
2018-12-27$199,900 Active
-
2009-04-01soldstatus
-
2009-03-10historical
ⓘ Source: listings_history table (triggers on properties + properties_extension) + one-shot
backfill from property_details.listing_events for pre-trigger history.
Tax reassessment forecast TX · Resets to sale price
- Current annual tax
- $5,996 · $500/mo
- Projected year-2 tax
- $5,996 · $500/mo
- Expected delta
- $0/yr ($0/mo · 0.0%)
ⓘ Screening estimate from a state-policy table — verify with the county assessor before closing.
Climate risk First Street
- Flood 1/10 Low FEMA zone X (unshaded) · 0% chance over 30 yrs
- Wildfire 3/10 Moderate
- Heat 8/10 Severe 7 d/yr ≥110°F today · 25 d/yr by 30 yrs out
- Wind 6/10 Major 27% chance of damaging wind over 30 yrs
- Air quality 2/10 Low 1 unhealthy d/yr today · 1 by 30 yrs out
Nearby sold comps map
Loading sold comps map…
Walkable amenities ~0.75 mi
Loading nearby amenities…
Taxation est. · year 1
- Rental income
- $31,004
- − Mortgage interest
- −$16,749
- − Property taxes
- −$5,996
- − Insurance
- −$1,495
- − Repairs & maintenance
- −$2,480
- − Management
- −$2,480
- − Depreciation
- −$8,698
- Taxable loss
- −$6,895
- Est. tax savings @ 24.0%
- +$1,655
- After-tax cash flow
- $-160/yr
For passive investors: Depreciation is non-cash, so a rental often shows a tax loss while cash-flowing — sheltering income. Rental losses are passive: they offset passive income freely, and up to $25,000/yr can offset ordinary (W-2) income if you actively participate and your MAGI is under $100k (phasing out to $0 by $150k); unused losses carry forward. On sale, claimed depreciation is recaptured at up to 25%, and gains may owe capital-gains tax (a 1031 exchange can defer both). Figures are a year-1 estimate at your 24.0% rate — not tax advice; consult a CPA.
Schools (NCES district)
- District
- Mesquite ISD
- NCES district ID
- 4830390
- Math proficiency
- 35% ▼ -11.00%
- Reading proficiency
- 32% ▼ -7.00%
- Median HH income
- $49,372
- Composite
- 29.06/100
- National rank
- #6606
- State rank
- #536 of 826 in TX
Livability — Mesquite
- Score
- 70/100
- State rank
- #358
- US rank
- #7743
Category grades
Schools grade is shown separately in the Schools card above.
Census & demographics
- Census place
- Mesquite, TX
- County
- Dallas County · 2,612,404 people
- City population
- 150,788
- Metro
- Dallas-Fort Worth-Arlington, TX
- Population (ZIP)
- 29,788
- Household income
- $111,052
- Rent vs Own
- Severe rent burden
- 857.0
Population outlook (Dallas County) Hauer SSP2
- Today (2025)
- 2,979,839 people
- By 2030
- 3,191,823 · +7.1%
- By 2040
- 3,619,611 · +21.5%
- By 2050
- 4,026,915 · +35.1%
- By 2075
- 4,957,073 · +66.4%
- By 2100
- 5,508,725 · +84.9%
Race, ethnicity, and origin ACS 2023
- Neighborhood character
- Highly diverse neighborhood (Simpson 0.71)
- Race & ethnicity
- Black 39% Hispanic / Latino 32% Two or more races 21% White 16% Asian 5% Native American 1%
- Hispanic origin (detail)
- Mexican 27% Puerto Rican 1%
- Common ancestry
- Slovak 2% Italian 1%
- Foreign-born
- 22% · Canada, Vietnam
- Languages at home
- 64% English-only · Spanish 27% Tagalog/Filipino 3% Other Asian/Pacific 1%
Political lean MEDSL · Dallas
- 2024 margin
- Strong D (+22.2) · D 60.2% · R 38.0% · Other 1.8%
- 2008→2024 swing
- +6.9pp toward D · 2008: 15.3pp · 2024: 22.2pp
- All cycles
- 2024: D+22.2 2020: D+31.6 2016: D+26.2 2012: D+15.4 2008: D+15.3
Not yet ingested
- Civics
- —
Market trends
- HPI YoY
- ▼ -26.63%
- Current HPI
- 257.0959
- Rent YoY
- ▲ 0.07%
- Metro
- Dallas-Fort Worth-Arlington, TX
- State GDP YoY
- ▲ 3.95%
- F500 in state
- 110
Industry mix (Fortune 500 HQ in TX)
| Industry | F500 HQs | Revenue |
|---|---|---|
| Energy | 16 | $1,198B |
|
||
| Technology | 5 | $198B |
|
||
| Engineering / Construction | 4 | $72B |
|
||
| Energy Services | 3 | $60B |
|
||
| Utilities | 3 | $41B |
|
||
| Healthcare | 2 | $330B |
|
||
Price history
+298.3% since first listed45 events — show timeline
- 2026-06-19 Price Changed $298,750 NTREIS
- 2026-06-15 Price Changed $299,000 NTREIS
- 2026-06-14 Price Changed $299,500 NTREIS
- 2026-06-12 Price Changed $299,750 NTREIS
- 2026-06-10 Price Changed $299,900 NTREIS
- 2026-05-31 Price Changed $299,999 NTREIS
- 2026-05-31 Price Changed $300,250 NTREIS
- 2026-05-30 Price Changed $301,000 NTREIS
- 2026-05-30 Price Changed $301,500 NTREIS
- 2026-05-28 Price Changed $301,900 NTREIS
- 2026-05-14 Price Changed $302,900 NTREIS
- 2026-05-13 Price Changed $303,900 NTREIS
- 2026-05-12 Price Changed $304,500 NTREIS
- 2026-05-11 Price Changed $305,000 NTREIS
- 2026-05-10 Price Changed $306,000 NTREIS
- 2026-05-09 Price Changed $308,000 NTREIS
- 2026-05-08 Price Changed $309,000 NTREIS
- 2026-05-07 Price Changed $310,000 NTREIS
- 2026-05-05 Price Changed $312,000 NTREIS
- 2026-05-04 Price Changed $312,900 NTREIS
- 2026-05-02 Price Changed $314,500 NTREIS
- 2026-04-29 Listed $315,900 NTREIS
- 2026-04-28 Listing Removed — NTREIS
- 2026-04-28 Price Changed $317,000 NTREIS
- 2026-04-27 Price Changed $318,500 NTREIS
- 2026-04-25 Price Changed $320,000 NTREIS
- 2026-04-22 Price Changed $322,900 NTREIS
- 2026-04-21 Price Changed $324,900 NTREIS
- 2026-04-20 Price Changed $326,500 NTREIS
- 2026-04-19 Price Changed $327,000 NTREIS
- 2026-04-16 Price Changed $327,500 NTREIS
- 2026-04-14 Price Changed $328,000 NTREIS
- 2026-04-12 Price Changed $328,500 NTREIS
- 2026-04-10 Price Changed $329,900 NTREIS
- 2026-04-03 Listed $330,000 NTREIS
- 2025-06-27 Sold (Public Records) — Public Records
- 2019-03-05 Listing Removed — NTREIS
- 2019-02-16 Price Changed $205,000 NTREIS
- 2019-01-20 Listed $206,900 NTREIS
- 2018-12-28 Listing Removed — NTREIS
- 2018-12-27 Listed $199,900 NTREIS
- 2009-04-01 Sold (MLS) — NTREIS
- 2009-03-10 Listing Removed — NTREIS
- 2009-03-03 Listed $75,000 NTREIS
- 2009-02-18 Sold (Public Records) — Public Records
Property tax history
+4.5%/yrLatest (2025): $5,996 · +1.1% YoY. Source: county tax records.
Cash-flow waterfall
monthlySold comps — $/sqft
last 12 mo · ≤1 miLoading sold comps…