7360 John Levitow Ln · Panama City, FL
Flood risk 1/10 · Minimal
- FEMA flood zone
- X (unshaded)
- Chance of flooding over 30 yrs
- 0.0%
- Est. flood insurance / yr
- $507 – $1,088
Fire risk 7/10 · Major
- Est. fire insurance / yr
- $947 – $1,759
Heat risk 9/10 · Severe
- Hot days now (above 104°F)
- 7 days/yr
- Hot days in 30 yrs
- 21 days/yr
Wind risk 9/10 · Severe
- Chance of severe wind over 30 yrs
- 99.0%
Air-quality risk 1/10 · Minimal
- Unhealthy air days now
- 0 days/yr
- Unhealthy air days in 30 yrs
- 0 days/yr
Risk factors via First Street. Map © Google.
Why this score? — see what drove the D+ grade
The composite is a weighted blend of 9 inputs, each scored 0–100. Each bar is that input's sub-score; the figure is the points it added to the 100-point composite (weight × sub-score).
- Cash flow +12.1/30.0
- ARV discount +11.4/15.0
- Schools +4.3/10.0
- Condition / age +4.0/5.0
- DSCR +3.6/10.0
- Livability +3.6/5.0
- 1% rule +3.5/10.0
- Rent growth +2.8/5.0
- Appreciation +0.0/10.0
$259,900
🖨 Deal sheet (PDF) 📄 Offer letter ✓ Due diligence
Listing remarks
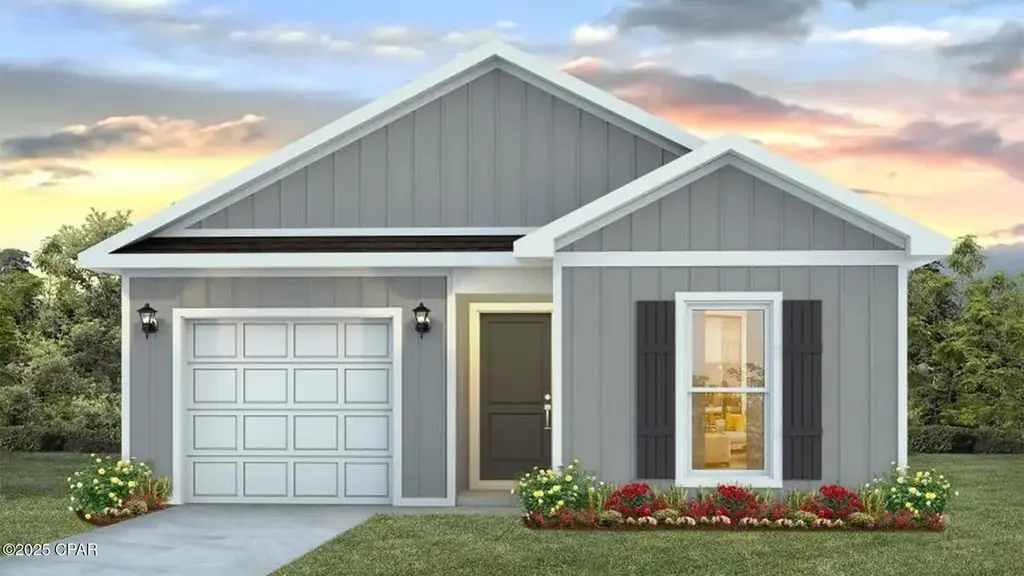
Welcome to the Bowen, a new floor plan located at Liberty in Panama City, Florida. The Bowen is a spacious single-story home floor plan just over 1,500 square feet with 4-bedrooms with 2-bathrooms, and a 1-car garage. Met with an inviting foyer, and a hall leading to the second and third bedrooms; with a full bathroom tucked in between. Also, upon entering the home you will have immediate access to the single-car garage, storage, and your laundry room. Just beyond the garage is your fourth bedroom that could also serve as an office. Each bedroom offers plenty of space and sizeable closets for organization. As you continue to the end of the hall, you will find the remarkable open layout of t
Key facts
- Durable vinyl siding
- Open layout
- New floor plan
Tags
Property features AI
Finance
- HOA & community: Homeowners association present; HOA amenities include business center, gazebo, barbecue area, picnic area; Community features include clubhouse, fitness center, game room, playground, park, pool, basketball court, conference/meeting room
Exterior
- Parking: Detached garage with 1 garage space; Additional paved parking; Garage door opener; Community structure parking available
- Security: Carbon monoxide detector(s); Smoke detector(s)
- Utilities: Cable connected; Electricity available; High-speed internet available; Underground utilities; Public sewer
- Home design: New construction; Vinyl siding; Shingle roof; Slab foundation; City street and highway frontage (public maintained road)
- Construction: Built with vinyl siding; Shingle roof; Slab foundation
- Exterior features: Covered porch; Patio; Community pool
Interior
- Kitchen: Electric range; Plumbed for ice maker
- Bedrooms: Three first-floor bedrooms (dimensions approx. 10.4 x 11.9; 10 x 11.1; 10 x 11.1); Primary bedroom included
- Bathrooms: Two full bathrooms
- Heating & cooling: Central heating (electric, forced air); Central air conditioning
- Interior features: Double pane windows; Smart home technology (smart home, smart technology); Carbon monoxide and smoke detectors
- Laundry & utility: Electric water heater
Neighborhood map
What this means for you Summary
Snapshot
- This is a 4-bed/2.0-bath single-family listed at $260k. Condition is rated good.
Deal economics
- At list price, monthly cash flow is $-57 ($-688/yr) — negative.
- To cash-flow at today's rent, offer at most $252k (3.2% below list).
- To meet the 1% rule (rent ≥ 1% of price), the offer needs to be $220k (15.3% below list).
- Recommended offer: $220k (15.3% below list) — sets the bar for 1% rule.
- Cap rate 6.0% vs local median 4.7% in Panama City — meaningfully above typical; check what's discounted (condition, days-on-market, listing class) to confirm the premium yield is real.
Location & tenants
- Location reads 72/100 on livability (#350 in FL) — a middle-class / working-renter tenant base. Strengths: cost of living A+, housing A+, health & safety A+; Watch: crime F, amenities F, commute F.
- Bay (suburban): math 51% / reading 51% proficiency, ranked #29 of 73 in FL (top 40%) — acceptable for families but not a draw, mixed tenant base, ~2y average lease.
- Zoned schools: Tommy Smith Elementary School (math 46% / reading 51%, grade D, #1,152 of 2,144 statewide, top 55%, 639 students, 53% FRL); Merritt Brown Middle School (math 38% / reading 38%, grade F, #388 of 571 statewide, top 69%, 701 students, 55% FRL); Rutherford High School (math 24% / reading 29%, grade F, #489 of 667 statewide, top 74%, 1,337 students, 63% FRL).
- Zoned-school proficiency averages 38% at this address vs 51% district-wide (-13 pts) — the specific schools serving this property underperform the Bay average; the district grade overstates school quality for this exact location.
- Market conditions: Rents rising (+1.1%/yr); 983 active listings in the ZIP; 1 comparable units currently listed for rent nearby; 2,473 units permitted in Bay County in 2024 (559 in 5+ unit buildings).
- This rent runs 35% of the median local income ($75k/yr) — at the standard rent-burdened threshold; future hikes will face affordability resistance.
Forward outlook
- Local home prices are declining (-3.0%/yr); year-one equity from $2k of loan paydown is wiped out by about $8k of value loss. Plan a longer hold.
- Bay County population projected at +24% by 2050 — long-run rental-demand tailwind backs the buy-and-hold thesis.
Negotiation context
- Only 12 days on market — expect competitive offers; lowballing is unlikely to land.
Risks & watch-outs
- Climate carrying-cost: severe wind risk, 99% chance of damaging wind over 30y; major wildfire risk; extreme-heat days projected 7→21/yr by 2055 (HVAC capex compounding) — expect insurance premiums to compound above CPI over the hold.
Questions for the listing agent
- What do current leases actually rent for vs. the listed asking? Can we see a recent rent roll and the last 12 months of T-12 income?
- Is there a deadline driving the sale (1031 exchange, divorce, estate, relocation)? That informs how much negotiation room exists.
- Schools are B-rated — typically a magnet for longer-tenancy family renters. What's the average tenant stay here, and is there a school-zone premium baked into asking?
- Crime grade is F in this area — have there been break-ins, vandalism, or insurance claims at this property in the last 3 years? What carrier currently insures it and at what premium?
- The area grade is low — what's the realistic commute time and amenity access for the typical tenant pool here? Any planned neighborhood developments (good or bad) we should know about?
- What's the average days-on-market for RENTAL listings here right now (not sales)? A rising rental-DOM trend means longer vacancies and softer asking-rent achievability than the comps imply.
- What's the recent tenant-quality profile in this submarket — average credit score on applications, eviction rate, late-payment / NSF rate, and stable-employment percentage? A property-management company in the area should have these aggregated.
- How much new for-sale + rental construction is in the pipeline within 1–3 miles? Heavy new supply typically softens prices + rents 12–24 months out; constrained supply supports both.
Investment metrics
- 1% rule
- 0.85% ✗
- Cap rate
- 6.03%
- Cash-on-cash
- -0.95%
- DSCR
- 0.96
- GRM
- 9.8
CMA / ARV
- ARV (on-the-fly)
- $284,256
- Comps found
- 12
Show comp detail 12 sales within ~0.75 mi
| Address | Dist | Beds/Ba | Sqft | Sold | Price | $/sf | Match |
|---|---|---|---|---|---|---|---|
| 7083 George Day Ln | 0.44mi | 4/2.0 | 1,458 (-3%) | 2mo | $272,900 | $187 | 73 |
| 7067 George Day Ln | 0.48mi | 4/2.0 | 1,458 (-3%) | 1mo | $269,900 | $185 | 72 |
| 7055 George Day Ln | 0.51mi | 4/2.0 | 1,458 (-3%) | 1mo | $272,900 | $187 | 71 |
| 7054 Merlyn Dethlefsen Rd | 0.51mi | 4/2.0 | 1,458 (-3%) | 2mo | $264,738 | $182 | 70 |
| 7006 William Pitsenbarger Rd | 0.46mi | 3/2.0 (-1) | 1,580 (+5%) | 2mo | $309,000 | $196 | 64 |
| 7050 Merlyn Dethlefsen Rd | 0.51mi | 3/2.0 (-1) | 1,580 (+5%) | 2mo | $302,900 | $192 | 61 |
| 7039 George Day Ln | 0.55mi | 3/2.0 (-1) | 1,580 (+5%) | 2mo | $299,400 | $189 | 60 |
| 6998 William Pitsenbarger Rd | 0.57mi | 3/2.0 (-1) | 1,580 (+5%) | 1mo | $310,000 | $196 | 59 |
| 6682 Atkins Rd | 0.68mi | 3/2.0 (-1) | 1,439 (-4%) | 2mo | $250,000 | $174 | 54 |
| 5117 Salvation St | 0.42mi | 3/2.0 (-1) | 1,717 (+14%) | 0mo | $295,000 | $172 | 52 |
| 5240 Salvation St | 0.52mi | 3/2.0 (-1) | 1,711 (+14%) | 1mo | $351,437 | $205 | 47 |
| 6558 Canley Ct | 0.73mi | 3/2.0 (-1) | 1,383 (-8%) | 2mo | $267,500 | $193 | 46 |
Match score weights: distance 35% · size 25% · config 20% · recency 20%. Top-matched comps best support the ARV.
Projected returns pro-forma
-3.0% appreciation · 1.12% rent growth · sell at horizon
- IRR
- -20.0%
- Equity multiple
- 0.32×
- Total profit
- $-49,819
- Equity at exit
- $38,752
- IRR
- -17.5%
- Equity multiple
- 0.12×
- Total profit
- $-64,096
- Equity at exit
- $22,471
Cash invested: $72,772 (down + closing). Projections, not guarantees.
Landlord ↔ Tenant lean methodology
- Overall (STATE)
- 87 Strongly Landlord-Friendly
- State Florida
- 87 Strongly Landlord-Friendly · R+3
- County
- — inherits STATE
- City
- — inherits STATE
ZIP-level market 32404
- Home prices YoY
- -16.1%
- Rents YoY
- 1.1%
- Active inventory
- 983
- Price-to-rent
- 9.8×
Monthly cashflow live
- Estimated rent
- $2,201 medium interval (Pro) →
- Mortgage (P&I)
- −$1,363
- Tax est. 1.5%
- −$325 /mo · $3,898/yr
- Insurance
- −$108
- HOA
- −$0
- Vacancy / Maint / Mgmt
- −$462
- Net cashflow
- $-57
Break-even live
Sensitivity live
| Price | -10% $122 | -5% $32 | +0% $-57 | +5% $-147 | +10% $-237 |
|---|---|---|---|---|---|
| Rent | -10% $-231 | -5% $-144 | +0% $-57 | +5% $30 | +10% $117 |
| Rate | -1.0pp $74 | -0.5pp $9 | base $-57 | +0.5pp $-125 | +1.0pp $-193 |
UW: 25.0% down · 7.5% · 30yr · 1.5% tax · 5.0% vac · 8.0% maint · 8.0% mgmt
Financing live
Cash to close
- Down payment
- $64,975
- Closing costs
- $7,797
- Reserves months
- —
- Total cash needed
- —
Loan-product check · same deal, 3 products live
Conventional
25% down · 7.5% · 30yr
- Down + closing
- —
- Monthly P&I
- —
- Monthly cashflow
- —
- DSCR
- —
- Eligible?
- —
Personal DTI + credit; lowest rate.
DSCR
20% down · 8.5% · 30yr
- Down + closing
- —
- Monthly P&I
- —
- Monthly cashflow
- —
- DSCR
- —
- Eligible?
- —
No personal income docs; deal must DSCR.
Hard money
10% down · 12.0% · 12mo
- Down + closing
- —
- Monthly P&I
- —
- Monthly cashflow
- —
- DSCR
- —
- Eligible?
- —
Short-term bridge; refi at stabilization.
Rent comps 1 comps
| Address | Beds | Baths | Sqft | Rent | $/sqft | DOM | Units | Dist |
|---|---|---|---|---|---|---|---|---|
| 6416 Bellavia Ln Panama City, FL | 4.0 | 2.0 | 1812 | $2,100 | $1.16 | 15d | 1 | 1.22mi |
Listing history 10 events
-
2026-06-21days on market $259,900 Active 12 DOM
-
2026-06-19days on market $259,900 Active 10 DOM
-
2026-06-18days on market $259,900 Active 9 DOM
-
2026-06-17days on market $259,900 Active 8 DOM
-
2026-06-16days on market $259,900 Active 7 DOM
-
2026-06-15days on market $259,900 Active 6 DOM
-
2026-06-14days on market $259,900 Active 4 DOM
-
2026-06-13days on market $259,900 Active 3 DOM
-
2026-06-10remarks 699-char remark
-
2026-06-10$259,900 Active 1 DOM
ⓘ Source: listings_history table (triggers on properties + properties_extension) + one-shot
backfill from property_details.listing_events for pre-trigger history.
Climate risk First Street
- Flood 1/10 Low FEMA zone X (unshaded) · 0% chance over 30 yrs
- Wildfire 7/10 Severe
- Heat 9/10 Extreme 7 d/yr ≥104°F today · 21 d/yr by 30 yrs out
- Wind 9/10 Extreme 99% chance of damaging wind over 30 yrs
- Air quality 1/10 Low 0 unhealthy d/yr today · 0 by 30 yrs out
Nearby sold comps map
Loading sold comps map…
Walkable amenities ~0.75 mi
Loading nearby amenities…
Taxation est. · year 1
- Rental income
- $26,412
- − Mortgage interest
- −$14,558
- − Property taxes
- −$3,898
- − Insurance
- −$1,300
- − Repairs & maintenance
- −$2,113
- − Management
- −$2,113
- − Depreciation
- −$7,561
- Taxable loss
- −$5,131
- Est. tax savings @ 24.0%
- +$1,231
- After-tax cash flow
- $544/yr
For passive investors: Depreciation is non-cash, so a rental often shows a tax loss while cash-flowing — sheltering income. Rental losses are passive: they offset passive income freely, and up to $25,000/yr can offset ordinary (W-2) income if you actively participate and your MAGI is under $100k (phasing out to $0 by $150k); unused losses carry forward. On sale, claimed depreciation is recaptured at up to 25%, and gains may owe capital-gains tax (a 1031 exchange can defer both). Figures are a year-1 estimate at your 24.0% rate — not tax advice; consult a CPA.
Condition & rehab AI · 6 photos
This single-story home is in good condition with a spacious floor plan and modern finishes. Minor maintenance and cosmetic updates could further enhance its value.
Value-add opportunities
- Both Paint exterior trim — Enhances curb appeal and value
- Both Clean gutters — Improves drainage and property value
Renovation cost estimate screening
Value-add ROI direction
- Both Paint exterior trim — Enhances curb appeal and value ↑
- Both Clean gutters — Improves drainage and property value ↑
ⓘ Cost ranges are severity-bucket heuristics (US national rule-of-thumb). Get contractor quotes + a written scope before underwriting a rehab budget.
Schools (NCES district)
- District
- Bay
- NCES district ID
- 1200090
- Math proficiency
- 51% ▼ -8.00%
- Reading proficiency
- 51% ▼ -7.00%
- Median HH income
- $47,740
- Composite
- 43.41/100
- National rank
- #3014
- State rank
- #29 of 73 in FL
Livability — Panama City
- Score
- 72/100
- State rank
- #350
- US rank
- #5823
Category grades
Schools grade is shown separately in the Schools card above.
Census & demographics
- Census place
- Panama City, FL
- County
- Bay County · 163,593 people
- City population
- 91,445
- Metro
- Panama City, FL
- Population (ZIP)
- 42,514
- Household income
- $74,708
- Rent vs Own
- Severe rent burden
- 1218.0
Population outlook (Bay County) Hauer SSP2
- Today (2025)
- 206,264 people
- By 2030
- 217,740 · +5.6%
- By 2040
- 238,738 · +15.7%
- By 2050
- 255,545 · +23.9%
- By 2075
- 288,295 · +39.8%
- By 2100
- 288,638 · +39.9%
Race, ethnicity, and origin ACS 2023
- Neighborhood character
- Predominantly White (69%)
- Race & ethnicity
- White 69% Black 12% Two or more races 10% Hispanic / Latino 9% Asian 3%
- Hispanic origin (detail)
- Mexican 2% Puerto Rican 3%
- Common ancestry
- Lithuanian 3% Slovak 2% Italian 2%
- Foreign-born
- 7% · Canada, Vietnam, Mexico
- Languages at home
- 90% English-only · Spanish 6% Vietnamese 1% Other Asian/Pacific 1%
Political lean MEDSL · Bay
- 2024 margin
- Solid R (+47.4) · D 25.8% · R 73.1% · Other 1.1%
- 2008→2024 swing
- -6.6pp toward R · 2008: -40.7pp · 2024: -47.4pp
- All cycles
- 2024: R+47.4 2020: R+43.5 2016: R+46.3 2012: R+43.6 2008: R+40.7
Not yet ingested
- Civics
- —
Market trends
- HPI YoY
- ▼ -50.59%
- Current HPI
- 263.7178
- Rent YoY
- ▲ 1.12%
- Metro
- Panama City, FL
- State GDP YoY
- ▲ 3.28%
- F500 in state
- 36
Industry mix (Fortune 500 HQ in FL)
| Industry | F500 HQs | Revenue |
|---|---|---|
| Industrial Technology | 2 | $29B |
|
||
| Insurance | 2 | $17B |
|
||
| Retail | 1 | $60B |
|
||
| Technology Distribution | 1 | $58B |
|
||
| Homebuilding | 1 | $35B |
|
||
| Technology Manufacturing | 1 | $35B |
|
||
Price history
1 event — show timeline
- 2026-06-09 Listed $259,900 CPARMLS
Cash-flow waterfall
monthlySold comps — $/sqft
last 12 mo · ≤1 miLoading sold comps…