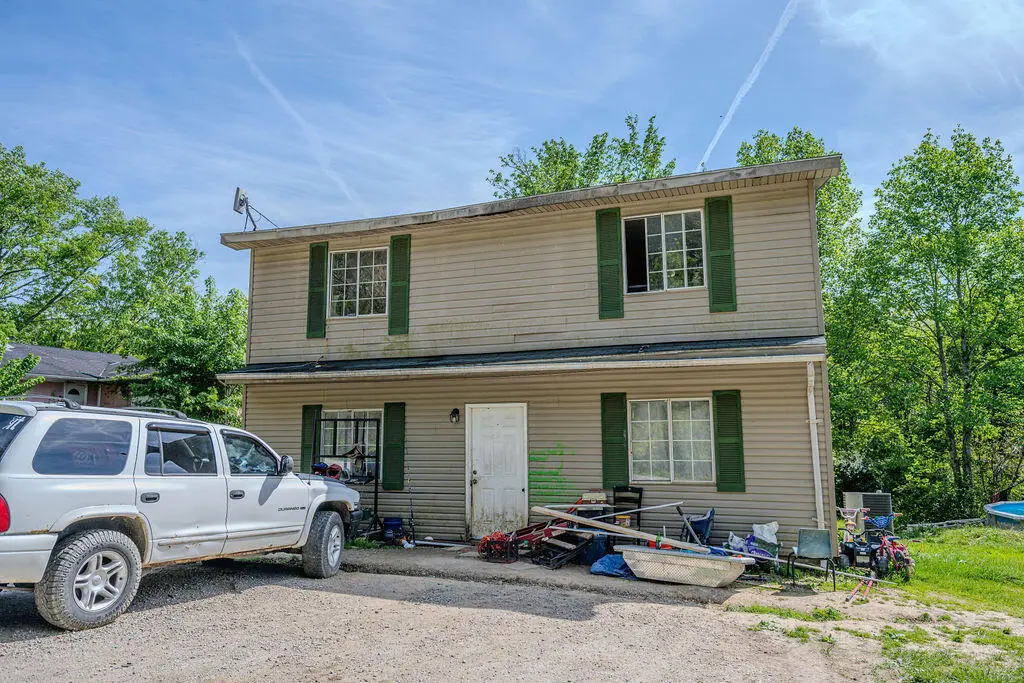
485 Estes Rd · Clay City, KY
Flood risk 1/10 · Minimal
- FEMA flood zone
- X (unshaded)
- Chance of flooding over 30 yrs
- 0.0%
- Est. flood insurance / yr
- $507 – $1,088
Fire risk 5/10 · Moderate
- Est. fire insurance / yr
- $839 – $1,559
Heat risk 4/10 · Minor
- Hot days now (above 101°F)
- 7 days/yr
- Hot days in 30 yrs
- 20 days/yr
Wind risk 2/10 · Minimal
- Chance of severe wind over 30 yrs
- 4.0%
Air-quality risk 1/10 · Minimal
- Unhealthy air days now
- 0 days/yr
- Unhealthy air days in 30 yrs
- 0 days/yr
Risk factors via First Street. Map © Google.
Why this score? — see what drove the B- grade
The composite is a weighted blend of 9 inputs, each scored 0–100. Each bar is that input's sub-score; the figure is the points it added to the 100-point composite (weight × sub-score).
- Cash flow +30.0/30.0
- 1% rule +10.0/10.0
- DSCR +10.0/10.0
- ARV discount +7.5/15.0
- Livability +2.9/5.0
- Rent growth +2.5/5.0
- Condition / age +2.5/5.0
- Schools +1.8/10.0
- Appreciation +0.6/10.0
$75,000
🖨 Deal sheet (PDF) 📄 Offer letter ✓ Due diligence
Listing remarks
Investor opportunity with potential! Sitting on 1.940 acres, this 4-bedroom property is currently being used as a rental and is ready for its next chapter as the sellers prepare for retirement. Whether you're looking to renovate for yourself, add to your investment portfolio, or explore the possibility of additional builds, this property offers plenty of potential. The spacious lot provides room to grow while still enjoying a peaceful setting. Property is being sold as-is. Schedule your showing today!
Key facts
- 1.940 acres
- Spacious lot
- Rental opportunity
Tags
Property features AI
Exterior
- Parking: Driveway
- Utilities: Public water; Septic tank; Electricity connected; Water connected
- Home design: House; Two levels
- Construction: Vinyl siding; Shingle roof; Block and slab foundation; Built area approximately 1,440
- Exterior features: Few trees on the lot
Interior
- Kitchen: Refrigerator; Range
- Flooring: Concrete; Laminate
- Bathrooms: 1 full bathroom
- Heating & cooling: Electric heating; Central air conditioning
- Interior features: Eat-in kitchen; No fireplace; 7 total rooms
Neighborhood map
What this means for you Summary
Snapshot
- This is a 4-bed/1.0-bath single-family listed at $75k.
Deal economics
- At list price, monthly cash flow is $505 ($6k/yr) — positive.
- The deal already cash-flows at list — no discount required.
- Meets the 1% rule at list price ($1k rent vs $75k).
- Recommended offer: $74k (1.5% below list) — sets the bar for market timing.
- Cap rate 14.4% vs local median 3.4% in Clay City — top-decile yield for the area; either an underpriced asset or a hidden risk that comps aren't pricing in. Stress-test before assuming the spread holds.
Location & tenants
- Location reads 58/100 on livability (#428 in KY) — a working-class tenant base; expect higher turnover. Strengths: crime A+, cost of living A+; Watch: health & safety D+, amenities F, commute F.
- Powell County (rural): math 14% / reading 31% proficiency, ranked #156 of 165 in KY (top 94%) — low school quality limits family demand, transient renter base, plan for 1-2y turnover; 64% free/reduced lunch — lower-income household profile, screen leases tightly.
- Zoned schools: Clay City Elementary School (math 16% / reading 23%, grade F, #572 of 676 statewide, top 88%, 442 students, 68% FRL); Powell County Middle School (math 14% / reading 35%, grade F, #189 of 217 statewide, top 89%, 462 students, 68% FRL); Powell County Academy (11 students, 73% FRL).
- Market conditions: 39 active listings in the ZIP; 5 units permitted in Powell County in 2024 (0 in 5+ unit buildings).
Forward outlook
- Local home prices are declining (-3.0%/yr); year-one equity from $519 of loan paydown is wiped out by about $2k of value loss. Plan a longer hold.
- Powell County population projected at -19% by 2050 — secular population decline; favor cash flow + early exit over multi-decade hold.
- At projected returns (-3.0% appreciation + 3.0% rent growth), your $21k cash investment doubles in ~5 years — after that, you're playing with house money.
Negotiation context
- It's been on market 15 days — a 2% lower offer ($74k) is reasonable based on typical stale-listing flexibility.
Risks & watch-outs
- Climate carrying-cost: moderate wildfire risk — expect insurance premiums to compound above CPI over the hold.
Questions for the listing agent
- Is there a deadline driving the sale (1031 exchange, divorce, estate, relocation)? That informs how much negotiation room exists.
- Schools are F-rated, which usually means shorter tenancies and higher turnover. Who's the typical renter profile here, and what's been the actual vacancy rate?
- What's the average days-on-market for RENTAL listings here right now (not sales)? A rising rental-DOM trend means longer vacancies and softer asking-rent achievability than the comps imply.
- What's the recent tenant-quality profile in this submarket — average credit score on applications, eviction rate, late-payment / NSF rate, and stable-employment percentage? A property-management company in the area should have these aggregated.
- How much new for-sale + rental construction is in the pipeline within 1–3 miles? Heavy new supply typically softens prices + rents 12–24 months out; constrained supply supports both.
Investment metrics
- 1% rule
- 1.59% ✓
- Cap rate
- 14.37%
- Cash-on-cash
- 28.86%
- DSCR
- 2.28
- GRM
- 5.2
CMA / ARV
- ARV (on-the-fly)
- $256,320
- Comps found
- 4
Show comp detail 4 sales within ~0.75 mi
| Address | Dist | Beds/Ba | Sqft | Sold | Price | $/sf | Match |
|---|---|---|---|---|---|---|---|
| 81 Arrowhead Dr | 0.65mi | 3/2.0 (-1) | 1,404 (-2%) | 14mo | $250,000 | $178 | 45 |
| 2802 Hardwicks Creek Rd | 0.61mi | 3/2.0 (-1) | 1,456 (+1%) | 19mo | $265,000 | $182 | 45 |
| 613 Little Hardwicks Creek Rd | 0.41mi | 3/2.0 (-1) | 1,629 (+13%) | 11mo | $163,500 | $100 | 41 |
| 40 Nolan Circle Cir | 0.71mi | 3/2.0 (-1) | 1,344 (-7%) | 12mo | $160,000 | $119 | 37 |
Match score weights: distance 35% · size 25% · config 20% · recency 20%. Top-matched comps best support the ARV.
Projected returns pro-forma
-3.0% appreciation · 3.0% rent growth · sell at horizon
- IRR
- 23.2%
- Equity multiple
- 1.95×
- Total profit
- $19,983
- Equity at exit
- $11,183
- IRR
- 31.1%
- Equity multiple
- 3.80×
- Total profit
- $58,698
- Equity at exit
- $6,485
Cash invested: $21,000 (down + closing). Projections, not guarantees.
Landlord ↔ Tenant lean methodology
- Overall (STATE)
- 83 Strongly Landlord-Friendly
- State Kentucky
- 83 Strongly Landlord-Friendly · R+16
- County
- — inherits STATE
- City
- — inherits STATE
ZIP-level market 40312
- Home prices YoY
- -4.4%
- Active inventory
- 39
- Price-to-rent
- 5.2×
Monthly cashflow live
- Estimated rent
- $1,196 medium interval (Pro) →
- Mortgage (P&I)
- −$393
- Tax from tax record
- −$15 /mo · $183/yr
- Insurance
- −$31
- HOA
- −$0
- Vacancy / Maint / Mgmt
- −$251
- Net cashflow
- $505
Break-even live
Sensitivity live
| Price | -10% $547 | -5% $526 | +0% $505 | +5% $484 | +10% $463 |
|---|---|---|---|---|---|
| Rent | -10% $411 | -5% $458 | +0% $505 | +5% $552 | +10% $600 |
| Rate | -1.0pp $543 | -0.5pp $524 | base $505 | +0.5pp $486 | +1.0pp $466 |
UW: 25.0% down · 7.5% · 30yr · 1.5% tax · 5.0% vac · 8.0% maint · 8.0% mgmt
Financing live
Cash to close
- Down payment
- $18,750
- Closing costs
- $2,250
- Reserves months
- —
- Total cash needed
- —
Loan-product check · same deal, 3 products live
Conventional
25% down · 7.5% · 30yr
- Down + closing
- —
- Monthly P&I
- —
- Monthly cashflow
- —
- DSCR
- —
- Eligible?
- —
Personal DTI + credit; lowest rate.
DSCR
20% down · 8.5% · 30yr
- Down + closing
- —
- Monthly P&I
- —
- Monthly cashflow
- —
- DSCR
- —
- Eligible?
- —
No personal income docs; deal must DSCR.
Hard money
10% down · 12.0% · 12mo
- Down + closing
- —
- Monthly P&I
- —
- Monthly cashflow
- —
- DSCR
- —
- Eligible?
- —
Short-term bridge; refi at stabilization.
Listing history 6 events
-
2026-06-03statusdays on market $75,000 Pending 15 DOM
-
2026-06-02days on market $75,000 Active 14 DOM
-
2026-06-01days on market $75,000 Active 13 DOM
-
2026-05-31days on market $75,000 Active 12 DOM
-
2026-05-31days on market $75,000 Active 11 DOM
-
2026-05-18$75,000 Active
ⓘ Source: listings_history table (triggers on properties + properties_extension) + one-shot
backfill from property_details.listing_events for pre-trigger history.
Tax reassessment forecast KY · Resets to sale price
- Current annual tax
- $183 · $15/mo
- Projected year-2 tax
- $645 · $54/mo
- Expected delta
- +$462/yr (+$38/mo · 252.4%)
ⓘ Screening estimate from a state-policy table — verify with the county assessor before closing.
Climate risk First Street
- Flood 1/10 Low FEMA zone X (unshaded) · 0% chance over 30 yrs
- Wildfire 5/10 Major
- Heat 4/10 Moderate 7 d/yr ≥101°F today · 20 d/yr by 30 yrs out
- Wind 2/10 Low 4% chance of damaging wind over 30 yrs
- Air quality 1/10 Low 0 unhealthy d/yr today · 0 by 30 yrs out
Nearby sold comps map
Loading sold comps map…
Walkable amenities ~0.75 mi
Loading nearby amenities…
Taxation est. · year 1
- Rental income
- $14,352
- − Mortgage interest
- −$4,201
- − Property taxes
- −$183
- − Insurance
- −$375
- − Repairs & maintenance
- −$1,148
- − Management
- −$1,148
- − Depreciation
- −$2,182
- Taxable income
- $5,115
- Est. tax owed @ 24.0%
- −$1,228
- After-tax cash flow
- $4,833/yr
For passive investors: Depreciation is non-cash, so a rental often shows a tax loss while cash-flowing — sheltering income. Rental losses are passive: they offset passive income freely, and up to $25,000/yr can offset ordinary (W-2) income if you actively participate and your MAGI is under $100k (phasing out to $0 by $150k); unused losses carry forward. On sale, claimed depreciation is recaptured at up to 25%, and gains may owe capital-gains tax (a 1031 exchange can defer both). Figures are a year-1 estimate at your 24.0% rate — not tax advice; consult a CPA.
Schools (NCES district)
- District
- Powell County
- NCES district ID
- 2104890
- Math proficiency
- 14% ▼ -25.00%
- Reading proficiency
- 31% ▼ -19.00%
- Median HH income
- $31,309
- Composite
- 18.13/100
- National rank
- #8967
- State rank
- #156 of 165 in KY
Livability — Clay City
- Score
- 58/100
- State rank
- #428
- US rank
- #20794
Category grades
Schools grade is shown separately in the Schools card above.
Census & demographics
- Population (ZIP)
- 6,156
Population outlook (Powell County) Hauer SSP2
- Today (2025)
- 11,535 people
- By 2030
- 11,076 · -4.0%
- By 2040
- 10,174 · -11.8%
- By 2050
- 9,307 · -19.3%
- By 2075
- 7,369 · -36.1%
- By 2100
- 5,806 · -49.7%
Race, ethnicity, and origin ACS 2023
- Neighborhood character
- Predominantly White (95%)
- Race & ethnicity
- White 95% Two or more races 4% Hispanic / Latino 2%
- Common ancestry
- Serbian 3% Lithuanian 2% Slovak 1%
- Languages at home
- 98% English-only · Spanish 2%
Political lean MEDSL · Powell
- 2024 margin
- Solid R (+54.4) · D 21.9% · R 76.3% · Other 1.8%
- 2008→2024 swing
- -38.9pp toward R · 2008: -15.5pp · 2024: -54.4pp
- All cycles
- 2024: R+54.4 2020: R+48.6 2016: R+45.2 2012: R+24.9 2008: R+15.5
Not yet ingested
- Civics
- —
Market trends
- HPI YoY
- ▼ -8.83%
- Current HPI
- 192.7678
- Rent YoY
- —
- Metro
- —
- State GDP YoY
- ▲ 1.81%
- F500 in state
- 4
Industry mix (Fortune 500 HQ in KY)
| Industry | F500 HQs | Revenue |
|---|---|---|
| Healthcare | 1 | $118B |
|
||
| Food / Beverage | 1 | $7B |
|
||
Price history
1 event — show timeline
- 2026-05-18 Listed $75,000 ImagineMLS
Property tax history
-4.3%/yrLatest (2025): $183 · -42.2% YoY. Source: county tax records.
Cash-flow waterfall
monthlySold comps — $/sqft
last 12 mo · ≤1 miLoading sold comps…