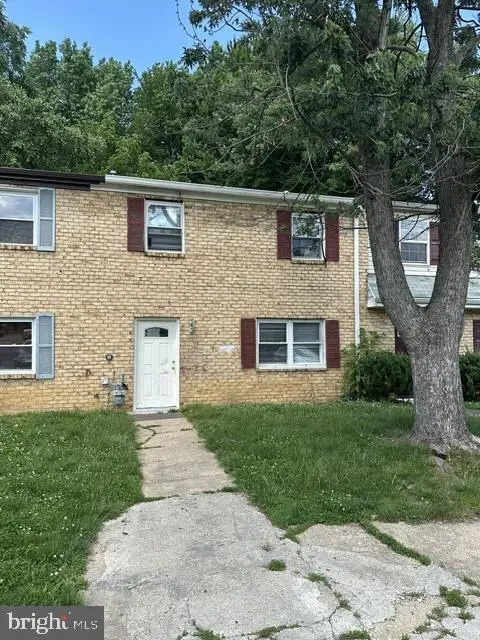
42 Raven Turn · Bear, DE
Flood risk 1/10 · Minimal
- FEMA flood zone
- X (unshaded)
- Chance of flooding over 30 yrs
- 0.0%
- Est. flood insurance / yr
- $507 – $1,088
Fire risk 1/10 · Minimal
- Est. fire insurance / yr
- $476 – $884
Heat risk 7/10 · Major
- Hot days now (above 103°F)
- 7 days/yr
- Hot days in 30 yrs
- 15 days/yr
Wind risk 6/10 · Moderate
- Chance of severe wind over 30 yrs
- 27.0%
Air-quality risk 4/10 · Minor
- Unhealthy air days now
- 3 days/yr
- Unhealthy air days in 30 yrs
- 5 days/yr
Risk factors via First Street. Map © Google.
Why this score? — see what drove the B grade
The composite is a weighted blend of 9 inputs, each scored 0–100. Each bar is that input's sub-score; the figure is the points it added to the 100-point composite (weight × sub-score).
- Cash flow +29.3/30.0
- ARV discount +15.0/15.0
- DSCR +10.0/10.0
- 1% rule +7.3/10.0
- Livability +3.7/5.0
- Rent growth +3.0/5.0
- Schools +2.5/10.0
- Condition / age +2.5/5.0
- Appreciation +0.0/10.0
$189,900
🖨 Deal sheet 📄 Offer letter ✓ Due diligence
Key facts
- $8 HOA
- 2 parking spots
- Built 1974
Property features AI
Finance
- HOA & community: HOA fee $100 annually
Exterior
- Parking: Driveway parking; Two driveway spaces (two total garage/parking spaces)
- Utilities: Public water; Private sewer; Electric cooling; Natural gas heating and hot water
- Home design: Interior townhouse/rowhouse; Fee simple ownership; Year built recorded by assessor
- Construction: Frame and brick construction; Architectural shingle roof; Slab foundation; Above-grade and below-grade structures noted
- Exterior features: Lot dimensions approximately 22.30 x 110.00; No tidal water
Interior
- Bedrooms: Three bedrooms on the upper level
- Flooring: Laminate; Ceramic tile
- Bathrooms: Two full bathrooms (one on main level, one on upper level)
- Heating & cooling: 90% efficient forced air heating; Central air conditioning (electric); Natural gas hot water
- Interior features: Laminated and ceramic tile flooring; No basement
Neighborhood map
What this means for you Summary
Snapshot
- This is a 3-bed/1.5-bath townhouse listed at $190k.
Deal economics
- At list price, monthly cash flow is $667 ($8k/yr) — positive.
- The deal already cash-flows at list — no discount required.
- Meets the 1% rule at list price ($2k rent vs $190k).
- Cap rate 10.5% vs local median 4.7% in Bear — top-decile yield for the area; either an underpriced asset or a hidden risk that comps aren't pricing in. Stress-test before assuming the spread holds.
Location & tenants
- Location reads 73/100 on livability (#8 in DE) — a middle-class / working-renter tenant base. Strengths: housing A+, employment A-, cost of living A-; Watch: crime C-, schools D+, amenities F.
- Christina School District (suburban): math 22% / reading 33% proficiency, ranked #18 of 26 in DE (top 69%) — low school quality limits family demand, transient renter base, plan for 1-2y turnover.
- Market conditions: Rents rising (+2.2%/yr); 151 active listings in the ZIP; 10 comparable units currently listed for rent nearby; rentals at typical pace (median 16d on market — plan ~3-4 weeks tenant-placement turnaround); solid renter incomes; 1,367 units permitted in New Castle County in 2024 (201 in 5+ unit buildings).
- This rent runs 30% of the median local income ($92k/yr) — at the standard rent-burdened threshold; future hikes will face affordability resistance.
Forward outlook
- Local home prices are declining (-3.0%/yr); year-one equity from $1k of loan paydown is wiped out by about $6k of value loss. Plan a longer hold.
- New Castle County population projected at +9% by 2050 — modest demand growth; plan on rents tracking national, not racing it.
- At projected returns (-3.0% appreciation + 2.2% rent growth), your $53k cash investment doubles in ~9 years — after that, you're playing with house money.
Negotiation context
- Only 7 days on market — expect competitive offers; lowballing is unlikely to land.
- 7 sale attempts since 23y ago; this cycle's ask is 126% above the opening price — seller raised mid-cycle; expect resistance to lowballs.
- Current owner paid $40k; list at $190k implies a 370% gain — meaningful room to come down on a strong offer.
Risks & watch-outs
- Climate carrying-cost: major wind risk, 27% chance of damaging wind over 30y; extreme-heat days projected 7→15/yr by 2055 (HVAC capex compounding) — expect insurance premiums to compound above CPI over the hold.
Questions for the listing agent
- Built in 1974 — when were the roof, HVAC, electrical panel, plumbing, and water heater last replaced?
- What does the HOA fee cover, when was the last increase, and are there any pending special assessments or reserve-fund shortfalls?
- Is there a deadline driving the sale (1031 exchange, divorce, estate, relocation)? That informs how much negotiation room exists.
- Schools are D-rated, which usually means shorter tenancies and higher turnover. Who's the typical renter profile here, and what's been the actual vacancy rate?
- What's the average days-on-market for RENTAL listings here right now (not sales)? A rising rental-DOM trend means longer vacancies and softer asking-rent achievability than the comps imply.
- What's the recent tenant-quality profile in this submarket — average credit score on applications, eviction rate, late-payment / NSF rate, and stable-employment percentage? A property-management company in the area should have these aggregated.
- How much new for-sale + rental construction is in the pipeline within 1–3 miles? Heavy new supply typically softens prices + rents 12–24 months out; constrained supply supports both.
Investment metrics
- 1% rule
- 1.23% ✓
- Cap rate
- 10.51%
- Cash-on-cash
- 15.05%
- DSCR
- 1.67
- GRM
- 6.8
CMA / ARV
- ARV (on-the-fly)
- $282,975
- Comps found
- 12
Show comp detail 12 sales within ~0.75 mi
| Address | Dist | Beds/Ba | Sqft | Sold | Price | $/sf | Match |
|---|---|---|---|---|---|---|---|
| 113 E Plover Dr | 0.17mi | 3/1.5 | 1,225 (0%) | 6mo | $257,397 | $210 | 87 |
| 18 Laxford Dr | 0.37mi | 3/1.5 | 1,250 (+2%) | 0mo | $325,000 | $260 | 79 |
| 53 Bradley Dr | 0.38mi | 3/1.5 | 1,242 (+1%) | 1mo | $300,000 | $242 | 79 |
| 10 Bradley Dr | 0.46mi | 3/1.5 | 1,225 (0%) | 3mo | $275,000 | $224 | 76 |
| 123 Council Cir | 0.45mi | 3/2.0 | 1,200 (-2%) | 2mo | $285,000 | $238 | 72 |
| 19 Auckland Dr | 0.32mi | 3/2.5 | 1,300 (+6%) | 5mo | $300,000 | $231 | 66 |
| 226 Finch Way | 0.40mi | 3/2.5 | 1,325 (+8%) | 1mo | $330,000 | $249 | 63 |
| 137 Creekside Ct | 0.70mi | 2/1.5 (-1) | 1,225 (0%) | 1mo | $255,000 | $208 | 62 |
| 204 Finch Way | 0.36mi | 3/2.5 | 1,350 (+10%) | 4mo | $340,000 | $252 | 59 |
| 110 Auckland Dr | 0.26mi | 3/2.5 | 1,400 (+14%) | 3mo | $310,000 | $221 | 58 |
| 145 Creekside Ct | 0.71mi | 3/2.5 | 1,375 (+12%) | 6mo | $275,000 | $200 | 38 |
| 32 Grand National Ln #47 | 0.69mi | 2/2.0 (-1) | 1,375 (+12%) | 4mo | $295,000 | $215 | 37 |
Match score weights: distance 35% · size 25% · config 20% · recency 20%. Top-matched comps best support the ARV.
Projected returns pro-forma
-3.0% appreciation · 2.19% rent growth · sell at horizon
- IRR
- 4.8%
- Equity multiple
- 1.18×
- Total profit
- $9,761
- Equity at exit
- $28,315
- IRR
- 13.5%
- Equity multiple
- 2.04×
- Total profit
- $55,370
- Equity at exit
- $16,419
Cash invested: $53,172 (down + closing). Projections, not guarantees.
Landlord ↔ Tenant lean methodology
- Overall (STATE)
- 70 Landlord-Friendly
- State Delaware
- 70 Landlord-Friendly · D+7
- County
- — inherits STATE
- City
- — inherits STATE
ZIP-level market 19702
- Rents YoY
- 2.2%
- Active inventory
- 151
- Price-to-rent
- 6.8×
Monthly cashflow live
- Estimated rent
- $2,336 high interval (Pro) →
- Mortgage (P&I)
- −$996
- Tax from tax record
- −$96 /mo · $1,148/yr
- Insurance
- −$79
- HOA
- −$8
- Vacancy / Maint / Mgmt
- −$491
- Net cashflow
- $667
Break-even live
UW: 25.0% down · 7.5% · 30yr · 1.5% tax · 5.0% vac · 8.0% maint · 8.0% mgmt
Financing live
Cash to close
- Down payment
- $47,475
- Closing costs
- $5,697
- Reserves months
- —
- Total cash needed
- —
Loan-product check · same deal, 3 products live
Conventional
25% down · 7.5% · 30yr
- Down + closing
- —
- Monthly P&I
- —
- Monthly cashflow
- —
- DSCR
- —
- Eligible?
- —
Personal DTI + credit; lowest rate.
DSCR
20% down · 8.5% · 30yr
- Down + closing
- —
- Monthly P&I
- —
- Monthly cashflow
- —
- DSCR
- —
- Eligible?
- —
No personal income docs; deal must DSCR.
Hard money
10% down · 12.0% · 12mo
- Down + closing
- —
- Monthly P&I
- —
- Monthly cashflow
- —
- DSCR
- —
- Eligible?
- —
Short-term bridge; refi at stabilization.
Rent comps 10 comps
| Address | Beds | Baths | Sqft | Rent | $/sqft | DOM | Units | Dist |
|---|---|---|---|---|---|---|---|---|
| 10 McFarland Dr Newark, DE | 2.0 | 2.0 | 1082 | $2,176 | $2.01 | 2d | 2 | 0.54mi |
| 885 Salem Church Rd Newark, DE | 1.0–2.0 | 1.0–2.0 | 850 | $1,795 | $2.11 | 1d | 1 | 0.60mi |
| 138 Creekside Ct Newark, DE | 2.0 | 2.5 | 1225 | $2,200 | $1.80 | 44d | 1 | 0.74mi |
| 182 Darling St Newark, DE | 3.0 | 2.5 | 1345 | $2,450 | $1.82 | 44d | 1 | 0.89mi |
| 1 Kennedy Cir Bear, DE | 1.0–3.0 | 1.0–3.0 | 1582 | $3,315 | $2.09 | 1d | 39 | 0.95mi |
| 325 Barley Dr Newark, DE | 2.0 | 1.5 | 1000 | $1,675 | $1.68 | 24d | 1 | 1.08mi |
| 2139 Valence Pl Newark, DE | 2.0–3.0 | 2.0 | 1183 | $2,505 | $2.12 | 15d | 6 | 1.12mi |
| 2102 Ashkirk Dr Newark, DE | 1.0–2.0 | 1.0–2.0 | 880 | $1,865 | $2.12 | 1d | 6 | 1.24mi |
| 50 Turnberry Ct Bear, DE | 1.0–3.0 | 1.0–3.0 | 1598 | $3,400 | $2.13 | 1d | 194 | 1.25mi |
| 35 Honeysuckle Dr Newark, DE | 3.0 | 1.5 | 1250 | $2,400 | $1.92 | 17d | 1 | 1.48mi |
HOA detail
- Monthly dues
- $8 · $96/yr
Listing history 9 events
-
2026-06-18price $189,900 Active 7 DOM
-
2026-06-18days on market $193,000 Active 7 DOM
-
2026-06-17days on market $193,000 Active 6 DOM
-
2026-06-16days on market $193,000 Active 5 DOM
-
2026-06-15days on market $193,000 Active 4 DOM
-
2026-06-13days on market $193,000 Active 2 DOM
-
2026-06-13statusdays on market $193,000 Active 1 DOM
-
2026-06-09days on market $193,000 Coming Soon 2 DOM
-
2026-06-08$193,000 Coming Soon 1 DOM
ⓘ Source: listings_history table (triggers on properties + properties_extension) + one-shot
backfill from property_details.listing_events for pre-trigger history.
Tax reassessment forecast DE · Partial reset (capped growth)
- Current annual tax
- $1,148 · $96/mo
- Projected year-2 tax
- $1,148 · $96/mo
- Expected delta
- $0/yr ($0/mo · 0.0%)
ⓘ Screening estimate from a state-policy table — verify with the county assessor before closing.
Climate risk First Street
- Flood 1/10 Low FEMA zone X (unshaded) · 0% chance over 30 yrs
- Wildfire 1/10 Low
- Heat 7/10 Severe 7 d/yr ≥103°F today · 15 d/yr by 30 yrs out
- Wind 6/10 Major 27% chance of damaging wind over 30 yrs
- Air quality 4/10 Moderate 3 unhealthy d/yr today · 5 by 30 yrs out
Nearby sold comps map
Loading sold comps map…
Walkable amenities ~0.75 mi
Loading nearby amenities…
Taxation est. · year 1
- Rental income
- $28,032
- − Mortgage interest
- −$10,637
- − Property taxes
- −$1,148
- − Insurance
- −$950
- − Repairs & maintenance
- −$2,243
- − Management
- −$2,243
- − HOA
- −$96
- − Depreciation
- −$5,524
- Taxable income
- $5,192
- Est. tax owed @ 24.0%
- −$1,246
- After-tax cash flow
- $6,756/yr
For passive investors: Depreciation is non-cash, so a rental often shows a tax loss while cash-flowing — sheltering income. Rental losses are passive: they offset passive income freely, and up to $25,000/yr can offset ordinary (W-2) income if you actively participate and your MAGI is under $100k (phasing out to $0 by $150k); unused losses carry forward. On sale, claimed depreciation is recaptured at up to 25%, and gains may owe capital-gains tax (a 1031 exchange can defer both). Figures are a year-1 estimate at your 24.0% rate — not tax advice; consult a CPA.
Schools (NCES district)
- District
- Christina School District
- NCES district ID
- 1000200
- Math proficiency
- 22% ▼ -12.00%
- Reading proficiency
- 33% ▼ -5.00%
- Median HH income
- $58,838
- Composite
- 24.93/100
- National rank
- #7567
- State rank
- #18 of 26 in DE
Livability — Bear
- Score
- 73/100
- State rank
- #8
- US rank
- #5158
Category grades
Schools grade is shown separately in the Schools card above.
Census & demographics
- Census place
- Bear, DE
- County
- New Castle County · 483,412 people
- City population
- 42,984
- Metro
- Philadelphia-Camden-Wilmington, PA-NJ-DE-MD
- Population (ZIP)
- 55,683
- Household income
- $92,446
- Rent vs Own
- Severe rent burden
- 1421.0
Population outlook (New Castle County) Hauer SSP2
- Today (2025)
- 594,686 people
- By 2030
- 609,164 · +2.4%
- By 2040
- 632,154 · +6.3%
- By 2050
- 649,068 · +9.1%
- By 2075
- 687,771 · +15.7%
- By 2100
- 694,961 · +16.9%
Race, ethnicity, and origin ACS 2023
- Neighborhood character
- Highly diverse neighborhood (Simpson 0.73)
- Race & ethnicity
- White 38% Black 31% Hispanic / Latino 14% Asian 12% Two or more races 8%
- Hispanic origin (detail)
- Mexican 7% Puerto Rican 3%
- Common ancestry
- Romanian 3% Lithuanian 1% Slovak 1%
- Foreign-born
- 22% · Canada, China, South Korea
- Languages at home
- 73% English-only · Spanish 11% Other Indo-European 5% Other Asian/Pacific 3%
Political lean MEDSL · New Castle
- 2024 margin
- Solid D (+32.6) · D 65.5% · R 32.9% · Other 1.6%
- 2008→2024 swing
- -8.1pp toward R · 2008: 40.6pp · 2024: 32.6pp
- All cycles
- 2024: D+32.6 2020: D+37.1 2016: D+29.6 2012: D+34.1 2008: D+40.6
Not yet ingested
- Civics
- —
Market trends
- HPI YoY
- ▼ -241.79%
- Current HPI
- 248.8414
- Rent YoY
- ▲ 2.19%
- Metro
- Philadelphia-Camden-Wilmington, PA-NJ-DE-MD
- State GDP YoY
- —
- F500 in state
- 0
Price history
+664.9% since first listed18 events — show timeline
- 2026-06-07 Coming Soon $193,000 BRIGHT MLS
- 2012-12-31 Listing Removed — BRIGHT MLS
- 2012-04-22 Listed $84,000 BRIGHT MLS
- 2011-06-28 Listing Removed — BRIGHT MLS
- 2011-06-12 Listed $99,900 BRIGHT MLS
- 2011-05-02 Sold (MLS) $40,400 TREND
- 2011-05-02 Sold (MLS) $40,400 BRIGHT MLS
- 2011-03-16 Listing Removed — BRIGHT MLS
- 2011-03-09 Listing Removed — BRIGHT MLS
- 2011-03-09 Listed $44,000 TREND
- 2011-03-09 Listed $44,000 BRIGHT MLS
- 2011-02-11 Listed $50,000 BRIGHT MLS
- 2007-04-10 Sold (Public Records) $98,000 Public Records
- 2007-04-05 Sold (MLS) $103,000 BRIGHT MLS
- 2007-03-10 Listed $103,000 BRIGHT MLS
- 2003-09-06 Listing Removed — BRIGHT MLS
- 2003-09-06 Listed $55,000 BRIGHT MLS
- 1979-10-01 Sold (Public Records) $25,233 Public Records
Property tax history
+3.5%/yrLatest (2024): $1,148 · +2.7% YoY. Source: county tax records.
Cash-flow waterfall
monthlySold comps — $/sqft
last 12 mo · ≤1 miLoading sold comps…