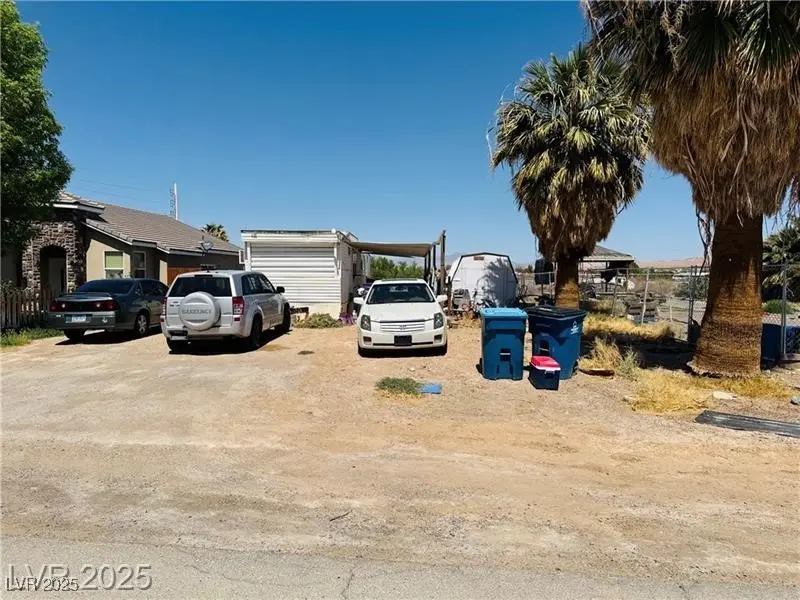
468 Adelle Ave · Moapa Valley, NV
Flood risk 4/10 · Minor
- FEMA flood zone
- X (unshaded)
- Chance of flooding over 30 yrs
- 0.2%
- Est. flood insurance / yr
- $507 – $1,088
Fire risk 5/10 · Moderate
- Est. fire insurance / yr
- $490 – $910
Heat risk 8/10 · Major
- Hot days now (above 110°F)
- 7 days/yr
- Hot days in 30 yrs
- 15 days/yr
Wind risk 1/10 · Minimal
- Chance of severe wind over 30 yrs
- —
Air-quality risk 1/10 · Minimal
- Unhealthy air days now
- 0 days/yr
- Unhealthy air days in 30 yrs
- 0 days/yr
Risk factors via First Street. Map © Google.
Why this score? — see what drove the B grade
The composite is a weighted blend of 9 inputs, each scored 0–100. Each bar is that input's sub-score; the figure is the points it added to the 100-point composite (weight × sub-score).
- Cash flow +30.0/30.0
- DSCR +10.0/10.0
- Appreciation +8.2/10.0
- 1% rule +7.9/10.0
- ARV discount +7.5/15.0
- Livability +3.0/5.0
- Schools +2.6/10.0
- Rent growth +2.5/5.0
- Condition / age +2.5/5.0
$77,000
🖨 Deal sheet (PDF) 📄 Offer letter ✓ Due diligence
Listing remarks MLS
Property ready for manufactured home or build the home of your dreams. !
Key facts
- 6,534 sq ft lot
- Built 1992
- Listed 179 days
Neighborhood map
What this means for you Summary
Snapshot
- This is a 2-bed/1.0-bath manufactured listed at $77k.
Deal economics
- At list price, monthly cash flow is $324 ($4k/yr) — positive.
- The deal already cash-flows at list — no discount required.
- Meets the 1% rule at list price ($992 rent vs $77k).
- Recommended offer: $68k (12.0% below list) — sets the bar for market timing.
Location & tenants
- Location reads 60/100 on livability (#77 in NV) — a middle-class / working-renter tenant base. Strengths: housing A+, cost of living A, employment B+; Watch: amenities F, commute F, health & safety F.
- Clark County School District (urban): math 21% / reading 39% proficiency, ranked #11 of 17 in NV (top 65%) — families likely to look elsewhere, expect single-tenant / working-renter base with shorter leases.
- Zoned schools: Bowler Grant Es (math 44% / reading 52%, grade D, #64 of 402 statewide, top 16%, 690 students, 100% FRL); Lyon Mack Ms (math 41% / reading 54%, grade C-, #11 of 109 statewide, top 9%, 404 students, 100% FRL); Moapa Valley Hs (math 27% / reading 62%, grade F, #32 of 131 statewide, top 25%, 573 students, 100% FRL) — zoned schools average 100% FRL vs 52% district-wide (48 pts higher); higher-poverty schools than district average — tighter screening recommended.
- Zoned-school proficiency averages 47% at this address vs 30% district-wide (+17 pts) — the actual schools serving this property are materially stronger than the Clark County School District average implies; a family-tenant draw the district grade alone would hide.
- Market conditions: 72 active listings in the ZIP; 14,754 units permitted in Clark County in 2024 (2,301 in 5+ unit buildings).
Forward outlook
- In year one you build about $5k of equity ($532 loan paydown + $5k appreciation (6.3% local appreciation)).
- Clark County population projected at +36% by 2050 — long-run rental-demand tailwind backs the buy-and-hold thesis.
- At projected returns (6.3% appreciation + 3.0% rent growth), your $22k cash investment doubles in ~3 years — after that, you're playing with house money.
- By year 7, paydown + projected appreciation supports a ~$36k cash-out refi (75% LTV) — recoverable capital for the next deal without selling this one.
Negotiation context
- It's been on market 180 days — a 12% lower offer ($68k) is reasonable based on typical stale-listing flexibility.
- 6 sale attempts since 9y ago with the ask held roughly flat each time — persistent listings suggest the price (not the market) is what's stuck; bring a comps-based counter.
- Current owner paid $25k; list at $77k implies a 208% gain — meaningful room to come down on a strong offer.
Risks & watch-outs
- Climate carrying-cost: moderate wildfire risk; extreme-heat days projected 7→15/yr by 2055 (HVAC capex compounding) — expect insurance premiums to compound above CPI over the hold.
Questions for the listing agent
- It's been on market 180 days. Have you received any prior offers? Is the seller open to a 12% concession, seller financing, or rate buy-down credit?
- Why hasn't it sold? Are there any deal-killer items the seller is aware of (foundation, flood, title, zoning, code violations)?
- Is there a deadline driving the sale (1031 exchange, divorce, estate, relocation)? That informs how much negotiation room exists.
- What's the average days-on-market for RENTAL listings here right now (not sales)? A rising rental-DOM trend means longer vacancies and softer asking-rent achievability than the comps imply.
- What's the recent tenant-quality profile in this submarket — average credit score on applications, eviction rate, late-payment / NSF rate, and stable-employment percentage? A property-management company in the area should have these aggregated.
- How much new for-sale + rental construction is in the pipeline within 1–3 miles? Heavy new supply typically softens prices + rents 12–24 months out; constrained supply supports both.
Investment metrics
- 1% rule
- 1.29% ✓
- Cap rate
- 11.34%
- Cash-on-cash
- 18.04%
- DSCR
- 1.80
- GRM
- 6.5
CMA / ARV
No comps found within radius.
Projected returns pro-forma
6.31% appreciation · 3.0% rent growth · sell at horizon
- IRR
- 31.0%
- Equity multiple
- 3.05×
- Total profit
- $44,251
- Equity at exit
- $49,898
- IRR
- 28.6%
- Equity multiple
- 6.27×
- Total profit
- $113,591
- Equity at exit
- $91,804
Cash invested: $21,560 (down + closing). Projections, not guarantees.
Landlord ↔ Tenant lean methodology
- Overall (STATE)
- 71 Landlord-Friendly
- State Nevada
- 71 Landlord-Friendly · R+1
- County
- — inherits STATE
- City
- — inherits STATE
ZIP-level market 89040
- Home prices YoY
- 2.7%
- Active inventory
- 72
- Price-to-rent
- 6.5×
Monthly cashflow live
- Estimated rent
- $992 medium interval (Pro) →
- Mortgage (P&I)
- −$404
- Tax from tax record
- −$24 /mo · $286/yr
- Insurance
- −$32
- HOA
- −$0
- Vacancy / Maint / Mgmt
- −$208
- Net cashflow
- $324
Break-even live
Sensitivity live
| Price | -10% $368 | -5% $346 | +0% $324 | +5% $302 | +10% $281 |
|---|---|---|---|---|---|
| Rent | -10% $246 | -5% $285 | +0% $324 | +5% $363 | +10% $403 |
| Rate | -1.0pp $363 | -0.5pp $344 | base $324 | +0.5pp $304 | +1.0pp $284 |
UW: 25.0% down · 7.5% · 30yr · 1.5% tax · 5.0% vac · 8.0% maint · 8.0% mgmt
Financing live
Cash to close
- Down payment
- $19,250
- Closing costs
- $2,310
- Reserves months
- —
- Total cash needed
- —
Loan-product check · same deal, 3 products live
Conventional
25% down · 7.5% · 30yr
- Down + closing
- —
- Monthly P&I
- —
- Monthly cashflow
- —
- DSCR
- —
- Eligible?
- —
Personal DTI + credit; lowest rate.
DSCR
20% down · 8.5% · 30yr
- Down + closing
- —
- Monthly P&I
- —
- Monthly cashflow
- —
- DSCR
- —
- Eligible?
- —
No personal income docs; deal must DSCR.
Hard money
10% down · 12.0% · 12mo
- Down + closing
- —
- Monthly P&I
- —
- Monthly cashflow
- —
- DSCR
- —
- Eligible?
- —
Short-term bridge; refi at stabilization.
Listing history 34 events
-
2026-06-13days on market $77,000 Active 180 DOM
-
2026-06-09days on market $77,000 Active 176 DOM
-
2026-06-08days on market $77,000 Active 175 DOM
-
2026-06-08days on market $77,000 Active 174 DOM
-
2026-06-03days on market $77,000 Active 170 DOM
-
2026-06-02days on market $77,000 Active 169 DOM
-
2026-06-01days on market $77,000 Active 168 DOM
-
2026-05-31days on market $77,000 Active 167 DOM
-
2025-12-14$77,000 Active 72-char remark
Show marketing remark (72 chars)
Property ready for manufactured home or build the home of your dreams. !
-
2025-12-12historical
-
2025-09-24price $69,000
-
2025-08-22price $74,000
-
2025-07-26price $99,000
-
2025-06-12price $125,000
-
2025-04-23$150,000 Active
-
2021-03-15historical
-
2020-09-29price $30,000
-
2020-09-26$39,999 Active
-
2020-02-25historical
-
2019-09-28$30,000 Active
-
2019-09-01historical
-
2019-06-20price $24,900
-
2018-12-12price $25,000
-
2018-09-08price $28,000
-
2018-08-02price $29,000
-
2018-04-05price $30,000
-
2018-04-02price $31,000
-
2018-03-09$32,000 Active
-
2018-02-03historical
-
2017-11-10price $29,000
-
2017-08-09price $29,500
-
2017-02-07$30,000 Active
-
1995-11-29soldstatus $25,000
-
1995-10-12soldstatus $26,250
ⓘ Source: listings_history table (triggers on properties + properties_extension) + one-shot
backfill from property_details.listing_events for pre-trigger history.
Tax reassessment forecast NV · Resets to sale price
- Current annual tax
- $286 · $24/mo
- Projected year-2 tax
- $454 · $38/mo
- Expected delta
- +$168/yr (+$14/mo · 58.8%)
ⓘ Screening estimate from a state-policy table — verify with the county assessor before closing.
Climate risk First Street
- Flood 4/10 Moderate FEMA zone X (unshaded) · 20% chance over 30 yrs
- Wildfire 5/10 Major
- Heat 8/10 Severe 7 d/yr ≥110°F today · 15 d/yr by 30 yrs out
- Wind 1/10 Low
- Air quality 1/10 Low 0 unhealthy d/yr today · 0 by 30 yrs out
Nearby sold comps map
Loading sold comps map…
Walkable amenities ~0.75 mi
Loading nearby amenities…
Taxation est. · year 1
- Rental income
- $11,907
- − Mortgage interest
- −$4,313
- − Property taxes
- −$286
- − Insurance
- −$385
- − Repairs & maintenance
- −$953
- − Management
- −$953
- − Depreciation
- −$2,240
- Taxable income
- $2,778
- Est. tax owed @ 24.0%
- −$667
- After-tax cash flow
- $3,223/yr
For passive investors: Depreciation is non-cash, so a rental often shows a tax loss while cash-flowing — sheltering income. Rental losses are passive: they offset passive income freely, and up to $25,000/yr can offset ordinary (W-2) income if you actively participate and your MAGI is under $100k (phasing out to $0 by $150k); unused losses carry forward. On sale, claimed depreciation is recaptured at up to 25%, and gains may owe capital-gains tax (a 1031 exchange can defer both). Figures are a year-1 estimate at your 24.0% rate — not tax advice; consult a CPA.
Schools (NCES district)
- District
- Clark County School District
- NCES district ID
- 3200060
- Math proficiency
- 21% ▼ -13.00%
- Reading proficiency
- 39% ▼ -8.00%
- Median HH income
- $53,611
- Composite
- 26.48/100
- National rank
- #7211
- State rank
- #11 of 17 in NV
Livability — Moapa Valley
- Score
- 60/100
- State rank
- #77
- US rank
- #18937
Category grades
Schools grade is shown separately in the Schools card above.
Census & demographics
- Census place
- Moapa Valley, NV
- City population
- 3,079
- Population (ZIP)
- 3,842
Population outlook (Clark County) Hauer SSP2
- Today (2025)
- 2,504,101 people
- By 2030
- 2,693,770 · +7.6%
- By 2040
- 3,061,208 · +22.2%
- By 2050
- 3,400,072 · +35.8%
- By 2075
- 4,139,522 · +65.3%
- By 2100
- 4,596,916 · +83.6%
Race, ethnicity, and origin ACS 2023
- Neighborhood character
- Predominantly White (81%)
- Race & ethnicity
- White 81% Hispanic / Latino 15% Two or more races 6% Native American 2%
- Hispanic origin (detail)
- Mexican 11%
- Common ancestry
- Slovak 6% Iranian 2% Italian 2%
- Foreign-born
- 5% · Canada
- Languages at home
- 92% English-only · Spanish 7% Tagalog/Filipino 1%
Political lean MEDSL · Clark
- 2024 margin
- Toss-up / Even · D 50.4% · R 47.8% · Other 1.7%
- 2008→2024 swing
- -16.5pp toward R · 2008: 19.1pp · 2024: 2.6pp
- All cycles
- 2024: D+2.6 2020: D+9.3 2016: D+10.7 2012: D+14.5 2008: D+19.1
Not yet ingested
- Civics
- —
Market trends
- HPI YoY
- ▲ 6.31%
- Current HPI
- 242.3182
- Rent YoY
- —
- Metro
- —
- State GDP YoY
- ▲ 3.08%
- F500 in state
- 6
Industry mix (Fortune 500 HQ in NV)
| Industry | F500 HQs | Revenue |
|---|---|---|
| Hotels / Casinos | 3 | $36B |
|
||
Price history
+193.3% since first listed26 events — show timeline
- 2025-12-14 Listed $77,000 GLVAR
- 2025-12-12 Listing Removed — GLVAR
- 2025-09-24 Price Changed $69,000 GLVAR
- 2025-08-22 Price Changed $74,000 GLVAR
- 2025-07-26 Price Changed $99,000 GLVAR
- 2025-06-12 Price Changed $125,000 GLVAR
- 2025-04-23 Listed $150,000 GLVAR
- 2021-03-15 Listing Removed — GLVAR
- 2020-09-29 Price Changed $30,000 GLVAR
- 2020-09-26 Listed $39,999 GLVAR
- 2020-02-25 Listing Removed — GLVAR
- 2019-09-28 Listed $30,000 GLVAR
- 2019-09-01 Listing Removed — GLVAR
- 2019-06-20 Price Changed $24,900 GLVAR
- 2018-12-12 Price Changed $25,000 GLVAR
- 2018-09-08 Price Changed $28,000 GLVAR
- 2018-08-02 Price Changed $29,000 GLVAR
- 2018-04-05 Price Changed $30,000 GLVAR
- 2018-04-02 Price Changed $31,000 GLVAR
- 2018-03-09 Listed $32,000 GLVAR
- 2018-02-03 Listing Removed — GLVAR
- 2017-11-10 Price Changed $29,000 GLVAR
- 2017-08-09 Price Changed $29,500 GLVAR
- 2017-02-07 Listed $30,000 GLVAR
- 1995-11-29 Sold (Public Records) $25,000 Public Records
- 1995-10-12 Sold (Public Records) $26,250 Public Records
Property tax history
-2.3%/yrLatest (2025): $286 · -1.0% YoY. Source: county tax records.
Cash-flow waterfall
monthlySold comps — $/sqft
last 12 mo · ≤1 miLoading sold comps…