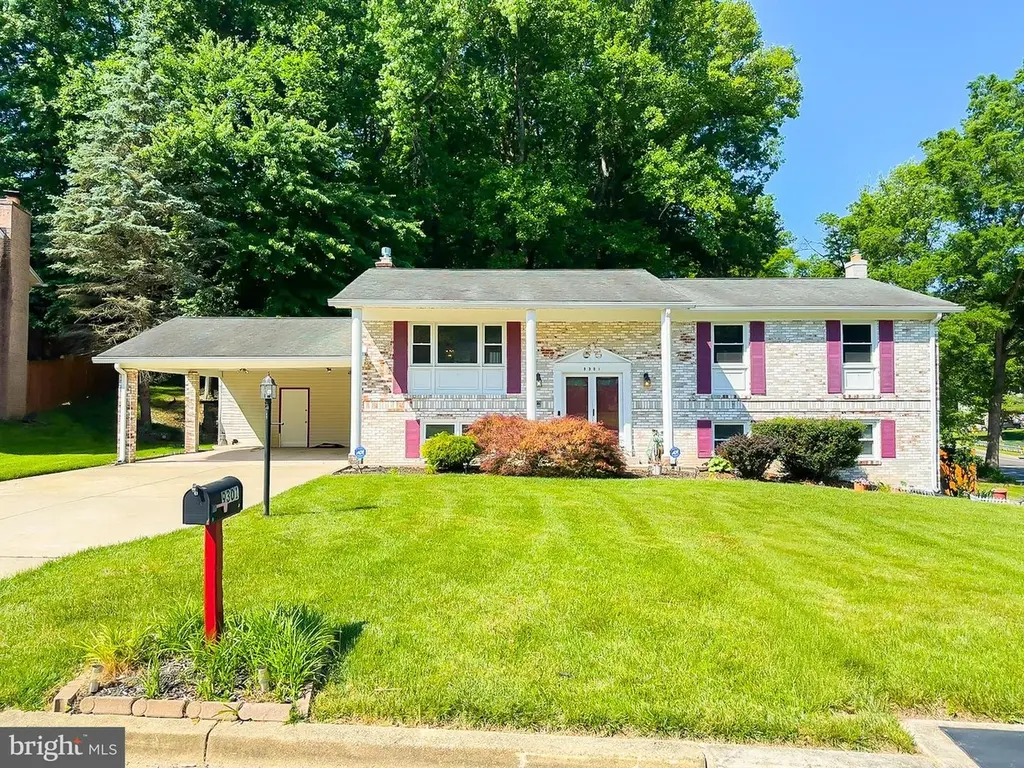
9301 Midland Turn · Marlton, MD
Flood risk 9/10 · Severe
- FEMA flood zone
- X (unshaded)
- Chance of flooding over 30 yrs
- 0.99%
- Est. flood insurance / yr
- $473 – $860
Fire risk 4/10 · Minor
- Est. fire insurance / yr
- $755 – $1,403
Heat risk 8/10 · Major
- Hot days now (above 103°F)
- 7 days/yr
- Hot days in 30 yrs
- 16 days/yr
Wind risk 5/10 · Moderate
- Chance of severe wind over 30 yrs
- 25.0%
Air-quality risk 2/10 · Minimal
- Unhealthy air days now
- 2 days/yr
- Unhealthy air days in 30 yrs
- 2 days/yr
Risk factors via First Street. Map © Google.
Why this score? — see what drove the F grade
The composite is a weighted blend of 9 inputs, each scored 0–100. Each bar is that input's sub-score; the figure is the points it added to the 100-point composite (weight × sub-score).
- ARV discount +9.7/15.0
- Cash flow +7.7/30.0
- Rent growth +5.0/5.0
- Livability +3.3/5.0
- Condition / age +2.5/5.0
- 1% rule +1.9/10.0
- DSCR +1.8/10.0
- Schools +1.7/10.0
- Appreciation +0.0/10.0
$464,900
🖨 Deal sheet 📄 Offer letter ✓ Due diligence
Listing remarks
Pulling up to this magnificent Split Foyer, you will be impressed with the stunning views of the community. As you enter the main level, you will be greeted by elegant Balusters and beautiful hardwood floors throughout. Traveling upstairs to level one, the traditional floor plan concept features an open family room, dining area and a nice size kitchen with gorgeous ceramic tile floors and plenty of cabinets and stainless steel appliances. Say Hello to the large sunroom/ deck off kitchen that has sufficient space to entertain family and guests comfortably, Continuing on the main level, you will encounter a Primary Suite with a Primary Bath and a relaxing sitting area in the back of the prima
Key facts
- Large sunroom
- Stunning views
- Open family room
Tags
Property features AI
Finance
- HOA & community: Ground rent paid annually
Exterior
- Parking: Off-street parking; Attached carport with 4 spaces (total garage/parking spaces: 4)
- Utilities: Public water; Public sewer; Electric service available; Natural gas available; Cable TV available
- Home design: Detached property; Asphalt roof; Built in (year from assessor); Crawl space foundation; Walkout, fully finished basement with connecting stairway
- Construction: Brick construction
- Exterior features: Flood lights; Deck(s); Shed; Landscaped yard; Backs to trees; Corner lot
Interior
- Kitchen: Dishwasher; Disposal; Microwave; Electric range/oven; Self-cleaning oven; Range hood; Refrigerator
- Bedrooms: Two bedrooms on the main level; Two bedrooms on the lower level
- Flooring: Hardwood floors
- Bathrooms: Two full bathrooms on the main level; One full bathroom on the lower level; Three full bathrooms total
- Heating & cooling: Central heating (natural gas); Central air conditioning (electric); Hot water heated by natural gas; Fireplace with glass doors, mantel and screen
- Interior features: Table space in kitchen; Dining area; Window treatments; Master bathroom; Wet/dry bar; Traditional floor plan; Storm doors
- Laundry & utility: Washer and dryer in unit on lower floor; Sump pump in basement
Neighborhood map
What this means for you Summary
Snapshot
- This is a 4-bed/3.0-bath single-family listed at $465k.
Deal economics
- At list price, monthly cash flow is $-590 ($-7k/yr) — negative.
- To cash-flow at today's rent, offer at most $361k (22.4% below list).
- To meet the 1% rule (rent ≥ 1% of price), the offer needs to be $322k (30.7% below list).
- Recommended offer: $322k (30.7% below list) — sets the bar for 1% rule.
Location & tenants
- Location reads 66/100 on livability (#224 in MD) — a middle-class / working-renter tenant base. Strengths: employment A+, housing A+; Watch: amenities F, commute F, cost of living D-.
- Prince George'S County Public Schools (suburban): math 8% / reading 24% proficiency, ranked #21 of 24 in MD (top 88%) — low school quality limits family demand, transient renter base, plan for 1-2y turnover.
- Zoned schools: Frederick Douglass High (math 18% / reading 40%, grade F, #157 of 222 statewide, top 71%, 1,159 students, 47% FRL).
- Zoned-school proficiency averages 29% at this address vs 16% district-wide (+13 pts) — the actual schools serving this property are materially stronger than the Prince George'S County Public Schools average implies; a family-tenant draw the district grade alone would hide.
- Market conditions: Rents rising fast (+9.8%/yr); 309 active listings in the ZIP; 8 comparable units currently listed for rent nearby; rentals leasing fast (median 13d on market — plan ~1-2 weeks tenant-placement turnaround); high-income renter base; 1,481 units permitted in Prince George's County in 2024 (0 in 5+ unit buildings).
Forward outlook
- Local home prices are declining (-3.0%/yr); year-one equity from $3k of loan paydown is wiped out by about $14k of value loss. Plan a longer hold.
- Prince George's County population projected at +18% by 2050 — long-run rental-demand tailwind backs the buy-and-hold thesis.
Negotiation context
- Only 5 days on market — expect competitive offers; lowballing is unlikely to land.
- 2 sale attempts since 27y ago with the ask held roughly flat each time — persistent listings suggest the price (not the market) is what's stuck; bring a comps-based counter.
- Current owner paid $168k; list at $465k implies a 177% gain — meaningful room to come down on a strong offer.
Risks & watch-outs
- Watch-outs: flood insurance adds $56/mo.
- Climate carrying-cost: severe flood risk; moderate wind risk, 25% chance of damaging wind over 30y; extreme-heat days projected 7→16/yr by 2055 (HVAC capex compounding) — expect insurance premiums to compound above CPI over the hold.
Questions for the listing agent
- What do current leases actually rent for vs. the listed asking? Can we see a recent rent roll and the last 12 months of T-12 income?
- Built in 1977 — when were the roof, HVAC, electrical panel, plumbing, and water heater last replaced?
- What's the actual annual flood-insurance premium (NFIP or private), and is the property in a SFHA with mandatory coverage?
- Is there a deadline driving the sale (1031 exchange, divorce, estate, relocation)? That informs how much negotiation room exists.
- Schools are D-rated, which usually means shorter tenancies and higher turnover. Who's the typical renter profile here, and what's been the actual vacancy rate?
- The area grade is low — what's the realistic commute time and amenity access for the typical tenant pool here? Any planned neighborhood developments (good or bad) we should know about?
- What's the average days-on-market for RENTAL listings here right now (not sales)? A rising rental-DOM trend means longer vacancies and softer asking-rent achievability than the comps imply.
- What's the recent tenant-quality profile in this submarket — average credit score on applications, eviction rate, late-payment / NSF rate, and stable-employment percentage? A property-management company in the area should have these aggregated.
- How much new for-sale + rental construction is in the pipeline within 1–3 miles? Heavy new supply typically softens prices + rents 12–24 months out; constrained supply supports both.
Investment metrics
- 1% rule
- 0.69% ✗
- Cap rate
- 4.91%
- Cash-on-cash
- -4.93%
- DSCR
- 0.78
- GRM
- 12.0
CMA / ARV
- ARV (on-the-fly)
- $488,600
- Comps found
- 7
Show comp detail 7 sales within ~0.75 mi
| Address | Dist | Beds/Ba | Sqft | Sold | Price | $/sf | Match |
|---|---|---|---|---|---|---|---|
| 9110 Midland Turn | 0.29mi | 4/2.5 | 1,436 (+3%) | 14mo | $430,000 | $299 | 69 |
| 12222 Mccullagh Ct | 0.18mi | 3/3.0 (-1) | 1,336 (-5%) | 15mo | $468,120 | $350 | 66 |
| 9113 Fairhaven Ave | 0.19mi | 4/3.0 | 1,248 (-11%) | 11mo | $445,000 | $357 | 64 |
| 8704 Baskerville Pl | 0.58mi | 3/2.0 (-1) | 1,300 (-7%) | 9mo | $385,000 | $296 | 44 |
| 9602 Tam O Shanter Dr | 0.50mi | 3/2.0 (-1) | 1,309 (-6%) | 15mo | $370,000 | $283 | 44 |
| 12605 Thrush Pl | 0.51mi | 3/3.0 (-1) | 1,214 (-13%) | 8mo | $430,000 | $354 | 42 |
| 11707 Medallion Ter | 0.69mi | 3/2.5 (-1) | 1,218 (-13%) | 5mo | $425,000 | $349 | 35 |
Match score weights: distance 35% · size 25% · config 20% · recency 20%. Top-matched comps best support the ARV.
Projected returns pro-forma
-3.0% appreciation · 8.0% rent growth · sell at horizon
- IRR
- -20.3%
- Equity multiple
- 0.26×
- Total profit
- $-95,908
- Equity at exit
- $69,318
- IRR
- -5.3%
- Equity multiple
- 0.58×
- Total profit
- $-54,425
- Equity at exit
- $40,196
Cash invested: $130,172 (down + closing). Projections, not guarantees.
Landlord ↔ Tenant lean methodology
- Overall (STATE)
- 27 Tenant-Leaning
- State Maryland
- 27 Tenant-Leaning · D+14
- County
- — inherits STATE
- City
- — inherits STATE
ZIP-level market 20772
- Rents YoY
- 9.8%
- Active inventory
- 309
- Price-to-rent
- 12.0×
Monthly cashflow live
- Estimated rent
- $3,222 high interval (Pro) →
- Mortgage (P&I)
- −$2,438
- Tax from tax record
- −$449 /mo · $5,385/yr
- Insurance
- −$194
- Flood insurance flood zone
- −$56 /mo · $666/yr
- HOA
- −$0
- Vacancy / Maint / Mgmt
- −$677
- Net cashflow
- $-590
Break-even live
UW: 25.0% down · 7.5% · 30yr · 1.5% tax · 5.0% vac · 8.0% maint · 8.0% mgmt
Financing live
Cash to close
- Down payment
- $116,225
- Closing costs
- $13,947
- Reserves months
- —
- Total cash needed
- —
Loan-product check · same deal, 3 products live
Conventional
25% down · 7.5% · 30yr
- Down + closing
- —
- Monthly P&I
- —
- Monthly cashflow
- —
- DSCR
- —
- Eligible?
- —
Personal DTI + credit; lowest rate.
DSCR
20% down · 8.5% · 30yr
- Down + closing
- —
- Monthly P&I
- —
- Monthly cashflow
- —
- DSCR
- —
- Eligible?
- —
No personal income docs; deal must DSCR.
Hard money
10% down · 12.0% · 12mo
- Down + closing
- —
- Monthly P&I
- —
- Monthly cashflow
- —
- DSCR
- —
- Eligible?
- —
Short-term bridge; refi at stabilization.
Rent comps 8 comps
| Address | Beds | Baths | Sqft | Rent | $/sqft | DOM | Units | Dist |
|---|---|---|---|---|---|---|---|---|
| 9023 Florin Way Upper Marlboro, MD | 3.0 | 1.5 | 1268 | $3,190 | $2.52 | 43d | 1 | 0.49mi |
| 12605 Trumbull Dr Upper Marlboro, MD | 3.0 | 2.5 | 1422 | $2,500 | $1.76 | 5d | 1 | 0.50mi |
| 12705 Town Center Way Upper Marlboro, MD | 3.0 | 2.5 | 1240 | $2,700 | $2.18 | 18d | 1 | 0.82mi |
| 12825 Town Center Way Upper Marlboro, MD | 3.0 | 2.5 | 1854 | $2,900 | $1.56 | 43d | 1 | 0.90mi |
| 11904 N Marlton Ave Upper Marlboro, MD | 4.0 | 3.0 | 1444 | $2,900 | $2.01 | 12d | 1 | 0.92mi |
| 12902 Woods View St Upper Marlboro, MD | 3.0 | 3.5 | 1360 | $2,695 | $1.98 | 12d | 1 | 0.96mi |
| 8605 Sweet Rose Ct Upper Marlboro, MD | 3.0 | 3.5 | 1600 | $3,200 | $2.00 | 5d | 1 | 1.00mi |
| 8516 Grandhaven Ave Upper Marlboro, MD | 3.0 | 2.5 | 1332 | $2,900 | $2.18 | 12d | 1 | 1.09mi |
Listing history 8 events
-
2026-06-03status $464,900 Pending 5 DOM
-
2026-05-23$464,900 Active
-
2000-01-31soldstatus $168,000
-
2000-01-04soldstatus $167,000
-
1999-12-08historical
-
1999-09-02$172,000
-
1984-06-04soldstatus $115,000
-
1977-03-22soldstatus $72,650
ⓘ Source: listings_history table (triggers on properties + properties_extension) + one-shot
backfill from property_details.listing_events for pre-trigger history.
Tax reassessment forecast MD · Partial reset (capped growth)
- Current annual tax
- $5,385 · $449/mo
- Projected year-2 tax
- $5,385 · $449/mo
- Expected delta
- $0/yr ($0/mo · 0.0%)
ⓘ Screening estimate from a state-policy table — verify with the county assessor before closing.
Climate risk First Street
- Flood 9/10 Extreme FEMA zone X (unshaded) · 99% chance over 30 yrs
- Wildfire 4/10 Moderate
- Heat 8/10 Severe 7 d/yr ≥103°F today · 16 d/yr by 30 yrs out
- Wind 5/10 Major 25% chance of damaging wind over 30 yrs
- Air quality 2/10 Low 2 unhealthy d/yr today · 2 by 30 yrs out
Nearby sold comps map
Loading sold comps map…
Walkable amenities ~0.75 mi
Loading nearby amenities…
Taxation est. · year 1
- Rental income
- $38,667
- − Mortgage interest
- −$26,042
- − Property taxes
- −$5,385
- − Insurance
- −$2,991
- − Repairs & maintenance
- −$3,093
- − Management
- −$3,093
- − Depreciation
- −$13,524
- Taxable loss
- −$15,462
- Est. tax savings @ 24.0%
- +$3,711
- After-tax cash flow
- $-3,374/yr
For passive investors: Depreciation is non-cash, so a rental often shows a tax loss while cash-flowing — sheltering income. Rental losses are passive: they offset passive income freely, and up to $25,000/yr can offset ordinary (W-2) income if you actively participate and your MAGI is under $100k (phasing out to $0 by $150k); unused losses carry forward. On sale, claimed depreciation is recaptured at up to 25%, and gains may owe capital-gains tax (a 1031 exchange can defer both). Figures are a year-1 estimate at your 24.0% rate — not tax advice; consult a CPA.
Schools (NCES district)
- District
- Prince George'S County Public Schools
- NCES district ID
- 2400510
- Math proficiency
- 8% ▼ -11.00%
- Reading proficiency
- 24% ▼ -9.00%
- Median HH income
- $73,967
- Composite
- 16.82/100
- National rank
- #9151
- State rank
- #21 of 24 in MD
Livability — Marlton
- Score
- 66/100
- State rank
- #224
- US rank
- #11234
Category grades
Schools grade is shown separately in the Schools card above.
Census & demographics
- Census place
- Marlton, MD
- County
- Prince Georges County · 919,866 people
- Metro
- Washington-Arlington-Alexandria, DC-VA-MD-WV
- Population (ZIP)
- 54,319
- Household income
- $139,403
- Rent vs Own
- Severe rent burden
- 524.0
Population outlook (Prince George's County) Hauer SSP2
- Today (2025)
- 1,005,426 people
- By 2030
- 1,048,416 · +4.3%
- By 2040
- 1,123,425 · +11.7%
- By 2050
- 1,183,220 · +17.7%
- By 2075
- 1,306,202 · +29.9%
- By 2100
- 1,408,179 · +40.1%
Race, ethnicity, and origin ACS 2023
- Neighborhood character
- Predominantly Black (78%)
- Race & ethnicity
- Black 78% White 10% Hispanic / Latino 7% Two or more races 5% Asian 1%
- Hispanic origin (detail)
- Mexican 1%
- Foreign-born
- 10% · Canada, China
- Languages at home
- 88% English-only · Spanish 5% French/Haitian/Cajun 1% Other Indo-European 1%
Political lean MEDSL · Prince George's
- 2024 margin
- Solid D (+75.2) · D 86.3% · R 11.2% · Other 2.5%
- 2008→2024 swing
- -3.3pp toward R · 2008: 78.5pp · 2024: 75.2pp
- All cycles
- 2024: D+75.2 2020: D+80.5 2016: D+81.0 2012: D+80.9 2008: D+78.5
Not yet ingested
- Civics
- —
Market trends
- HPI YoY
- ▼ -184.63%
- Current HPI
- 251.8236
- Rent YoY
- ▲ 9.80%
- Metro
- Washington-Arlington-Alexandria, DC-VA-MD-WV
- State GDP YoY
- ▲ 2.97%
- F500 in state
- 12
Industry mix (Fortune 500 HQ in MD)
| Industry | F500 HQs | Revenue |
|---|---|---|
| Aerospace / Defense | 1 | $71B |
|
||
| Utilities | 1 | $25B |
|
||
| Hotels | 1 | $24B |
|
||
| Consumer Goods | 1 | $7B |
|
||
| Real Estate | 1 | $6B |
|
||
| Chemicals | 1 | $2B |
|
||
Price history
+539.9% since first listed7 events — show timeline
- 2026-05-23 Listed $464,900 BRIGHT MLS
- 2000-01-31 Sold (MLS) $168,000 MRIS
- 2000-01-04 Sold (Public Records) $167,000 Public Records
- 1999-12-08 Delisted — MRIS
- 1999-09-02 Listed $172,000 MRIS
- 1984-06-04 Sold (Public Records) $115,000 Public Records
- 1977-03-22 Sold (Public Records) $72,650 Public Records
Property tax history
+5.7%/yrLatest (2025): $5,385 · +5.4% YoY. Source: county tax records.
Cash-flow waterfall
monthlySold comps — $/sqft
last 12 mo · ≤1 miLoading sold comps…