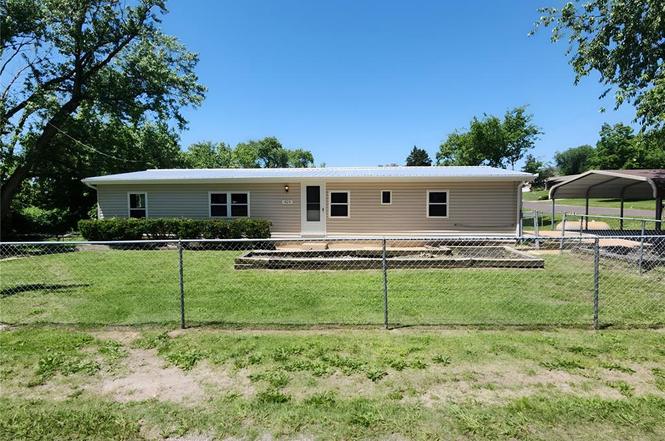
429 Orr St · Pacific, MO
Flood risk No data
- FEMA flood zone
- —
- Chance of flooding over 30 yrs
- —
- Est. flood insurance / yr
- —
Fire risk No data
- Est. fire insurance / yr
- —
Heat risk No data
- Hot days now (above threshold)
- —
- Hot days in 30 yrs
- —
Wind risk No data
- Chance of severe wind over 30 yrs
- —
Air-quality risk No data
- Unhealthy air days now
- —
- Unhealthy air days in 30 yrs
- —
Risk factors via First Street. Map © Google.
Why this score? — see what drove the C grade
The composite is a weighted blend of 9 inputs, each scored 0–100. Each bar is that input's sub-score; the figure is the points it added to the 100-point composite (weight × sub-score).
- Cash flow +24.5/30.0
- DSCR +7.9/10.0
- ARV discount +7.5/15.0
- 1% rule +5.2/10.0
- Schools +3.4/10.0
- Livability +3.2/5.0
- Rent growth +2.5/5.0
- Condition / age +2.5/5.0
- Appreciation +0.0/10.0
$138,900
🖨 Deal sheet 📄 Offer letter ✓ Due diligence
Listing remarks MLS
*** CHECK THIS ONE OUT FOR ONLY $65,000! *** 3 BR 2 Bath with updated baths, laminate wood flooring & ceramic tile throughout, nice covered front patio, really large fenced in yard with 25 x 14 utility shed, main floor laundry leads to small garden area room. Nicely maintained but selling "AS IS" *** This one is priced to sell so call for your viewing now! *** Buyer to take care of getting City Occupancy Inspection.
Key facts
- Spacious backyard
- 9,016 sq ft lot
- 2 parking spots
Tags
Property features AI
Exterior
- Parking: Two-space carport
- Utilities: Electric service: Ameren; Public water; Public sewer
- Home design: Single-family residence; One level
- Construction: Vinyl siding
- Exterior features: Level lot; Public water; Public sewer
Interior
- Bedrooms: Three bedrooms, all on the main level
- Bathrooms: Two full bathrooms (main level)
- Heating & cooling: Forced air heating; Central air conditioning
- Interior features: Crawl space basement; Level lot (exterior lot feature)
Neighborhood map
What this means for you Summary
Snapshot
- This is a 3-bed/1.0-bath manufactured listed at $139k.
Deal economics
- At list price, monthly cash flow is $286 ($3k/yr) — positive.
- The deal already cash-flows at list — no discount required.
- Meets the 1% rule at list price ($1k rent vs $139k).
- Cap rate 8.8% vs local median 3.8% in Pacific — top-decile yield for the area; either an underpriced asset or a hidden risk that comps aren't pricing in. Stress-test before assuming the spread holds.
Location & tenants
- Location reads 65/100 on livability (#268 in MO) — a middle-class / working-renter tenant base. Strengths: cost of living A+, housing A+, crime A-; Watch: employment D+, amenities F, commute F.
- Meramec Valley R-III (town): math 36% / reading 42% proficiency, ranked #148 of 324 in MO (top 46%) — families likely to look elsewhere, expect single-tenant / working-renter base with shorter leases.
- Zoned schools: Truman Elem. (math 37% / reading 47%, grade F, #481 of 1,115 statewide, top 46%, 196 students, 40% FRL); Pacific High (math 15% / reading 43%, grade F, #407 of 521 statewide, top 78%, 951 students, 30% FRL).
- Market conditions: 130 active listings in the ZIP; 4 comparable units currently listed for rent nearby; rentals at typical pace (median 17d on market — plan ~3-4 weeks tenant-placement turnaround); 614 units permitted in Franklin County in 2024 (100 in 5+ unit buildings).
Forward outlook
- Local home prices are declining (-3.0%/yr); year-one equity from $960 of loan paydown is wiped out by about $4k of value loss. Plan a longer hold.
- Franklin County population projected to shrink 9% by 2050 — rents likely to lag national; underwrite the cash flow, not the appreciation.
Negotiation context
- Only 4 days on market — expect competitive offers; lowballing is unlikely to land.
- 2 sale attempts since 9y ago with the ask held roughly flat each time — persistent listings suggest the price (not the market) is what's stuck; bring a comps-based counter.
- Current owner paid $10k; list at $139k implies a 1289% gain — meaningful room to come down on a strong offer.
Questions for the listing agent
- Is there a deadline driving the sale (1031 exchange, divorce, estate, relocation)? That informs how much negotiation room exists.
- What's the average days-on-market for RENTAL listings here right now (not sales)? A rising rental-DOM trend means longer vacancies and softer asking-rent achievability than the comps imply.
- What's the recent tenant-quality profile in this submarket — average credit score on applications, eviction rate, late-payment / NSF rate, and stable-employment percentage? A property-management company in the area should have these aggregated.
- How much new for-sale + rental construction is in the pipeline within 1–3 miles? Heavy new supply typically softens prices + rents 12–24 months out; constrained supply supports both.
Investment metrics
- 1% rule
- 1.02% ✓
- Cap rate
- 8.76%
- Cash-on-cash
- 8.82%
- DSCR
- 1.39
- GRM
- 8.2
CMA / ARV
No comps found within radius.
Projected returns pro-forma
-3.0% appreciation · 3.0% rent growth · sell at horizon
- IRR
- -3.0%
- Equity multiple
- 0.89×
- Total profit
- $-4,366
- Equity at exit
- $20,710
- IRR
- 6.7%
- Equity multiple
- 1.50×
- Total profit
- $19,405
- Equity at exit
- $12,010
Cash invested: $38,892 (down + closing). Projections, not guarantees.
Landlord ↔ Tenant lean methodology
- Overall (STATE)
- 81 Strongly Landlord-Friendly
- State Missouri
- 81 Strongly Landlord-Friendly · R+10
- County
- — inherits STATE
- City
- — inherits STATE
ZIP-level market 63069
- Home prices YoY
- -20.3%
- Active inventory
- 130
- Price-to-rent
- 8.2×
Monthly cashflow live
- Estimated rent
- $1,419 medium interval (Pro) →
- Mortgage (P&I)
- −$728
- Tax from tax record
- −$49 /mo · $586/yr
- Insurance
- −$58
- HOA
- −$0
- Vacancy / Maint / Mgmt
- −$298
- Net cashflow
- $286
Break-even live
UW: 25.0% down · 7.5% · 30yr · 1.5% tax · 5.0% vac · 8.0% maint · 8.0% mgmt
Financing live
Cash to close
- Down payment
- $34,725
- Closing costs
- $4,167
- Reserves months
- —
- Total cash needed
- —
Loan-product check · same deal, 3 products live
Conventional
25% down · 7.5% · 30yr
- Down + closing
- —
- Monthly P&I
- —
- Monthly cashflow
- —
- DSCR
- —
- Eligible?
- —
Personal DTI + credit; lowest rate.
DSCR
20% down · 8.5% · 30yr
- Down + closing
- —
- Monthly P&I
- —
- Monthly cashflow
- —
- DSCR
- —
- Eligible?
- —
No personal income docs; deal must DSCR.
Hard money
10% down · 12.0% · 12mo
- Down + closing
- —
- Monthly P&I
- —
- Monthly cashflow
- —
- DSCR
- —
- Eligible?
- —
Short-term bridge; refi at stabilization.
Rent comps 4 comps
| Address | Beds | Baths | Sqft | Rent | $/sqft | DOM | Units | Dist |
|---|---|---|---|---|---|---|---|---|
| 1515 W Pacific St Unit 202 Pacific, MO | 2.0 | 1.0 | 1100 | $1,050 | $0.95 | 17d | 1 | 0.48mi |
| 1016 Westlake Village Dr Pacific, MO | 3.0 | 3.0 | 1405 | $2,275 | $1.62 | 1d | 1 | 1.02mi |
| 59 Cedar Ridge Dr Pacific, MO | 3.0 | 1.0 | 960 | $1,450 | $1.51 | 4d | 1 | 1.19mi |
| 2630 Lisa Ln Apt 113 Pacific, MO | 2.0 | 1.0 | 825 | $1,250 | $1.52 | 43d | 1 | 1.29mi |
Listing history 5 events
-
2026-06-18days on market $138,900 Active 4 DOM
-
2026-06-17days on market $138,900 Active 3 DOM
-
2026-06-16days on market $138,900 Active 2 DOM
-
2026-06-15remarks 613-char remark
-
2026-06-15$138,900 Active 1 DOM
ⓘ Source: listings_history table (triggers on properties + properties_extension) + one-shot
backfill from property_details.listing_events for pre-trigger history.
Tax reassessment forecast MO · Resets to sale price
- Current annual tax
- $586 · $49/mo
- Projected year-2 tax
- $1,347 · $112/mo
- Expected delta
- +$761/yr (+$63/mo · 130.0%)
ⓘ Screening estimate from a state-policy table — verify with the county assessor before closing.
Nearby sold comps map
Loading sold comps map…
Walkable amenities ~0.75 mi
Loading nearby amenities…
Taxation est. · year 1
- Rental income
- $17,025
- − Mortgage interest
- −$7,781
- − Property taxes
- −$586
- − Insurance
- −$694
- − Repairs & maintenance
- −$1,362
- − Management
- −$1,362
- − Depreciation
- −$4,041
- Taxable income
- $1,199
- Est. tax owed @ 24.0%
- −$288
- After-tax cash flow
- $3,141/yr
For passive investors: Depreciation is non-cash, so a rental often shows a tax loss while cash-flowing — sheltering income. Rental losses are passive: they offset passive income freely, and up to $25,000/yr can offset ordinary (W-2) income if you actively participate and your MAGI is under $100k (phasing out to $0 by $150k); unused losses carry forward. On sale, claimed depreciation is recaptured at up to 25%, and gains may owe capital-gains tax (a 1031 exchange can defer both). Figures are a year-1 estimate at your 24.0% rate — not tax advice; consult a CPA.
Schools (NCES district)
- District
- Meramec Valley R-III
- NCES district ID
- 2923460
- Math proficiency
- 36% ▼ -6.00%
- Reading proficiency
- 42% ▼ -7.00%
- Median HH income
- $49,982
- Composite
- 33.65/100
- National rank
- #5395
- State rank
- #148 of 324 in MO
Livability — Pacific
- Score
- 65/100
- State rank
- #268
- US rank
- #12622
Category grades
Schools grade is shown separately in the Schools card above.
Census & demographics
- Census place
- Pacific, MO
- Population (ZIP)
- 14,760
Population outlook (Franklin County) Hauer SSP2
- Today (2025)
- 103,600 people
- By 2030
- 103,298 · -0.3%
- By 2040
- 100,607 · -2.9%
- By 2050
- 94,280 · -9.0%
- By 2075
- 77,103 · -25.6%
- By 2100
- 54,405 · -47.5%
Race, ethnicity, and origin ACS 2023
- Neighborhood character
- Predominantly White (84%)
- Race & ethnicity
- White 84% Two or more races 10% Black 4% Hispanic / Latino 1%
- Common ancestry
- Serbian 3% Lithuanian 2% Italian 2%
- Foreign-born
- 2% · Canada
- Languages at home
- 98% English-only · Spanish 1%
Political lean MEDSL · Franklin
- 2024 margin
- Solid R (+45.9) · D 26.5% · R 72.4% · Other 1.1%
- 2008→2024 swing
- -33.5pp toward R · 2008: -12.4pp · 2024: -45.9pp
- All cycles
- 2024: R+45.9 2020: R+43.8 2016: R+46.1 2012: R+27.9 2008: R+12.4
Not yet ingested
- Civics
- —
Market trends
- HPI YoY
- ▼ -63.04%
- Current HPI
- 246.9938
- Rent YoY
- —
- Metro
- —
- State GDP YoY
- ▲ 1.84%
- F500 in state
- 20
Industry mix (Fortune 500 HQ in MO)
| Industry | F500 HQs | Revenue |
|---|---|---|
| Healthcare | 1 | $163B |
|
||
| Insurance | 1 | $21B |
|
||
| Industrial Technology | 1 | $17B |
|
||
| Retail | 1 | $16B |
|
||
| Industrial Distribution | 1 | $10B |
|
||
| Utilities | 1 | $9B |
|
||
Price history
+1289.0% since first listed9 events — show timeline
- 2026-06-14 Listed $138,900 MARIS as Distributed by MLS Grid
- 2018-03-12 Sold (Public Records) — Public Records
- 2018-03-09 Sold (MLS) — MARIS as Distributed by MLS Grid
- 2018-02-09 Pending — MARIS as Distributed by MLS Grid
- 2018-01-30 Contingent — MARIS as Distributed by MLS Grid
- 2017-11-08 Listed $65,000 MARIS as Distributed by MLS Grid
- 1991-01-18 Sold (Public Records) — Public Records
- 1983-01-24 Sold (Public Records) $10,000 Public Records
- 1982-02-17 Sold (Public Records) — Public Records
Property tax history
+5.1%/yrLatest (2025): $586 · +15.4% YoY. Source: county tax records.
Cash-flow waterfall
monthlySold comps — $/sqft
last 12 mo · ≤1 miLoading sold comps…