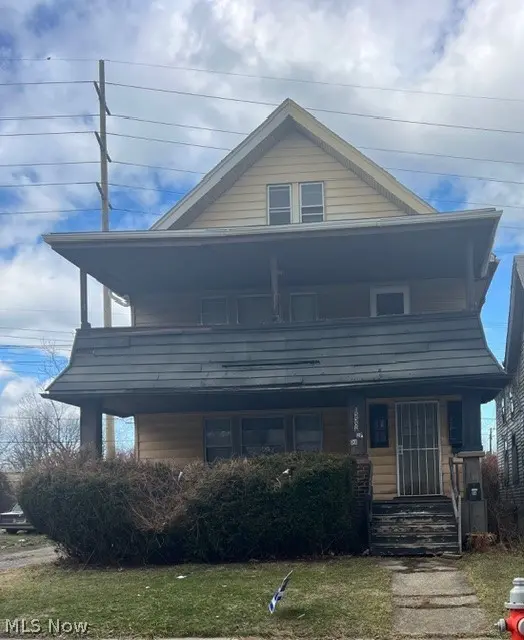
 Duplex
15506 Elderwood Ave · East Cleveland, OH
Flood risk 7/10 · Major
- FEMA flood zone
- X (unshaded)
- Chance of flooding over 30 yrs
- 0.76%
- Est. flood insurance / yr
- $473 – $860
Fire risk 1/10 · Minimal
- Est. fire insurance / yr
- $713 – $1,323
Heat risk 3/10 · Minor
- Hot days now (above 95°F)
- 7 days/yr
- Hot days in 30 yrs
- 17 days/yr
Wind risk 1/10 · Minimal
- Chance of severe wind over 30 yrs
- —
Air-quality risk 3/10 · Minor
- Unhealthy air days now
- 3 days/yr
- Unhealthy air days in 30 yrs
- 5 days/yr
Risk factors via First Street. Map © Google.
Why this score? — see what drove the D grade
The composite is a weighted blend of 9 inputs, each scored 0–100. Each bar is that input's sub-score; the figure is the points it added to the 100-point composite (weight × sub-score).
- Cash flow +15.0/30.0
- ARV discount +7.5/15.0
- 1% rule +5.0/10.0
- DSCR +5.0/10.0
- Rent growth +3.8/5.0
- Livability +3.3/5.0
- Condition / age +2.5/5.0
- Schools +0.7/10.0
- Appreciation +0.0/10.0
$49,000
🖨 Deal sheet 📄 Offer letter ✓ Due diligence
Multi-family units
County records classify this as Multi-Family (2-4 Unit). Listing-text estimate: 2 units. confirmed
Listing remarks MLS
Investor special! Occupied duplex generating income from day one. Property needs some TLC but offers strong upside for those willing to make improvements. Increase rents, build equity, and enhance overall performance with strategic updates. Don’t miss this opportunity to secure a property with built-in income and future potential.
Key facts
- 4,521 sq ft lot
- 2 garage spots
- Built 1922
Neighborhood map
What this means for you Summary
Snapshot
- This is a 2 × 2-bed/1.0-bath units multifamily listed at $49k.
Deal economics
- At list price, monthly cash flow is $1k ($15k/yr) — positive. Per door: $623/mo.
- The deal already cash-flows at list — no discount required.
- Meets the 1% rule at list price ($2k rent vs $49k).
- Recommended offer: $46k (6.0% below list) — sets the bar for market timing.
- Cap rate 38.2% vs local median 17.4% in East Cleveland — top-decile yield for the area; either an underpriced asset or a hidden risk that comps aren't pricing in. Stress-test before assuming the spread holds.
Location & tenants
- Location reads 66/100 on livability (#650 in OH) — a middle-class / working-renter tenant base. Strengths: commute A+, cost of living A+, health & safety A+; Watch: schools F, crime F, employment F.
- East Cleveland City School District (suburban): math 4% / reading 17% proficiency, ranked #652 of 656 in OH (top 99%) — low school quality limits family demand, transient renter base, plan for 1-2y turnover; 92% free/reduced lunch — lower-income household profile, screen leases tightly.
- Market conditions: Rents rising fast (+5.2%/yr); 99 active listings in the ZIP; 5 comparable units currently listed for rent nearby; rentals at typical pace (median 16d on market — plan ~3-4 weeks tenant-placement turnaround); lower-income renter base — watch delinquency; 1,441 units permitted in Cuyahoga County in 2024 (700 in 5+ unit buildings).
- At $2,074/mo this rent would consume 86% of the median local household income ($29k/yr) (locally 1702% of renters already pay >50% of income on rent) — very limited rent-growth headroom before tenants either downsize or default.
Forward outlook
- Local home prices are declining (-3.0%/yr); year-one equity from $339 of loan paydown is wiped out by about $1k of value loss. Plan a longer hold.
- Cuyahoga County population projected to shrink 8% by 2050 — rents likely to lag national; underwrite the cash flow, not the appreciation.
- At projected returns (-3.0% appreciation + 5.2% rent growth), your $14k cash investment doubles in ~1 year — after that, you're playing with house money.
Negotiation context
- It's been on market 83 days — a 6% lower offer ($46k) is reasonable based on typical stale-listing flexibility.
Risks & watch-outs
- Watch-outs: flood insurance adds $56/mo; built in 1922 — expect roof / HVAC / electrical / plumbing capex.
- Climate carrying-cost: major flood risk — expect insurance premiums to compound above CPI over the hold.
Questions for the listing agent
- It's been on market 83 days. Have you received any prior offers? Is the seller open to a 6% concession, seller financing, or rate buy-down credit?
- Can we see the unit-by-unit rent roll, current vacancy, and any below-market leases? What's the average tenancy length?
- What capital expenditures (roof, boiler, parking lot, exteriors) have been made in the last 5 years, and what's planned in the next 2?
- Built in 1922 — when were the roof, HVAC, electrical panel, plumbing, and water heater last replaced?
- What's the actual annual flood-insurance premium (NFIP or private), and is the property in a SFHA with mandatory coverage?
- Why hasn't it sold? Are there any deal-killer items the seller is aware of (foundation, flood, title, zoning, code violations)?
- Is there a deadline driving the sale (1031 exchange, divorce, estate, relocation)? That informs how much negotiation room exists.
- Schools are F-rated, which usually means shorter tenancies and higher turnover. Who's the typical renter profile here, and what's been the actual vacancy rate?
- Crime grade is F in this area — have there been break-ins, vandalism, or insurance claims at this property in the last 3 years? What carrier currently insures it and at what premium?
- The area grade is low — what's the realistic commute time and amenity access for the typical tenant pool here? Any planned neighborhood developments (good or bad) we should know about?
- What's the average days-on-market for RENTAL listings here right now (not sales)? A rising rental-DOM trend means longer vacancies and softer asking-rent achievability than the comps imply.
- What's the recent tenant-quality profile in this submarket — average credit score on applications, eviction rate, late-payment / NSF rate, and stable-employment percentage? A property-management company in the area should have these aggregated.
- How much new apartment / multifamily construction is in the pipeline within 1–3 miles? Heavy new supply (>2% of stock underway) typically softens rents 12–24 months out; light construction supports rent growth.
Investment metrics
- 1% rule
- 4.23% ✓
- Cap rate
- 38.18%
- Cash-on-cash
- 113.88%
- DSCR
- 6.07
- GRM
- 2.0
CMA / ARV
- ARV (median comp)
- $30,586
- List price
- $49,000
- Delta
- 60.21%
- Verdict
- OVERPRICED
- Comps
- 20 within 1.0 mi
Show comp detail 7 sales within ~0.75 mi
| Address | Dist | Beds/Ba | Sqft | Sold | Price | $/sf | Match |
|---|---|---|---|---|---|---|---|
| 14520 Strathmore Ave | 0.37mi | 5/3.0 (+1) | 2,220 (-3%) | 9mo | $130,000 | $59 | 61 |
| 1320 E 142nd | 0.46mi | 4/2.0 | 2,392 (+4%) | 21mo | $50,000 | $21 | 54 |
| 14012 Scioto Ave | 0.64mi | 5/3.0 (+1) | 2,209 (-4%) | 6mo | $95,000 | $43 | 50 |
| 935 Ravine Dr | 0.74mi | 4/2.5 | 2,519 (+10%) | 3mo | $161,500 | $64 | 44 |
| 14004 Savannah Ave | 0.59mi | 4/2.0 | 1,996 (-13%) | 13mo | $40,000 | $20 | 40 |
| 14310 Potomac Ave | 0.50mi | 5/2.0 (+1) | 1,982 (-13%) | 12mo | $36,000 | $18 | 39 |
| 13428 Hartford Rd | 0.72mi | 4/2.0 | 1,988 (-13%) | 9mo | $34,000 | $17 | 37 |
Match score weights: distance 35% · size 25% · config 20% · recency 20%. Top-matched comps best support the ARV.
Projected returns pro-forma
-3.0% appreciation · 5.16% rent growth · sell at horizon
- IRR
- —
- Equity multiple
- 6.55×
- Total profit
- $76,114
- Equity at exit
- $7,306
- IRR
- —
- Equity multiple
- 14.74×
- Total profit
- $188,510
- Equity at exit
- $4,237
Cash invested: $13,720 (down + closing). Projections, not guarantees.
Landlord ↔ Tenant lean methodology
- Overall (STATE)
- 73 Landlord-Friendly
- State Ohio
- 73 Landlord-Friendly · R+6
- County
- — inherits STATE
- City
- — inherits STATE
ZIP-level market 44112
- Rents YoY
- 5.2%
- Active inventory
- 99
- Price-to-rent
- 3.9×
Monthly cashflow live
- Estimated rent
- $2,074 high interval (Pro) →
- Mortgage (P&I)
- −$257
- Tax from tax record
- −$59 /mo · $709/yr
- Insurance
- −$20
- Flood insurance flood zone
- −$56 /mo · $666/yr
- HOA
- −$0
- Vacancy / Maint / Mgmt
- −$436
- Net cashflow
- $1,246
Break-even live
2-unit breakdown (identical units grouped — click to expand)
| Units | Beds | Baths | Est. rent |
|---|---|---|---|
| 2× units | 2 | 1 | $2,074 |
| #1 | 2 | 1 | $1,037 |
| #2 | 2 | 1 | $1,037 |
| Total (2 units) | $2,074 | ||
UW: 25.0% down · 7.5% · 30yr · 1.5% tax · 5.0% vac · 8.0% maint · 8.0% mgmt
Financing live
Cash to close
- Down payment
- $12,250
- Closing costs
- $1,470
- Reserves months
- —
- Total cash needed
- —
Loan-product check · same deal, 3 products live
Conventional
25% down · 7.5% · 30yr
- Down + closing
- —
- Monthly P&I
- —
- Monthly cashflow
- —
- DSCR
- —
- Eligible?
- —
Personal DTI + credit; lowest rate.
DSCR
20% down · 8.5% · 30yr
- Down + closing
- —
- Monthly P&I
- —
- Monthly cashflow
- —
- DSCR
- —
- Eligible?
- —
No personal income docs; deal must DSCR.
Hard money
10% down · 12.0% · 12mo
- Down + closing
- —
- Monthly P&I
- —
- Monthly cashflow
- —
- DSCR
- —
- Eligible?
- —
Short-term bridge; refi at stabilization.
Rent comps 5 comps
| Address | Beds | Baths | Sqft | Rent | $/sqft | DOM | Units | Dist |
|---|---|---|---|---|---|---|---|---|
| 910 Dresden Rd Cleveland, OH | 4.0 | 2.0 | 1839 | $1,800 | $0.98 | 16d | 1 | 0.66mi |
| 15801 Hazel Rd Cleveland, OH | 3.0 | 1.5 | 1908 | $1,550 | $0.81 | 16d | 1 | 0.69mi |
| 821 Nela View Rd Cleveland, OH | 4.0 | 2.5 | 2178 | $2,100 | $0.96 | 7d | 1 | 0.94mi |
| 1024 Greyton Rd Cleveland, OH | 5.0 | 2.5 | 1800 | $2,500 | $1.39 | 43d | 1 | 1.01mi |
| 3430 Winsford Rd Cleveland, OH | 4.0 | 1.5 | 1800 | $1,590 | $0.88 | 16d | 1 | 1.10mi |
Listing history 18 events
-
2026-06-18price $49,000 Active 83 DOM
-
2026-06-18days on market $59,500 Active 83 DOM
-
2026-06-17days on market $59,500 Active 82 DOM
-
2026-06-16days on market $59,500 Active 81 DOM
-
2026-06-15days on market $59,500 Active 80 DOM
-
2026-06-13days on market $59,500 Active 78 DOM
-
2026-06-13days on market $59,500 Active 77 DOM
-
2026-06-09days on market $59,500 Active 74 DOM
-
2026-06-08days on market $59,500 Active 73 DOM
-
2026-06-07days on market $59,500 Active 72 DOM
-
2026-06-05pricedays on market $59,500 Active 69 DOM
-
2026-06-03days on market $65,000 Active 68 DOM
-
2026-06-02days on market $65,000 Active 67 DOM
-
2026-06-01days on market $65,000 Active 66 DOM
-
2026-05-31days on market $65,000 Active 65 DOM
-
2026-05-15price $65,000 338-char remark
Show marketing remark (338 chars)
Investor special! Occupied duplex generating income from day one. Property needs some TLC but offers strong upside for those willing to make improvements. Increase rents, build equity, and enhance overall performance with strategic updates. Don’t miss this opportunity to secure a property with built-in income and future potential.
-
2026-04-12price $69,500 338-char remark
Show marketing remark (338 chars)
Investor special! Occupied duplex generating income from day one. Property needs some TLC but offers strong upside for those willing to make improvements. Increase rents, build equity, and enhance overall performance with strategic updates. Don’t miss this opportunity to secure a property with built-in income and future potential.
-
2026-03-27$79,500 Active 338-char remark
Show marketing remark (338 chars)
Investor special! Occupied duplex generating income from day one. Property needs some TLC but offers strong upside for those willing to make improvements. Increase rents, build equity, and enhance overall performance with strategic updates. Don’t miss this opportunity to secure a property with built-in income and future potential.
ⓘ Source: listings_history table (triggers on properties + properties_extension) + one-shot
backfill from property_details.listing_events for pre-trigger history.
Tax reassessment forecast OH · Partial reset (capped growth)
- Current annual tax
- $709 · $59/mo
- Projected year-2 tax
- $737 · $61/mo
- Expected delta
- +$28/yr (+$2/mo · 3.9%)
ⓘ Screening estimate from a state-policy table — verify with the county assessor before closing.
Climate risk First Street
- Flood 7/10 Severe FEMA zone X (unshaded) · 76% chance over 30 yrs
- Wildfire 1/10 Low
- Heat 3/10 Moderate 7 d/yr ≥95°F today · 17 d/yr by 30 yrs out
- Wind 1/10 Low
- Air quality 3/10 Moderate 3 unhealthy d/yr today · 5 by 30 yrs out
Nearby sold comps map
Loading sold comps map…
Walkable amenities ~0.75 mi
Loading nearby amenities…
Taxation est. · year 1
- Rental income
- $24,888
- − Mortgage interest
- −$2,745
- − Property taxes
- −$709
- − Insurance
- −$912
- − Repairs & maintenance
- −$1,991
- − Management
- −$1,991
- − Depreciation
- −$1,425
- Taxable income
- $15,115
- Est. tax owed @ 24.0%
- −$3,628
- After-tax cash flow
- $11,330/yr
For passive investors: Depreciation is non-cash, so a rental often shows a tax loss while cash-flowing — sheltering income. Rental losses are passive: they offset passive income freely, and up to $25,000/yr can offset ordinary (W-2) income if you actively participate and your MAGI is under $100k (phasing out to $0 by $150k); unused losses carry forward. On sale, claimed depreciation is recaptured at up to 25%, and gains may owe capital-gains tax (a 1031 exchange can defer both). Figures are a year-1 estimate at your 24.0% rate — not tax advice; consult a CPA.
Schools (NCES district)
- District
- East Cleveland City School District
- NCES district ID
- 3904390
- Math proficiency
- 4% ▼ -16.00%
- Reading proficiency
- 17% ▼ -13.00%
- Median HH income
- $22,726
- Composite
- 7.38/100
- National rank
- #9954
- State rank
- #652 of 656 in OH
Livability — East Cleveland
- Score
- 66/100
- State rank
- #650
- US rank
- #11510
Category grades
Schools grade is shown separately in the Schools card above.
Census & demographics
- Census place
- East Cleveland, OH
- County
- Cuyahoga County · 1,090,369 people
- City population
- 17,848
- Metro
- Cleveland-Elyria, OH
- Population (ZIP)
- 17,848
- Household income
- $28,799
- Rent vs Own
- Severe rent burden
- 1702.0
Population outlook (Cuyahoga County) Hauer SSP2
- Today (2025)
- 1,244,621 people
- By 2030
- 1,230,093 · -1.2%
- By 2040
- 1,189,108 · -4.5%
- By 2050
- 1,145,706 · -7.9%
- By 2075
- 1,076,557 · -13.5%
- By 2100
- 978,987 · -21.3%
Race, ethnicity, and origin ACS 2023
- Neighborhood character
- Predominantly Black (89%)
- Race & ethnicity
- Black 89% White 7% Two or more races 2% Hispanic / Latino 1%
- Common ancestry
- Lithuanian 1%
- Foreign-born
- 4% · Canada
- Languages at home
- 93% English-only · French/Haitian/Cajun 3% Spanish 2% Russian/Polish/Slavic 1%
Political lean MEDSL · Cuyahoga
- 2024 margin
- Solid D (+31.5) · D 65.4% · R 33.9%
- 2008→2024 swing
- -7.4pp toward R · 2008: 38.9pp · 2024: 31.5pp
- All cycles
- 2024: D+31.5 2020: D+34.1 2016: D+35.0 2012: D+38.7 2008: D+38.9
Not yet ingested
- Civics
- —
Market trends
- HPI YoY
- ▼ -115.61%
- Current HPI
- 67.2162
- Rent YoY
- ▲ 5.16%
- Metro
- Cleveland-Elyria, OH
- State GDP YoY
- ▲ 1.98%
- F500 in state
- 48
Industry mix (Fortune 500 HQ in OH)
| Industry | F500 HQs | Revenue |
|---|---|---|
| Insurance | 3 | $145B |
|
||
| Industrial Machinery | 3 | $49B |
|
||
| Financial Services | 3 | $24B |
|
||
| Consumer Goods | 2 | $93B |
|
||
| Aerospace / Defense | 2 | $47B |
|
||
| Utilities | 2 | $33B |
|
||
Price history
-18.2% since first listed3 events — show timeline
- 2026-05-15 Price Changed $65,000 MLSNOW
- 2026-04-12 Price Changed $69,500 MLSNOW
- 2026-03-27 Listed $79,500 MLSNOW
Property tax history
-4.2%/yrLatest (2025): $709 · +0.0% YoY. Source: county tax records.
Cash-flow waterfall
monthlySold comps — $/sqft
last 12 mo · ≤1 miLoading sold comps…