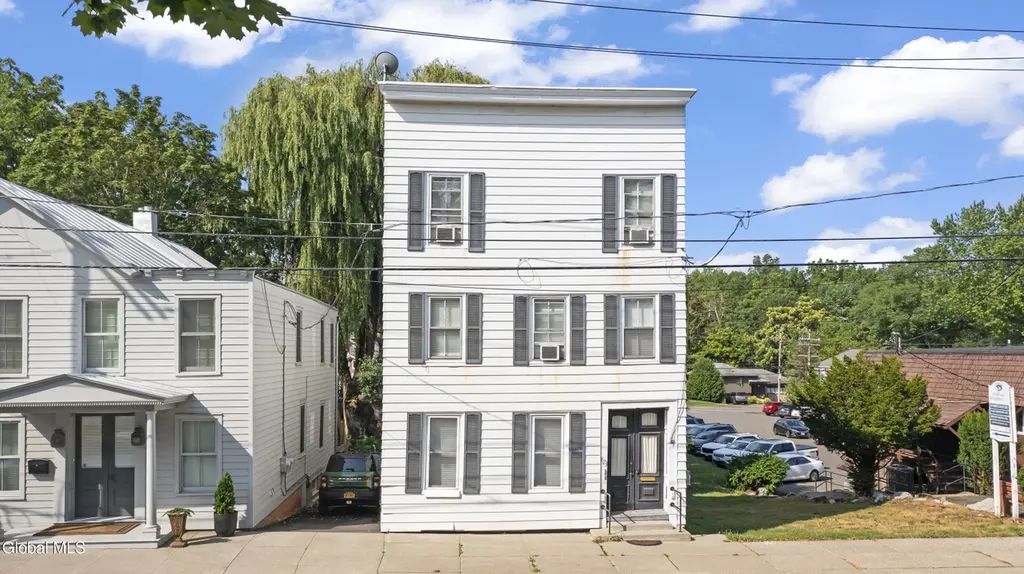
823 Warren St · Hudson, NY
Flood risk No data
- FEMA flood zone
- —
- Chance of flooding over 30 yrs
- —
- Est. flood insurance / yr
- —
Fire risk No data
- Est. fire insurance / yr
- —
Heat risk No data
- Hot days now (above threshold)
- —
- Hot days in 30 yrs
- —
Wind risk No data
- Chance of severe wind over 30 yrs
- —
Air-quality risk No data
- Unhealthy air days now
- —
- Unhealthy air days in 30 yrs
- —
Risk factors via First Street. Map © Google.
Why this score? — see what drove the D grade
The composite is a weighted blend of 9 inputs, each scored 0–100. Each bar is that input's sub-score; the figure is the points it added to the 100-point composite (weight × sub-score).
- ARV discount +14.5/15.0
- Appreciation +10.0/10.0
- Rent growth +5.0/5.0
- Schools +3.6/10.0
- Livability +3.5/5.0
- Condition / age +2.5/5.0
- Cash flow +1.7/30.0
- 1% rule +0.0/10.0
- DSCR +0.0/10.0
$799,000
🖨 Deal sheet (PDF) 📄 Offer letter ✓ Due diligence
Listing remarks MLS
Exceptional opportunity to own a fully vacant, three-unit multi-family property in the heart of Hudson's vibrant Warren Street. This charming building offers a unique blend of investment potential and personal use, with a proven track record as a successful short-term rental and owner use property. Featuring three distinct units, this property is ideal for investors, or live in owners. Prime location just steps from top restaurants, galleries, and shops. Don't miss this rare chance to own a turnkey asset in one of the Hudson Valley's most sought-after destinations.
Key facts
- Short term rental
- Turnkey asset
- Investment potential
Tags
Neighborhood map
What this means for you Summary
Snapshot
- This is a 5-bed/3.5-bath single-family listed at $799k.
Deal economics
- At list price, monthly cash flow is $-3k ($-36k/yr) — negative.
- To cash-flow at today's rent, offer at most $359k (55.1% below list).
- To meet the 1% rule (rent ≥ 1% of price), the offer needs to be $314k (60.7% below list).
- Recommended offer: $314k (60.7% below list) — sets the bar for 1% rule.
- Cap rate 1.7% vs local median 3.3% in Hudson — below-typical yield; the buyer is paying a premium for something (appreciation thesis, condition, location) that the cap rate doesn't capture.
Location & tenants
- Location reads 70/100 on livability (#430 in NY) — a middle-class / working-renter tenant base. Strengths: amenities A+, health & safety A+; Watch: commute F, employment F.
- Hudson City School District (town): math 38% / reading 47% proficiency, ranked #494 of 590 in NY (top 84%) — families likely to look elsewhere, expect single-tenant / working-renter base with shorter leases.
- Zoned schools: Montgomery C Smith Elementary School (math 36% / reading 47%, grade F, #1,409 of 2,108 statewide, top 67%, 723 students, 65% FRL); Hudson Junior High School (math 20% / reading 36%, grade F, #573 of 729 statewide, top 79%, 384 students, 63% FRL); Hudson High School (math 82% / reading 84%, grade A, #435 of 1,100 statewide, top 40%, 454 students, 57% FRL).
- Market conditions: Rents rising fast (+10.9%/yr); 162 active listings in the ZIP; 136 units permitted in Columbia County in 2024 (0 in 5+ unit buildings).
- At $3,141/mo this rent would consume 52% of the median local household income ($73k/yr) (locally 1083% of renters already pay >50% of income on rent) — very limited rent-growth headroom before tenants either downsize or default.
Forward outlook
- In year one you build about $85k of equity ($6k loan paydown + $80k appreciation (10.0% local appreciation)).
- Columbia County population projected at -22% by 2050 — secular population decline; favor cash flow + early exit over multi-decade hold.
- By year 2, paydown + projected appreciation supports a ~$137k cash-out refi (75% LTV) — recoverable capital for the next deal without selling this one.
Negotiation context
- It's been on market 89 days — a 6% lower offer ($751k) is reasonable based on typical stale-listing flexibility.
- 3 sale attempts with the ask held roughly flat each time — persistent listings suggest the price (not the market) is what's stuck; bring a comps-based counter.
Questions for the listing agent
- What do current leases actually rent for vs. the listed asking? Can we see a recent rent roll and the last 12 months of T-12 income?
- It's been on market 89 days. Have you received any prior offers? Is the seller open to a 61% concession, seller financing, or rate buy-down credit?
- Why hasn't it sold? Are there any deal-killer items the seller is aware of (foundation, flood, title, zoning, code violations)?
- Is there a deadline driving the sale (1031 exchange, divorce, estate, relocation)? That informs how much negotiation room exists.
- The area grade is low — what's the realistic commute time and amenity access for the typical tenant pool here? Any planned neighborhood developments (good or bad) we should know about?
- What's the average days-on-market for RENTAL listings here right now (not sales)? A rising rental-DOM trend means longer vacancies and softer asking-rent achievability than the comps imply.
- What's the recent tenant-quality profile in this submarket — average credit score on applications, eviction rate, late-payment / NSF rate, and stable-employment percentage? A property-management company in the area should have these aggregated.
- How much new for-sale + rental construction is in the pipeline within 1–3 miles? Heavy new supply typically softens prices + rents 12–24 months out; constrained supply supports both.
Investment metrics
- 1% rule
- 0.39% ✗
- Cap rate
- 1.73%
- Cash-on-cash
- -16.31%
- DSCR
- 0.27
- GRM
- 21.2
CMA / ARV
- ARV (median comp)
- $946,217
- List price
- $799,000
- Delta
- -15.56%
- Verdict
- UNDERPRICED
- Comps
- 20 within 1.0 mi
Show comp detail 6 sales within ~0.75 mi
| Address | Dist | Beds/Ba | Sqft | Sold | Price | $/sf | Match |
|---|---|---|---|---|---|---|---|
| 550 - 552 Columbia St | 0.30mi | 5/— | 2,906 (+11%) | 9mo | $885,000 | $305 | 60 |
| 44 Worth Ave | 0.14mi | 4/2.0 (-1) | 2,351 (-10%) | 10mo | $815,000 | $347 | 57 |
| 496 Clinton St St | 0.53mi | 4/2.0 (-1) | 2,506 (-4%) | 11mo | $977,750 | $390 | 48 |
| 1 E Court St | 0.54mi | 4/4.0 (-1) | 2,904 (+11%) | 6mo | $1,250,000 | $430 | 45 |
| 2 E Marie St | 0.71mi | 6/2.0 (+1) | 2,496 (-5%) | 23mo | $360,000 | $144 | 29 |
| 25 Keil Ct | 0.73mi | 4/2.5 (-1) | 2,784 (+6%) | 22mo | $649,500 | $233 | 28 |
Match score weights: distance 35% · size 25% · config 20% · recency 20%. Top-matched comps best support the ARV.
Projected returns pro-forma
10.0% appreciation · 8.0% rent growth · sell at horizon
- IRR
- 13.8%
- Equity multiple
- 2.15×
- Total profit
- $258,161
- Equity at exit
- $719,803
- IRR
- 14.5%
- Equity multiple
- 5.26×
- Total profit
- $953,737
- Equity at exit
- $1,552,281
Cash invested: $223,720 (down + closing). Projections, not guarantees.
Landlord ↔ Tenant lean methodology
- Overall (STATE)
- 15 Strongly Tenant-Friendly
- State New York
- 15 Strongly Tenant-Friendly · D+10
- County
- — inherits STATE
- City
- — inherits STATE
ZIP-level market 12534
- Home prices YoY
- 5.6%
- Rents YoY
- 10.9%
- Active inventory
- 162
- Price-to-rent
- 21.2×
Monthly cashflow live
- Estimated rent
- $3,141 medium interval (Pro) →
- Mortgage (P&I)
- −$4,190
- Tax est. 1.5%
- −$999 /mo · $11,985/yr
- Insurance
- −$333
- HOA
- −$0
- Vacancy / Maint / Mgmt
- −$660
- Net cashflow
- $-3,040
Break-even live
Sensitivity live
| Price | -10% $-2,488 | -5% $-2,764 | +0% $-3,040 | +5% $-3,316 | +10% $-3,593 |
|---|---|---|---|---|---|
| Rent | -10% $-3,288 | -5% $-3,164 | +0% $-3,040 | +5% $-2,916 | +10% $-2,792 |
| Rate | -1.0pp $-2,638 | -0.5pp $-2,837 | base $-3,040 | +0.5pp $-3,247 | +1.0pp $-3,458 |
UW: 25.0% down · 7.5% · 30yr · 1.5% tax · 5.0% vac · 8.0% maint · 8.0% mgmt
Financing live
Cash to close
- Down payment
- $199,750
- Closing costs
- $23,970
- Reserves months
- —
- Total cash needed
- —
Loan-product check · same deal, 3 products live
Conventional
25% down · 7.5% · 30yr
- Down + closing
- —
- Monthly P&I
- —
- Monthly cashflow
- —
- DSCR
- —
- Eligible?
- —
Personal DTI + credit; lowest rate.
DSCR
20% down · 8.5% · 30yr
- Down + closing
- —
- Monthly P&I
- —
- Monthly cashflow
- —
- DSCR
- —
- Eligible?
- —
No personal income docs; deal must DSCR.
Hard money
10% down · 12.0% · 12mo
- Down + closing
- —
- Monthly P&I
- —
- Monthly cashflow
- —
- DSCR
- —
- Eligible?
- —
Short-term bridge; refi at stabilization.
Listing history 25 events
-
2026-06-22days on market $799,000 Active 89 DOM
-
2026-06-21days on market $799,000 Active 88 DOM
-
2026-06-19days on market $799,000 Active 86 DOM
-
2026-06-18days on market $799,000 Active 85 DOM
-
2026-06-17days on market $799,000 Active 84 DOM
-
2026-06-16days on market $799,000 Active 83 DOM
-
2026-06-15days on market $799,000 Active 82 DOM
-
2026-06-14days on market $799,000 Active 80 DOM
-
2026-06-12days on market $799,000 Active 79 DOM
-
2026-06-09days on market $799,000 Active 76 DOM
-
2026-06-08days on market $799,000 Active 75 DOM
-
2026-06-07days on market $799,000 Active 74 DOM
-
2026-06-04days on market $799,000 Active 70 DOM
-
2026-06-02days on market $799,000 Active 69 DOM
-
2026-06-01days on market $799,000 Active 68 DOM
-
2026-05-31days on market $799,000 Active 67 DOM
-
2026-05-31days on market $799,000 Active 66 DOM
-
2026-04-30price $799,000 571-char remark
Show marketing remark (571 chars)
Exceptional opportunity to own a fully vacant, three-unit multi-family property in the heart of Hudson's vibrant Warren Street. This charming building offers a unique blend of investment potential and personal use, with a proven track record as a successful short-term rental and owner use property. Featuring three distinct units, this property is ideal for investors, or live in owners. Prime location just steps from top restaurants, galleries, and shops. Don't miss this rare chance to own a turnkey asset in one of the Hudson Valley's most sought-after destinations.
-
2026-03-25$819,000 Active 571-char remark
Show marketing remark (571 chars)
Exceptional opportunity to own a fully vacant, three-unit multi-family property in the heart of Hudson's vibrant Warren Street. This charming building offers a unique blend of investment potential and personal use, with a proven track record as a successful short-term rental and owner use property. Featuring three distinct units, this property is ideal for investors, or live in owners. Prime location just steps from top restaurants, galleries, and shops. Don't miss this rare chance to own a turnkey asset in one of the Hudson Valley's most sought-after destinations.
-
2025-10-01price $915,000
-
2025-10-01price $915,000
-
2025-10-01price $919,000
-
2025-10-01price $919,000
-
2025-07-28$975,000 Active
-
2025-07-28$975,000 Active
ⓘ Source: listings_history table (triggers on properties + properties_extension) + one-shot
backfill from property_details.listing_events for pre-trigger history.
Nearby sold comps map
Loading sold comps map…
Walkable amenities ~0.75 mi
Loading nearby amenities…
Taxation est. · year 1
- Rental income
- $37,691
- − Mortgage interest
- −$44,756
- − Property taxes
- −$11,985
- − Insurance
- −$3,995
- − Repairs & maintenance
- −$3,015
- − Management
- −$3,015
- − Depreciation
- −$23,244
- Taxable loss
- −$52,319
- Est. tax savings @ 24.0%
- +$12,557
- After-tax cash flow
- $-23,928/yr
For passive investors: Depreciation is non-cash, so a rental often shows a tax loss while cash-flowing — sheltering income. Rental losses are passive: they offset passive income freely, and up to $25,000/yr can offset ordinary (W-2) income if you actively participate and your MAGI is under $100k (phasing out to $0 by $150k); unused losses carry forward. On sale, claimed depreciation is recaptured at up to 25%, and gains may owe capital-gains tax (a 1031 exchange can defer both). Figures are a year-1 estimate at your 24.0% rate — not tax advice; consult a CPA.
Schools (NCES district)
- District
- Hudson City School District
- NCES district ID
- 3614940
- Math proficiency
- 38% ▲ 4.00%
- Reading proficiency
- 47% ▲ 7.00%
- Median HH income
- $44,663
- Composite
- 36.03/100
- National rank
- #4779
- State rank
- #494 of 590 in NY
Livability — Hudson
- Score
- 70/100
- State rank
- #430
- US rank
- #7443
Category grades
Schools grade is shown separately in the Schools card above.
Census & demographics
- Census place
- Hudson, NY
- County
- Columbia County · 17,176 people
- City population
- 17,176
- Metro
- Hudson, NY
- Population (ZIP)
- 17,176
- Household income
- $72,741
- Rent vs Own
- Severe rent burden
- 1083.0
Population outlook (Columbia County) Hauer SSP2
- Today (2025)
- 58,662 people
- By 2030
- 56,557 · -3.6%
- By 2040
- 51,324 · -12.5%
- By 2050
- 45,790 · -21.9%
- By 2075
- 35,232 · -39.9%
- By 2100
- 25,846 · -55.9%
Race, ethnicity, and origin ACS 2023
- Neighborhood character
- Predominantly White (74%)
- Race & ethnicity
- White 74% Two or more races 7% Black 7% Hispanic / Latino 7% Asian 6%
- Hispanic origin (detail)
- Mexican 2% Puerto Rican 1%
- Common ancestry
- Lithuanian 4% Romanian 4% Iranian 3%
- Foreign-born
- 10% · Canada, China
- Languages at home
- 88% English-only · Spanish 5% Other Indo-European 3% Chinese 1%
Political lean MEDSL · Columbia
- 2024 margin
- D (+14.7) · D 57.4% · R 42.6%
- 2008→2024 swing
- +1.3pp toward D · 2008: 13.4pp · 2024: 14.7pp
- All cycles
- 2024: D+14.7 2020: D+16.7 2016: D+1.4 2012: D+11.7 2008: D+13.4
Not yet ingested
- Civics
- —
Market trends
- HPI YoY
- ▲ 25.98%
- Current HPI
- 490.0412
- Rent YoY
- ▲ 10.88%
- Metro
- Hudson, NY
- State GDP YoY
- ▲ 2.60%
- F500 in state
- 92
Industry mix (Fortune 500 HQ in NY)
| Industry | F500 HQs | Revenue |
|---|---|---|
| Financial Services | 10 | $950B |
|
||
| Consumer Goods | 9 | $162B |
|
||
| Insurance | 4 | $225B |
|
||
| Telecommunications | 2 | $144B |
|
||
| Pharmaceuticals | 2 | $112B |
|
||
| Media / Entertainment | 2 | $69B |
|
||
Price history
-18.1% since first listed8 events — show timeline
- 2026-04-30 Price Changed $799,000 Global MLS
- 2026-03-25 Listed $819,000 Global MLS
- 2025-10-01 Price Changed $915,000 HVCRMLS
- 2025-10-01 Price Changed $915,000 HVCRMLS
- 2025-10-01 Price Changed $919,000 HVCRMLS
- 2025-10-01 Price Changed $919,000 HVCRMLS
- 2025-07-28 Listed $975,000 HVCRMLS
- 2025-07-28 Listed $975,000 HVCRMLS
Cash-flow waterfall
monthlySold comps — $/sqft
last 12 mo · ≤1 miLoading sold comps…