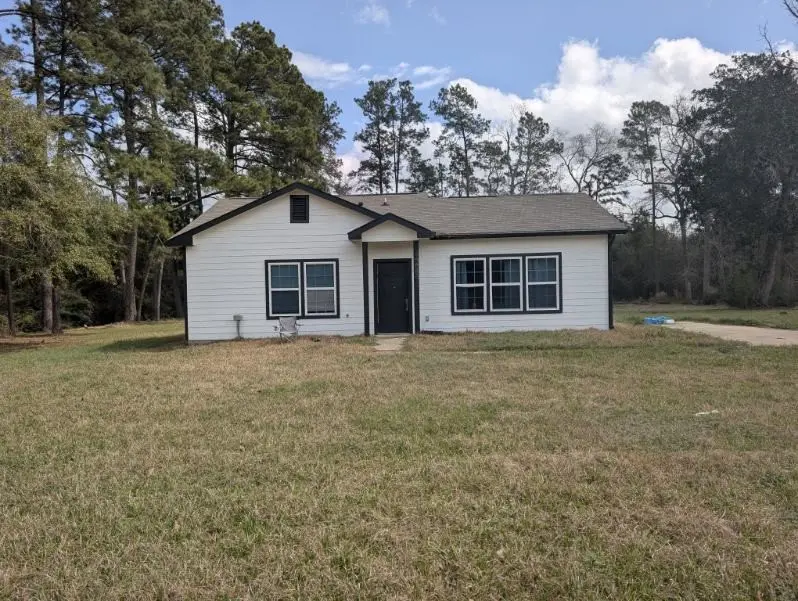
24888 Fm-787 · Saratoga, TX
Flood risk 1/10 · Minimal
- FEMA flood zone
- X (unshaded)
- Chance of flooding over 30 yrs
- 0.0%
- Est. flood insurance / yr
- $507 – $1,088
Fire risk 5/10 · Moderate
- Est. fire insurance / yr
- $1,222 – $2,270
Heat risk 9/10 · Severe
- Hot days now (above 112°F)
- 7 days/yr
- Hot days in 30 yrs
- 24 days/yr
Wind risk 8/10 · Major
- Chance of severe wind over 30 yrs
- 99.0%
Air-quality risk 1/10 · Minimal
- Unhealthy air days now
- 0 days/yr
- Unhealthy air days in 30 yrs
- 0 days/yr
Risk factors via First Street. Map © Google.
Why this score? — see what drove the D grade
The composite is a weighted blend of 9 inputs, each scored 0–100. Each bar is that input's sub-score; the figure is the points it added to the 100-point composite (weight × sub-score).
- Cash flow +10.7/30.0
- ARV discount +7.5/15.0
- Appreciation +6.9/10.0
- 1% rule +3.3/10.0
- DSCR +3.1/10.0
- Rent growth +2.5/5.0
- Livability +2.5/5.0
- Condition / age +2.5/5.0
- Schools +2.4/10.0
$115,000
🖨 Deal sheet (PDF) 📄 Offer letter ✓ Due diligence
Listing remarks
This 2-bedroom, 1-bathroom single-family home in Thicket, TX, features approximately 1,046 square feet of living space situated on +/- 1.04-acre lot. The interior includes modern updates such as vinyl plank flooring in the common areas and granite countertops with a mosaic tile backsplash in the kitchen. The exterior is finished with durable Hardi Board siding on a slab foundation. The property is being sold AS-IS.
Key facts
- 1.04 acre lot
- Built 2009
- Listed 90 days
Property features AI
Exterior
- Utilities: Aerobic septic
- Home design: Residential property; One-story entry (single level)
- Construction: Cement siding; Built in 2009; Composition roof; Slab foundation
- Exterior features: Lot includes other features
Interior
- Bedrooms: Bedroom (first level) — 10 x 12; Primary bedroom (first level) — 10 x 14; Total of 2 rooms
- Flooring: Carpet; Vinyl
- Bathrooms: 1 full bathroom
- Heating & cooling: Central heating (electric); Central air (electric)
- Interior features: Tub/shower; Ceiling fan(s)
Neighborhood map
What this means for you Summary
Snapshot
- This is a 2-bed/1.0-bath single-family listed at $115k.
Deal economics
- At list price, monthly cash flow is $-54 ($-651/yr) — negative.
- To cash-flow at today's rent, offer at most $105k (8.3% below list).
- To meet the 1% rule (rent ≥ 1% of price), the offer needs to be $95k (17.4% below list).
- Recommended offer: $95k (17.4% below list) — sets the bar for 1% rule.
Location & tenants
- Location reads: area grade D — affects rentability + tenant quality, not the cash-flow math above.
- West Hardin County CISD (rural): math 22% / reading 35% proficiency, ranked #664 of 826 in TX (top 80%) — low school quality limits family demand, transient renter base, plan for 1-2y turnover.
- Zoned schools: West Hardin El (math 27% / reading 32%, grade F, #2,525 of 4,322 statewide, top 62%, 281 students, 77% FRL); West Hardin H S (math 17% / reading 37%, grade F, #1,204 of 1,632 statewide, top 75%, 270 students, 62% FRL) — zoned schools average 70% FRL vs 41% district-wide (29 pts higher); higher-poverty schools than district average — tighter screening recommended.
- Market conditions: 21 active listings in the ZIP; 358 units permitted in Hardin County in 2024 (0 in 5+ unit buildings).
Forward outlook
- In year one you build about $5k of equity ($795 loan paydown + $4k appreciation (3.9% local appreciation)).
- At projected returns (3.9% appreciation + 3.0% rent growth), your $32k cash investment doubles in ~6 years — after that, you're playing with house money.
- By year 7, paydown + projected appreciation supports a ~$33k cash-out refi (75% LTV) — recoverable capital for the next deal without selling this one.
Negotiation context
- It's been on market 90 days — a 6% lower offer ($108k) is reasonable based on typical stale-listing flexibility.
- Current owner paid $55k; list at $115k implies a 109% gain — meaningful room to come down on a strong offer.
Risks & watch-outs
- Climate carrying-cost: severe wind risk, 99% chance of damaging wind over 30y; moderate wildfire risk; extreme-heat days projected 7→24/yr by 2055 (HVAC capex compounding) — expect insurance premiums to compound above CPI over the hold.
Questions for the listing agent
- What do current leases actually rent for vs. the listed asking? Can we see a recent rent roll and the last 12 months of T-12 income?
- It's been on market 90 days. Have you received any prior offers? Is the seller open to a 17% concession, seller financing, or rate buy-down credit?
- Why hasn't it sold? Are there any deal-killer items the seller is aware of (foundation, flood, title, zoning, code violations)?
- Is there a deadline driving the sale (1031 exchange, divorce, estate, relocation)? That informs how much negotiation room exists.
- The area grade is low — what's the realistic commute time and amenity access for the typical tenant pool here? Any planned neighborhood developments (good or bad) we should know about?
- What's the average days-on-market for RENTAL listings here right now (not sales)? A rising rental-DOM trend means longer vacancies and softer asking-rent achievability than the comps imply.
- What's the recent tenant-quality profile in this submarket — average credit score on applications, eviction rate, late-payment / NSF rate, and stable-employment percentage? A property-management company in the area should have these aggregated.
- How much new for-sale + rental construction is in the pipeline within 1–3 miles? Heavy new supply typically softens prices + rents 12–24 months out; constrained supply supports both.
Investment metrics
- 1% rule
- 0.83% ✗
- Cap rate
- 5.73%
- Cash-on-cash
- -2.02%
- DSCR
- 0.91
- GRM
- 10.1
CMA / ARV
No comps found within radius.
Projected returns pro-forma
3.89% appreciation · 3.0% rent growth · sell at horizon
- IRR
- 8.2%
- Equity multiple
- 1.49×
- Total profit
- $15,905
- Equity at exit
- $57,548
- IRR
- 10.4%
- Equity multiple
- 2.71×
- Total profit
- $54,976
- Equity at exit
- $93,524
Cash invested: $32,200 (down + closing). Projections, not guarantees.
Landlord ↔ Tenant lean methodology
- Overall (STATE)
- 87 Strongly Landlord-Friendly
- State Texas
- 87 Strongly Landlord-Friendly · R+5
- County
- — inherits STATE
- City
- — inherits STATE
ZIP-level market 77585
- Home prices YoY
- 4.0%
- Active inventory
- 21
- Price-to-rent
- 10.1×
Monthly cashflow live
- Estimated rent
- $950 medium interval (Pro) →
- Mortgage (P&I)
- −$603
- Tax from tax record
- −$154 /mo · $1,843/yr
- Insurance
- −$48
- HOA
- −$0
- Vacancy / Maint / Mgmt
- −$199
- Net cashflow
- $-54
Break-even live
Sensitivity live
| Price | -10% $11 | -5% $-22 | +0% $-54 | +5% $-87 | +10% $-119 |
|---|---|---|---|---|---|
| Rent | -10% $-129 | -5% $-92 | +0% $-54 | +5% $-17 | +10% $21 |
| Rate | -1.0pp $4 | -0.5pp $-25 | base $-54 | +0.5pp $-84 | +1.0pp $-114 |
UW: 25.0% down · 7.5% · 30yr · 1.5% tax · 5.0% vac · 8.0% maint · 8.0% mgmt
Financing live
Cash to close
- Down payment
- $28,750
- Closing costs
- $3,450
- Reserves months
- —
- Total cash needed
- —
Loan-product check · same deal, 3 products live
Conventional
25% down · 7.5% · 30yr
- Down + closing
- —
- Monthly P&I
- —
- Monthly cashflow
- —
- DSCR
- —
- Eligible?
- —
Personal DTI + credit; lowest rate.
DSCR
20% down · 8.5% · 30yr
- Down + closing
- —
- Monthly P&I
- —
- Monthly cashflow
- —
- DSCR
- —
- Eligible?
- —
No personal income docs; deal must DSCR.
Hard money
10% down · 12.0% · 12mo
- Down + closing
- —
- Monthly P&I
- —
- Monthly cashflow
- —
- DSCR
- —
- Eligible?
- —
Short-term bridge; refi at stabilization.
Listing history 20 events
-
2026-06-21days on market $115,000 Active 90 DOM
-
2026-06-18days on market $115,000 Active 87 DOM
-
2026-06-17days on market $115,000 Active 86 DOM
-
2026-06-16days on market $115,000 Active 85 DOM
-
2026-06-15days on market $115,000 Active 84 DOM
-
2026-06-13days on market $115,000 Active 82 DOM
-
2026-06-13pricestatusdays on market $115,000 Active 81 DOM
-
2026-06-09days on market $95,000 Active Under Contract 78 DOM
-
2026-06-08days on market $95,000 Active Under Contract 77 DOM
-
2026-06-07days on market $95,000 Active Under Contract 76 DOM
-
2026-06-04days on market $95,000 Active Under Contract 73 DOM
-
2026-06-03days on market $95,000 Active Under Contract 72 DOM
-
2026-06-02days on market $95,000 Active Under Contract 71 DOM
-
2026-06-01days on market $95,000 Active Under Contract 70 DOM
-
2026-05-31days on market $95,000 Active Under Contract 69 DOM
-
2026-03-23historical Active Under Contract
-
2026-03-23$95,000 Active
-
2023-07-11soldstatus
-
2023-01-18soldstatus $55,002
-
2007-10-23soldstatus
ⓘ Source: listings_history table (triggers on properties + properties_extension) + one-shot
backfill from property_details.listing_events for pre-trigger history.
Tax reassessment forecast TX · Resets to sale price
- Current annual tax
- $1,843 · $154/mo
- Projected year-2 tax
- $2,104 · $175/mo
- Expected delta
- +$262/yr (+$22/mo · 14.2%)
ⓘ Screening estimate from a state-policy table — verify with the county assessor before closing.
Climate risk First Street
- Flood 1/10 Low FEMA zone X (unshaded) · 0% chance over 30 yrs
- Wildfire 5/10 Major
- Heat 9/10 Extreme 7 d/yr ≥112°F today · 24 d/yr by 30 yrs out
- Wind 8/10 Severe 99% chance of damaging wind over 30 yrs
- Air quality 1/10 Low 0 unhealthy d/yr today · 0 by 30 yrs out
Nearby sold comps map
Loading sold comps map…
Walkable amenities ~0.75 mi
Loading nearby amenities…
Taxation est. · year 1
- Rental income
- $11,397
- − Mortgage interest
- −$6,442
- − Property taxes
- −$1,843
- − Insurance
- −$575
- − Repairs & maintenance
- −$912
- − Management
- −$912
- − Depreciation
- −$3,345
- Taxable loss
- −$2,632
- Est. tax savings @ 24.0%
- +$632
- After-tax cash flow
- $-20/yr
For passive investors: Depreciation is non-cash, so a rental often shows a tax loss while cash-flowing — sheltering income. Rental losses are passive: they offset passive income freely, and up to $25,000/yr can offset ordinary (W-2) income if you actively participate and your MAGI is under $100k (phasing out to $0 by $150k); unused losses carry forward. On sale, claimed depreciation is recaptured at up to 25%, and gains may owe capital-gains tax (a 1031 exchange can defer both). Figures are a year-1 estimate at your 24.0% rate — not tax advice; consult a CPA.
Schools (NCES district)
- District
- West Hardin County CISD
- NCES district ID
- 4845000
- Math proficiency
- 22% ▼ -8.00%
- Reading proficiency
- 35% ▼ -5.00%
- Median HH income
- $42,126
- Composite
- 24.16/100
- National rank
- #7740
- State rank
- #664 of 826 in TX
Livability — Saratoga
No livability data for this city. (Only ~50 U.S. cities are tracked.)
Census & demographics
- Population (ZIP)
- 1,123
Population outlook (Hardin County) Hauer SSP2
- Today (2025)
- 57,780 people
- By 2030
- 58,296 · +0.9%
- By 2040
- 58,421 · +1.1%
- By 2050
- 57,391 · -0.7%
- By 2075
- 53,132 · -8.0%
- By 2100
- 44,905 · -22.3%
Race, ethnicity, and origin ACS 2023
- Neighborhood character
- Predominantly White (99%)
- Race & ethnicity
- White 99% Two or more races 1%
- Common ancestry
- Iranian 4% Slovak 3% Serbian 3%
Political lean MEDSL · Hardin
- 2024 margin
- Solid R (+75.8) · D 11.9% · R 87.7%
- 2008→2024 swing
- -14.6pp toward R · 2008: -61.2pp · 2024: -75.8pp
- All cycles
- 2024: R+75.8 2020: R+73.8 2016: R+73.9 2012: R+67.6 2008: R+61.2
Not yet ingested
- Civics
- —
Market trends
- HPI YoY
- ▲ 3.89%
- Current HPI
- 100.1062
- Rent YoY
- —
- Metro
- —
- State GDP YoY
- ▲ 3.95%
- F500 in state
- 110
Industry mix (Fortune 500 HQ in TX)
| Industry | F500 HQs | Revenue |
|---|---|---|
| Energy | 16 | $1,198B |
|
||
| Technology | 5 | $198B |
|
||
| Engineering / Construction | 4 | $72B |
|
||
| Energy Services | 3 | $60B |
|
||
| Utilities | 3 | $41B |
|
||
| Healthcare | 2 | $330B |
|
||
Price history
+72.7% since first listed5 events — show timeline
- 2026-03-23 Contingent — HARMLS
- 2026-03-23 Listed $95,000 HARMLS
- 2023-07-11 Sold (Public Records) — Public Records
- 2023-01-18 Sold (Public Records) $55,002 Public Records
- 2007-10-23 Sold (Public Records) — Public Records
Property tax history
+5.7%/yrLatest (2025): $1,843 · +1.7% YoY. Source: county tax records.
Cash-flow waterfall
monthlySold comps — $/sqft
last 12 mo · ≤1 miLoading sold comps…