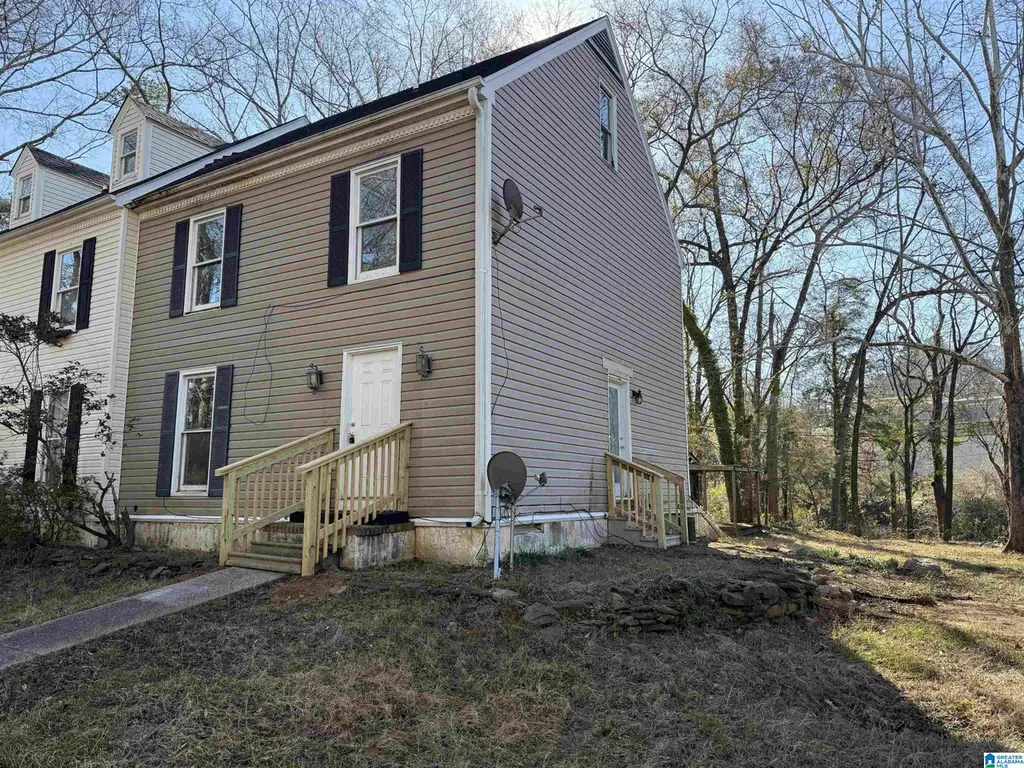
245 Walden Ct · Montevallo, AL
Flood risk 8/10 · Major
- FEMA flood zone
- X (unshaded)
- Chance of flooding over 30 yrs
- 0.99%
- Est. flood insurance / yr
- $507 – $1,088
Fire risk 4/10 · Minor
- Est. fire insurance / yr
- $916 – $1,700
Heat risk 7/10 · Major
- Hot days now (above 107°F)
- 7 days/yr
- Hot days in 30 yrs
- 21 days/yr
Wind risk 6/10 · Moderate
- Chance of severe wind over 30 yrs
- 58.0%
Air-quality risk 2/10 · Minimal
- Unhealthy air days now
- 2 days/yr
- Unhealthy air days in 30 yrs
- 2 days/yr
Risk factors via First Street. Map © Google.
Why this score? — see what drove the F grade
The composite is a weighted blend of 9 inputs, each scored 0–100. Each bar is that input's sub-score; the figure is the points it added to the 100-point composite (weight × sub-score).
- ARV discount +11.0/15.0
- Cash flow +7.0/30.0
- Schools +3.9/10.0
- Livability +3.1/5.0
- Rent growth +2.5/5.0
- Condition / age +2.5/5.0
- DSCR +1.2/10.0
- 1% rule +0.8/10.0
- Appreciation +0.0/10.0
$185,000
🖨 Deal sheet (PDF) 📄 Offer letter ✓ Due diligence
Listing remarks MLS
Conveniently located close to the University of Montevallo, this 3 bedroom 2 bath backs up to the beautiful spring creek. Featuring laminate flooring throughout, and all new appliances
Key facts
- Laminate flooring
- New appliances
- Built 1983
Tags
Neighborhood map
What this means for you Summary
Snapshot
- This is a 3-bed/2.0-bath single-family listed at $185k.
Deal economics
- At list price, monthly cash flow is $-340 ($-4k/yr) — negative.
- To cash-flow at today's rent, offer at most $125k (32.5% below list).
- To meet the 1% rule (rent ≥ 1% of price), the offer needs to be $107k (42.3% below list).
- Recommended offer: $107k (42.3% below list) — sets the bar for 1% rule.
- Cap rate 4.5% vs local median 3.7% in Montevallo — meaningfully above typical; check what's discounted (condition, days-on-market, listing class) to confirm the premium yield is real.
Location & tenants
- Location reads 62/100 on livability (#217 in AL) — a middle-class / working-renter tenant base. Strengths: cost of living A+, crime A, housing B+; Watch: amenities F, commute F, employment F.
- Shelby County (suburban): math 30% / reading 58% proficiency, ranked #16 of 129 in AL (top 12%) — families likely to look elsewhere, expect single-tenant / working-renter base with shorter leases.
- Zoned schools: Montevallo Elementary School (math 29% / reading 49%, grade F, #257 of 627 statewide, top 41%, 749 students, 77% FRL); Montevallo Middle School (math 5% / reading 43%, grade F, #168 of 257 statewide, top 66%, 369 students, 78% FRL); Montevallo High School (math 17% / reading 27%, grade F, #142 of 305 statewide, top 51%, 506 students, 76% FRL) — zoned schools average 77% FRL vs 26% district-wide (51 pts higher); higher-poverty schools than district average — tighter screening recommended.
- Zoned-school proficiency averages 28% at this address vs 44% district-wide (-16 pts) — the specific schools serving this property underperform the Shelby County average; the district grade overstates school quality for this exact location.
- Market conditions: 115 active listings in the ZIP; 5 comparable units currently listed for rent nearby; rentals leasing fast (median 4d on market — plan ~1-2 weeks tenant-placement turnaround); 987 units permitted in Shelby County in 2024 (0 in 5+ unit buildings).
Forward outlook
- Local home prices are declining (-3.0%/yr); year-one equity from $1k of loan paydown is wiped out by about $6k of value loss. Plan a longer hold.
- Shelby County population projected at +23% by 2050 — long-run rental-demand tailwind backs the buy-and-hold thesis.
Negotiation context
- It's been on market 129 days — a 12% lower offer ($163k) is reasonable based on typical stale-listing flexibility.
- 2 sale attempts since 7y ago with the ask held roughly flat each time — persistent listings suggest the price (not the market) is what's stuck; bring a comps-based counter.
Risks & watch-outs
- Watch-outs: flood insurance adds $66/mo.
- Climate carrying-cost: severe flood risk; major wind risk, 58% chance of damaging wind over 30y; extreme-heat days projected 7→21/yr by 2055 (HVAC capex compounding) — expect insurance premiums to compound above CPI over the hold.
Questions for the listing agent
- What do current leases actually rent for vs. the listed asking? Can we see a recent rent roll and the last 12 months of T-12 income?
- It's been on market 129 days. Have you received any prior offers? Is the seller open to a 42% concession, seller financing, or rate buy-down credit?
- What's the actual annual flood-insurance premium (NFIP or private), and is the property in a SFHA with mandatory coverage?
- Why hasn't it sold? Are there any deal-killer items the seller is aware of (foundation, flood, title, zoning, code violations)?
- Is there a deadline driving the sale (1031 exchange, divorce, estate, relocation)? That informs how much negotiation room exists.
- Schools are D-rated, which usually means shorter tenancies and higher turnover. Who's the typical renter profile here, and what's been the actual vacancy rate?
- The area grade is low — what's the realistic commute time and amenity access for the typical tenant pool here? Any planned neighborhood developments (good or bad) we should know about?
- What's the average days-on-market for RENTAL listings here right now (not sales)? A rising rental-DOM trend means longer vacancies and softer asking-rent achievability than the comps imply.
- What's the recent tenant-quality profile in this submarket — average credit score on applications, eviction rate, late-payment / NSF rate, and stable-employment percentage? A property-management company in the area should have these aggregated.
- How much new for-sale + rental construction is in the pipeline within 1–3 miles? Heavy new supply typically softens prices + rents 12–24 months out; constrained supply supports both.
Investment metrics
- 1% rule
- 0.58% ✗
- Cap rate
- 4.52%
- Cash-on-cash
- -6.33%
- DSCR
- 0.72
- GRM
- 14.5
CMA / ARV
- ARV (median comp)
- $200,712
- List price
- $185,000
- Delta
- -7.83%
- Verdict
- FAIR
- Comps
- 3 within 1.0 mi
Show comp detail 12 sales within ~0.75 mi
| Address | Dist | Beds/Ba | Sqft | Sold | Price | $/sf | Match |
|---|---|---|---|---|---|---|---|
| 310 Vine St | 0.14mi | 3/1.5 | 1,376 (+6%) | 3mo | $245,000 | $178 | 79 |
| 6130 Highway 10 | 0.40mi | 3/2.0 | 1,232 (-5%) | 4mo | $260,000 | $211 | 69 |
| 260 Vine St | 0.13mi | 3/1.0 | 1,176 (-9%) | 8mo | $195,000 | $166 | 68 |
| 425 Samford St | 0.40mi | 3/2.0 | 1,283 (-1%) | 14mo | $73,000 | $57 | 68 |
| 4050 Highway 25 | 0.35mi | 2/1.0 (-1) | 1,248 (-4%) | 12mo | $145,000 | $116 | 58 |
| 191 Cambridge Park Dr | 0.41mi | 3/2.0 | 1,183 (-9%) | 12mo | $212,000 | $179 | 56 |
| 232 Cambridge Park Dr | 0.45mi | 3/2.0 | 1,383 (+6%) | 16mo | $212,000 | $153 | 54 |
| 143 Cambridge Park Dr | 0.48mi | 3/2.0 | 1,394 (+7%) | 15mo | $215,000 | $154 | 53 |
| 172 Cambridge Park Dr | 0.42mi | 3/2.0 | 1,134 (-13%) | 9mo | $195,000 | $172 | 52 |
| 450 Shelby St | 0.20mi | 2/1.5 (-1) | 1,123 (-14%) | 16mo | $205,000 | $183 | 48 |
| 155 Cambridge Park Dr | 0.45mi | 3/2.0 | 1,480 (+14%) | 9mo | $199,900 | $135 | 48 |
| 125 Meadow Rd | 0.66mi | 2/1.5 (-1) | 1,224 (-6%) | 7mo | $225,000 | $184 | 46 |
Match score weights: distance 35% · size 25% · config 20% · recency 20%. Top-matched comps best support the ARV.
Projected returns pro-forma
-3.0% appreciation · 3.0% rent growth · sell at horizon
- IRR
- -30.1%
- Equity multiple
- 0.00×
- Total profit
- $-51,669
- Equity at exit
- $27,584
- IRR
- -32.0%
- Equity multiple
- -0.41×
- Total profit
- $-73,043
- Equity at exit
- $15,995
Cash invested: $51,800 (down + closing). Projections, not guarantees.
Landlord ↔ Tenant lean methodology
- Overall (STATE)
- 90 Strongly Landlord-Friendly
- State Alabama
- 90 Strongly Landlord-Friendly · R+15
- County
- — inherits STATE
- City
- — inherits STATE
ZIP-level market 35115
- Home prices YoY
- -19.3%
- Active inventory
- 115
- Price-to-rent
- 14.5×
Monthly cashflow live
- Estimated rent
- $1,067 high interval (Pro) →
- Mortgage (P&I)
- −$970
- Tax from tax record
- −$69 /mo · $827/yr
- Insurance
- −$77
- Flood insurance flood zone
- −$66 /mo · $798/yr
- HOA
- −$0
- Vacancy / Maint / Mgmt
- −$224
- Net cashflow
- $-340
Break-even live
Sensitivity live
| Price | -10% $-235 | -5% $-288 | +0% $-340 | +5% $-392 | +10% $-445 |
|---|---|---|---|---|---|
| Rent | -10% $-424 | -5% $-382 | +0% $-340 | +5% $-298 | +10% $-256 |
| Rate | -1.0pp $-247 | -0.5pp $-293 | base $-340 | +0.5pp $-388 | +1.0pp $-437 |
UW: 25.0% down · 7.5% · 30yr · 1.5% tax · 5.0% vac · 8.0% maint · 8.0% mgmt
Financing live
Cash to close
- Down payment
- $46,250
- Closing costs
- $5,550
- Reserves months
- —
- Total cash needed
- —
Loan-product check · same deal, 3 products live
Conventional
25% down · 7.5% · 30yr
- Down + closing
- —
- Monthly P&I
- —
- Monthly cashflow
- —
- DSCR
- —
- Eligible?
- —
Personal DTI + credit; lowest rate.
DSCR
20% down · 8.5% · 30yr
- Down + closing
- —
- Monthly P&I
- —
- Monthly cashflow
- —
- DSCR
- —
- Eligible?
- —
No personal income docs; deal must DSCR.
Hard money
10% down · 12.0% · 12mo
- Down + closing
- —
- Monthly P&I
- —
- Monthly cashflow
- —
- DSCR
- —
- Eligible?
- —
Short-term bridge; refi at stabilization.
Rent comps 5 comps
| Address | Beds | Baths | Sqft | Rent | $/sqft | DOM | Units | Dist |
|---|---|---|---|---|---|---|---|---|
| 210 Oxford Cir Montevallo, AL | 3.0 | 2.0 | 1100 | $1,050 | $0.95 | 4d | 1 | 0.35mi |
| 430 Canterbury Rd Unit F Montevallo, AL | 2.0 | 2.0 | 960 | $1,130 | $1.18 | 12d | 1 | 0.48mi |
| 1010 Nabors St Montevallo, AL | 1.0–2.0 | 1.0 | 745 | $1,065 | $1.43 | 3d | 1 | 0.57mi |
| 138 Overland Rd Montevallo, AL | 2.0–3.0 | 2.0 | 1175 | $1,050 | $0.89 | 3d | 1 | 0.86mi |
| 195 Salem Rd Montevallo, AL | 2.0 | 2.0 | 937 | $1,000 | $1.07 | 3d | 1 | 1.28mi |
Listing history 22 events
-
2026-06-21days on market $185,000 Active 129 DOM
-
2026-06-18days on market $185,000 Active 126 DOM
-
2026-06-17days on market $185,000 Active 125 DOM
-
2026-06-16days on market $185,000 Active 124 DOM
-
2026-06-15days on market $185,000 Active 123 DOM
-
2026-06-13days on market $185,000 Active 121 DOM
-
2026-06-13days on market $185,000 Active 120 DOM
-
2026-06-10days on market $185,000 Active 118 DOM
-
2026-06-09days on market $185,000 Active 117 DOM
-
2026-06-08days on market $185,000 Active 116 DOM
-
2026-06-07days on market $185,000 Active 115 DOM
-
2026-06-05days on market $185,000 Active 112 DOM
-
2026-06-03days on market $185,000 Active 111 DOM
-
2026-06-02days on market $185,000 Active 110 DOM
-
2026-06-01days on market $185,000 Active 109 DOM
-
2026-05-31days on market $185,000 Active 108 DOM
-
2026-02-12$185,000 Active 184-char remark
Show marketing remark (184 chars)
Conveniently located close to the University of Montevallo, this 3 bedroom 2 bath backs up to the beautiful spring creek. Featuring laminate flooring throughout, and all new appliances
-
2025-06-04price $185,000
-
2019-12-09soldstatus $340,000 Sold
-
2019-10-29historical Contingent
-
2019-06-07price $379,000
-
2019-05-17$399,000 Active
ⓘ Source: listings_history table (triggers on properties + properties_extension) + one-shot
backfill from property_details.listing_events for pre-trigger history.
Tax reassessment forecast AL · Resets to sale price
- Current annual tax
- $827 · $69/mo
- Projected year-2 tax
- $827 · $69/mo
- Expected delta
- $0/yr ($0/mo · 0.0%)
ⓘ Screening estimate from a state-policy table — verify with the county assessor before closing.
Climate risk First Street
- Flood 8/10 Severe FEMA zone X (unshaded) · 99% chance over 30 yrs
- Wildfire 4/10 Moderate
- Heat 7/10 Severe 7 d/yr ≥107°F today · 21 d/yr by 30 yrs out
- Wind 6/10 Major 58% chance of damaging wind over 30 yrs
- Air quality 2/10 Low 2 unhealthy d/yr today · 2 by 30 yrs out
Nearby sold comps map
Loading sold comps map…
Walkable amenities ~0.75 mi
Loading nearby amenities…
Taxation est. · year 1
- Rental income
- $12,801
- − Mortgage interest
- −$10,363
- − Property taxes
- −$827
- − Insurance
- −$1,722
- − Repairs & maintenance
- −$1,024
- − Management
- −$1,024
- − Depreciation
- −$5,382
- Taxable loss
- −$7,542
- Est. tax savings @ 24.0%
- +$1,810
- After-tax cash flow
- $-2,269/yr
For passive investors: Depreciation is non-cash, so a rental often shows a tax loss while cash-flowing — sheltering income. Rental losses are passive: they offset passive income freely, and up to $25,000/yr can offset ordinary (W-2) income if you actively participate and your MAGI is under $100k (phasing out to $0 by $150k); unused losses carry forward. On sale, claimed depreciation is recaptured at up to 25%, and gains may owe capital-gains tax (a 1031 exchange can defer both). Figures are a year-1 estimate at your 24.0% rate — not tax advice; consult a CPA.
Schools (NCES district)
- District
- Shelby County
- NCES district ID
- 0103030
- Math proficiency
- 30% ▼ -28.00%
- Reading proficiency
- 58% ▲ 2.00%
- Median HH income
- $66,672
- Composite
- 39.29/100
- National rank
- #3995
- State rank
- #16 of 129 in AL
Livability — Montevallo
- Score
- 62/100
- State rank
- #217
- US rank
- #16530
Category grades
Schools grade is shown separately in the Schools card above.
Census & demographics
- Census place
- Montevallo, AL
- Population (ZIP)
- 16,911
Population outlook (Shelby County) Hauer SSP2
- Today (2025)
- 237,024 people
- By 2030
- 249,868 · +5.4%
- By 2040
- 272,778 · +15.1%
- By 2050
- 291,062 · +22.8%
- By 2075
- 326,049 · +37.6%
- By 2100
- 335,870 · +41.7%
Race, ethnicity, and origin ACS 2023
- Neighborhood character
- Diverse neighborhood (Simpson 0.58)
- Race & ethnicity
- White 59% Hispanic / Latino 21% Black 15% Two or more races 6%
- Hispanic origin (detail)
- Mexican 19%
- Common ancestry
- Slovak 2% Iranian 1% Italian 1%
- Foreign-born
- 11% · Canada, China, Jamaica
- Languages at home
- 78% English-only · Spanish 21% Chinese 1%
Political lean MEDSL · Shelby
- 2024 margin
- Solid R (+40.9) · D 29.0% · R 69.9% · Other 1.1%
- 2008→2024 swing
- +12.6pp toward D · 2008: -53.4pp · 2024: -40.9pp
- All cycles
- 2024: R+40.9 2020: R+40.4 2016: R+50.3 2012: R+55.6 2008: R+53.4
Not yet ingested
- Civics
- —
Market trends
- HPI YoY
- ▼ -49.55%
- Current HPI
- 207.2205
- Rent YoY
- —
- Metro
- —
- State GDP YoY
- ▲ 2.94%
- F500 in state
- 4
Industry mix (Fortune 500 HQ in AL)
| Industry | F500 HQs | Revenue |
|---|---|---|
| Financial Services | 1 | $8B |
|
||
| Healthcare | 1 | $5B |
|
||
Price history
-53.6% since first listed6 events — show timeline
- 2026-02-12 Listed $185,000 Greater Alabama MLS
- 2025-06-04 Price Changed $185,000 Greater Alabama MLS
- 2019-12-09 Sold (MLS) $340,000 Greater Alabama MLS
- 2019-10-29 Contingent — Greater Alabama MLS
- 2019-06-07 Price Changed $379,000 Greater Alabama MLS
- 2019-05-17 Listed $399,000 Greater Alabama MLS
Property tax history
+5.3%/yrLatest (2025): $827 · +5.5% YoY. Source: county tax records.
Cash-flow waterfall
monthlySold comps — $/sqft
last 12 mo · ≤1 miLoading sold comps…