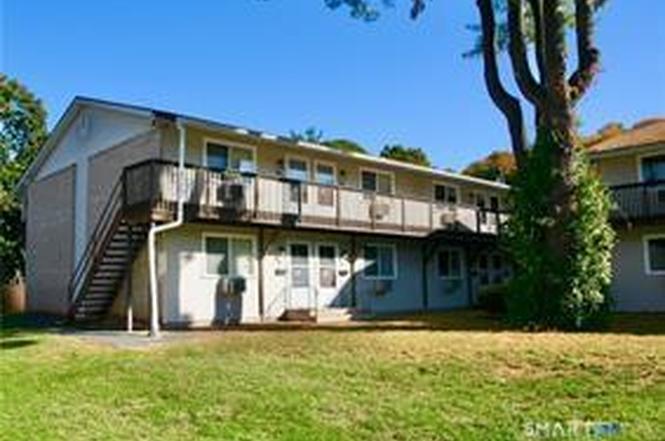
26 Bostwick ARMS #26 · New Milford, CT
Flood risk 1/10 · Minimal
- FEMA flood zone
- X (shaded)
- Chance of flooding over 30 yrs
- 0.0%
- Est. flood insurance / yr
- $507 – $1,088
Fire risk 1/10 · Minimal
- Est. fire insurance / yr
- $829 – $1,539
Heat risk 5/10 · Moderate
- Hot days now (above 97°F)
- 7 days/yr
- Hot days in 30 yrs
- 16 days/yr
Wind risk 5/10 · Moderate
- Chance of severe wind over 30 yrs
- 26.0%
Air-quality risk 3/10 · Minor
- Unhealthy air days now
- 2 days/yr
- Unhealthy air days in 30 yrs
- 3 days/yr
Risk factors via First Street. Map © Google.
Why this score? — see what drove the C- grade
The composite is a weighted blend of 9 inputs, each scored 0–100. Each bar is that input's sub-score; the figure is the points it added to the 100-point composite (weight × sub-score).
- Cash flow +20.0/30.0
- ARV discount +7.5/15.0
- 1% rule +7.4/10.0
- DSCR +6.4/10.0
- Livability +4.3/5.0
- Schools +3.6/10.0
- Rent growth +2.5/5.0
- Condition / age +2.5/5.0
- Appreciation +0.0/10.0
$145,000
🖨 Deal sheet 📄 Offer letter ✓ Due diligence
Listing remarks
One bedroom condo in great shape. .. close to Village Center. One level living. .. sorry but management does not permit dogs.
Key facts
- One bedroom condo
- One level living
- $237 HOA
Tags
Neighborhood map
What this means for you Summary
Snapshot
- This is a 1-bed/1.0-bath condo listed at $145k.
Deal economics
- At list price, monthly cash flow is $179 ($2k/yr) — positive.
- The deal already cash-flows at list — no discount required.
- Meets the 1% rule at list price ($2k rent vs $145k).
- Recommended offer: $143k (1.5% below list) — sets the bar for market timing.
- Cap rate 7.8% vs local median 3.6% in New Milford — top-decile yield for the area; either an underpriced asset or a hidden risk that comps aren't pricing in. Stress-test before assuming the spread holds.
Location & tenants
- Location reads 86/100 on livability (#2 in CT, #371 nationally) — a professional / high-income tenant draw. Strengths: crime A+, commute A+, housing A+; Watch: cost of living C-, amenities D-.
- New Milford School District (suburban): math 29% / reading 47% proficiency, ranked #100 of 153 in CT (top 65%) — families likely to look elsewhere, expect single-tenant / working-renter base with shorter leases; only 15% free/reduced lunch — higher-income household profile.
- Zoned schools: Hill And Plain School (377 students, 47% FRL); New Milford High School (math 33% / reading 62%, grade D, #91 of 194 statewide, top 47%, 1,247 students, 31% FRL) — zoned schools average 39% FRL vs 15% district-wide (24 pts higher); higher-poverty schools than district average — tighter screening recommended.
- Market conditions: 147 active listings in the ZIP; 2 comparable units currently listed for rent nearby; solid renter incomes; 1,151 units permitted in Western Connecticut Planning Region in 2024 (714 in 5+ unit buildings).
Forward outlook
- Local home prices are declining (-3.0%/yr); year-one equity from $1k of loan paydown is wiped out by about $4k of value loss. Plan a longer hold.
Negotiation context
- It's been on market 27 days — a 2% lower offer ($143k) is reasonable based on typical stale-listing flexibility.
Risks & watch-outs
- Climate carrying-cost: moderate wind risk, 26% chance of damaging wind over 30y; extreme-heat days projected 7→16/yr by 2055 (HVAC capex compounding) — expect insurance premiums to compound above CPI over the hold.
Questions for the listing agent
- Built in 1969 — when were the roof, HVAC, electrical panel, plumbing, and water heater last replaced?
- What does the HOA fee cover, when was the last increase, and are there any pending special assessments or reserve-fund shortfalls?
- Any open or pending special assessments — roof, HVAC, plumbing, elevator, façade? What's the per-unit balance and payoff schedule, and is the seller paying it off at close or rolling it to the buyer?
- Is there a deadline driving the sale (1031 exchange, divorce, estate, relocation)? That informs how much negotiation room exists.
- What's the average days-on-market for RENTAL listings here right now (not sales)? A rising rental-DOM trend means longer vacancies and softer asking-rent achievability than the comps imply.
- What's the recent tenant-quality profile in this submarket — average credit score on applications, eviction rate, late-payment / NSF rate, and stable-employment percentage? A property-management company in the area should have these aggregated.
- How much new apartment / multifamily construction is in the pipeline within 1–3 miles? Heavy new supply (>2% of stock underway) typically softens rents 12–24 months out; light construction supports rent growth.
Investment metrics
- 1% rule
- 1.24% ✓
- Cap rate
- 7.77%
- Cash-on-cash
- 5.28%
- DSCR
- 1.24
- GRM
- 6.7
CMA / ARV
No comps found within radius.
Projected returns pro-forma
-3.0% appreciation · 3.0% rent growth · sell at horizon
- IRR
- -8.0%
- Equity multiple
- 0.71×
- Total profit
- $-11,942
- Equity at exit
- $21,620
- IRR
- 1.7%
- Equity multiple
- 1.12×
- Total profit
- $4,958
- Equity at exit
- $12,537
Cash invested: $40,600 (down + closing). Projections, not guarantees.
Landlord ↔ Tenant lean methodology
- Overall (STATE)
- 27 Tenant-Leaning
- State Connecticut
- 27 Tenant-Leaning · D+7
- County
- — inherits STATE
- City
- — inherits STATE
ZIP-level market 06776
- Active inventory
- 147
- Price-to-rent
- 6.7×
Monthly cashflow live
- Estimated rent
- $1,795 medium interval (Pro) →
- Mortgage (P&I)
- −$760
- Tax est. 1.5%
- −$181 /mo · $2,175/yr
- Insurance
- −$60
- HOA
- −$237
- Vacancy / Maint / Mgmt
- −$377
- Net cashflow
- $179
Break-even live
UW: 25.0% down · 7.5% · 30yr · 1.5% tax · 5.0% vac · 8.0% maint · 8.0% mgmt
Financing live
Cash to close
- Down payment
- $36,250
- Closing costs
- $4,350
- Reserves months
- —
- Total cash needed
- —
Loan-product check · same deal, 3 products live
Conventional
25% down · 7.5% · 30yr
- Down + closing
- —
- Monthly P&I
- —
- Monthly cashflow
- —
- DSCR
- —
- Eligible?
- —
Personal DTI + credit; lowest rate.
DSCR
20% down · 8.5% · 30yr
- Down + closing
- —
- Monthly P&I
- —
- Monthly cashflow
- —
- DSCR
- —
- Eligible?
- —
No personal income docs; deal must DSCR.
Hard money
10% down · 12.0% · 12mo
- Down + closing
- —
- Monthly P&I
- —
- Monthly cashflow
- —
- DSCR
- —
- Eligible?
- —
Short-term bridge; refi at stabilization.
Rent comps 2 comps
| Address | Beds | Baths | Sqft | Rent | $/sqft | DOM | Units | Dist |
|---|---|---|---|---|---|---|---|---|
| 6 Hillside Ave Unit B New Milford, CT | 1.0 | 1.0 | 624 | $1,850 | $2.96 | 43d | 1 | 0.67mi |
| 63 Glen Ridge Ct #63 New Milford, CT | 1.0 | 1.0 | 682 | $2,050 | $3.01 | 43d | 1 | 1.33mi |
HOA detail condo
- Monthly dues
- $237 · $2,844/yr
- Assessments
- None detected in remarks — confirm with the listing agent.
Listing history 3 events
-
2026-04-03status Under Contract
-
2026-03-18historical Under Contract - Continue to Show
-
2026-03-04$145,000 Active
ⓘ Source: listings_history table (triggers on properties + properties_extension) + one-shot
backfill from property_details.listing_events for pre-trigger history.
Climate risk First Street
- Flood 1/10 Low FEMA zone X (shaded) · 0% chance over 30 yrs
- Wildfire 1/10 Low
- Heat 5/10 Major 7 d/yr ≥97°F today · 16 d/yr by 30 yrs out
- Wind 5/10 Major 26% chance of damaging wind over 30 yrs
- Air quality 3/10 Moderate 2 unhealthy d/yr today · 3 by 30 yrs out
Nearby sold comps map
Loading sold comps map…
Walkable amenities ~0.75 mi
Loading nearby amenities…
Taxation est. · year 1
- Rental income
- $21,536
- − Mortgage interest
- −$8,122
- − Property taxes
- −$2,175
- − Insurance
- −$725
- − Repairs & maintenance
- −$1,723
- − Management
- −$1,723
- − HOA
- −$2,844
- − Depreciation
- −$4,218
- Taxable income
- $5
- Est. tax owed @ 24.0%
- −$1
- After-tax cash flow
- $2,143/yr
For passive investors: Depreciation is non-cash, so a rental often shows a tax loss while cash-flowing — sheltering income. Rental losses are passive: they offset passive income freely, and up to $25,000/yr can offset ordinary (W-2) income if you actively participate and your MAGI is under $100k (phasing out to $0 by $150k); unused losses carry forward. On sale, claimed depreciation is recaptured at up to 25%, and gains may owe capital-gains tax (a 1031 exchange can defer both). Figures are a year-1 estimate at your 24.0% rate — not tax advice; consult a CPA.
Schools (NCES district)
- District
- New Milford School District
- NCES district ID
- 0902850
- Math proficiency
- 29% ▼ -22.00%
- Reading proficiency
- 47% ▼ -11.00%
- Median HH income
- $81,576
- Composite
- 35.78/100
- National rank
- #4839
- State rank
- #100 of 153 in CT
Livability — New Milford
- Score
- 86/100
- State rank
- #2
- US rank
- #371
Category grades
Schools grade is shown separately in the Schools card above.
Census & demographics
- Census place
- New Milford, CT
- County
- Litchfield County · 81,203 people
- City population
- 27,010
- Metro
- Torrington, CT
- Population (ZIP)
- 27,010
- Household income
- $104,112
- Rent vs Own
- Severe rent burden
- 627.0
Population outlook (Western Connecticut County) Hauer SSP2
- By 2040
- 685,031
Race, ethnicity, and origin ACS 2023
- Neighborhood character
- Predominantly White (77%)
- Race & ethnicity
- White 77% Hispanic / Latino 12% Two or more races 7% Black 4% Asian 4%
- Hispanic origin (detail)
- Puerto Rican 4% Dominican 2%
- Common ancestry
- Romanian 4% Lithuanian 3% Italian 2%
- Foreign-born
- 12% · Canada, China
- Languages at home
- 86% English-only · Spanish 6% Other Indo-European 3% Chinese 1%
Political lean MEDSL · Western Connecticut
- 2024 margin
- D (+19.1) · D 58.8% · R 39.7% · Other 1.6%
- All cycles
- 2024: D+19.1
Not yet ingested
- Civics
- —
Market trends
- HPI YoY
- ▼ -264.52%
- Current HPI
- 305.6036
- Rent YoY
- —
- Metro
- Torrington, CT
- State GDP YoY
- ▲ 1.06%
- F500 in state
- 38
Industry mix (Fortune 500 HQ in CT)
| Industry | F500 HQs | Revenue |
|---|---|---|
| Industrial Machinery | 4 | $38B |
|
||
| Insurance | 3 | $71B |
|
||
| Financial Services | 2 | $25B |
|
||
| Transportation / Logistics | 2 | $18B |
|
||
| Healthcare | 1 | $247B |
|
||
| Telecommunications | 1 | $55B |
|
||
Price history
3 events — show timeline
- 2026-04-03 Pending — Smart MLS
- 2026-03-18 Contingent — Smart MLS
- 2026-03-04 Listed $145,000 Smart MLS
Cash-flow waterfall
monthlySold comps — $/sqft
last 12 mo · ≤1 miLoading sold comps…